 |
| |
| |
| |
| |
| |
| |
|

| TissGeneSummary for PPIL6 |
 Gene summary Gene summary |
| Basic gene information | Gene symbol | PPIL6 |
| Gene name | peptidylprolyl isomerase (cyclophilin)-like 6 | |
| Synonyms | PPIase|RSPH12|bA425D10.6|dJ919F19.1 | |
| Cytomap | UCSC genome browser: 6q21 | |
| Type of gene | protein-coding | |
| RefGenes | NM_001111298.2, NM_001286360.1,NM_001286361.1,NM_173672.4,NR_104429.1, | |
| Description | cyclophilin-like protein PPIL6peptidyl-prolyl cis-trans isomerase-like 6peptidyl-prolyl cis-trans isomerase-like variant aradial spoke 12 homologrotamase PPIL6 | |
| Modification date | 20141207 | |
| dbXrefs | HGNC : HGNC | |
| Ensembl : ENSG00000185250 | ||
| HPRD : 15165 | ||
| Vega : OTTHUMG00000036593 | ||
| Protein | UniProt: go to UniProt's Cross Reference DB Table | |
| Expression | CleanEX: HS_PPIL6 | |
| BioGPS: 285755 | ||
| Pathway | NCI Pathway Interaction Database: PPIL6 | |
| KEGG: PPIL6 | ||
| REACTOME: PPIL6 | ||
| Pathway Commons: PPIL6 | ||
| Context | iHOP: PPIL6 | |
| ligand binding site mutation search in PubMed: PPIL6 | ||
| UCL Cancer Institute: PPIL6 | ||
| Assigned class in TissGDB* | C | |
| Included tissue-specific gene expression resources | TiGER,GTEx | |
| Specific-tissues in normal samples (assigned by TissGDB using HPA, TiGER, and GTEx) | Testis | |
| Cancer types related to the specific-tissues in cancer samples (assigned by TissGDB using TCGA) | TGCT | |
| Reference showing the relevant tissue of PPIL6 | ||
| Description by TissGene annotations | ||
| * Class A consists of genes with literature evidence and is part of the cTissGenes. Class B consists of only cTissGenes without additional evidence. The remaining genes belong to Class C. |
| Gene ontology having evidence of Inferred from Direct Assay (IDA) from Entrez |
| GO ID | GO term | PubMed ID |
| Top |
| TissGeneExp for PPIL6 |
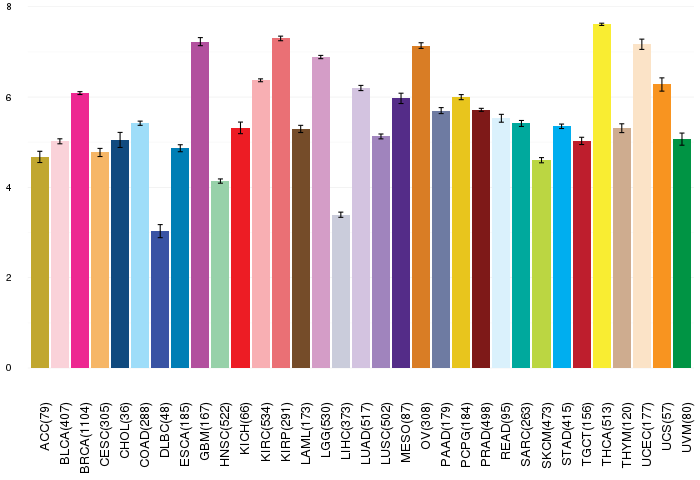
| Gene expressions across 28 cancer types (X-axis: cancer type and Y-axis: log2(norm_counts+1)) (TCGA IlluminaHiSeq_RNASeqV2, pan-cancer normalized log2(norm_counts+1) data, version 2016-08-16) |
 |
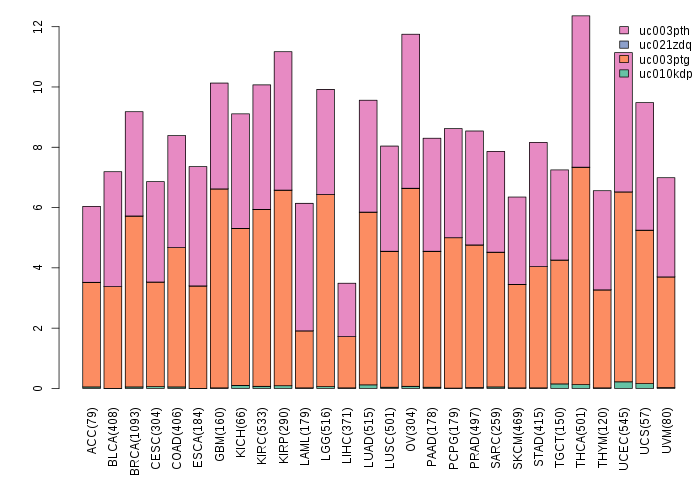
| Gene isoform expressions across 28 cancer types (X-axis: cancer type and Y-axis: log2(norm_counts+1)) (TCGA pan-cancer tcga_rsem_isoform_tpm, version 2016-09-01) |
 |
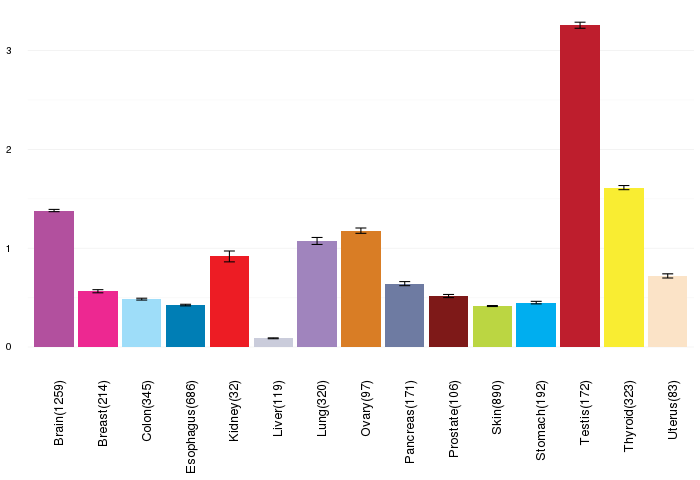
| Gene expressions across normal tissues of GTEx data (GTEx GTEx_Analysis_v6_RNA-seq_RNA-SeQCv1.1.8_gene_rpkm.gct) - Here, we shows the matched tissue types only among our 28 cancer types. |
 |
| Different expressions across 14 cancer types with more than 10 samples between matched tumors and normals (X-axis: cancer type and Y-axis: log2(norm_counts+1)) (TCGA IlluminaHiSeq_RNASeqV2, pan-cancer normalized log2(norm_counts+1) data, version 2016-08-16) |
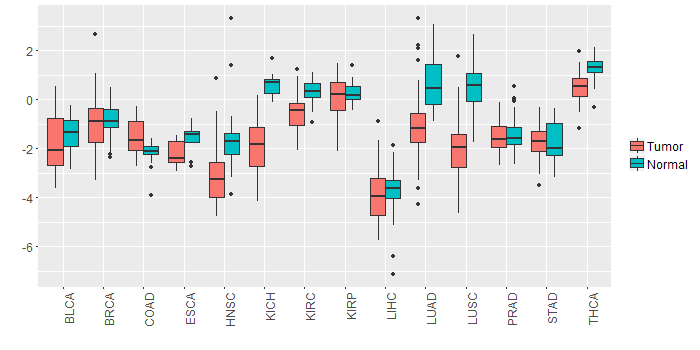 |
| - Significantly differentially expressed cancer types and information. (|Fold change|>1 and FDR<0.05) |
| Cancer type | Mean(exp) in tumor | Mean(exp) in matched normal | Log2FC | P-val. | FDR |
| LUSC | -2.042059665 | 0.50857759 | -2.550637255 | 7.32E-20 | 8.45E-19 |
| LUAD | -1.037252701 | 0.676990403 | -1.714243103 | 1.21E-11 | 8.35E-11 |
| KICH | -1.852513391 | 0.590422609 | -2.442936 | 2.77E-11 | 2.41E-10 |
| HNSC | -3.072350135 | -1.660491995 | -1.41185814 | 1.65E-07 | 1.53E-06 |
| Top |
| TissGene-miRNA for PPIL6 |
| Significantly anti-correlated miRNAs of TissGene across 28 cancer types (Gene-miRNA relations from TargetScanHuman Relsease 7.1, Conserved_Site_Context_Scores.txt.zip, 06.01.2016) (TCGA IlluminaHiSeq_miRNASeq, log2(RPM+1) data, version 2016-11-21) (TCGA IlluminaHiSeq_RNASeqV2, log2(normalized_count+1) data, version 2016-08-16) (Spearman’s Rank Correlation (p-value<0.05 and coefficient<-0.25)) |
| Cancer type | miRNA id | miRNA accession | P-val. | Coeff. | # samples |
| Top |
| TissGeneMut for PPIL6 |
| TissGeneSNV for PPIL6 |
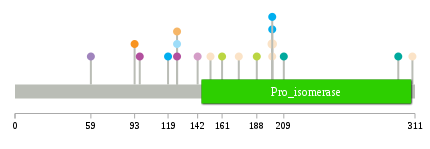
| nsSNV counts per each loci. Different colors of circles represent different cancer types. Circle size denotes number of samples. (TCGA somatic mutation (SNPs and small INDELs) data, version 2016-04-25) * Click on the image to enlarge it in a new window. |
 |
 |
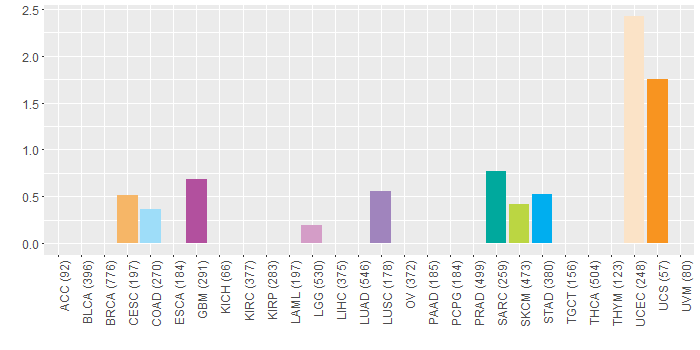
| Somatic nucleotide variants of TissGene across 28 cancer types (X-axis: cancer type and Y-axis: % of mutated samples) The numbers in parentheses are numbers of samples with mutation (nsSNVs). (TCGA somatic mutation (SNPs and small INDELs) data, version 2016-04-25) |
 |
| - nsSNVs sorted by frequency. |
| AAchange | Cancer type | # samples |
| p.R200* | UCEC | 2 |
| p.P309H | UCEC | 1 |
| p.F174C | UCEC | 1 |
| p.E161K | SKCM | 1 |
| p.A126T | GBM | 1 |
| p.R200Q | UCEC | 1 |
| p.I59V | LUSC | 1 |
| p.R200* | STAD | 1 |
| p.G188D | SKCM | 1 |
| p.K119E | STAD | 1 |
| p.F93C | UCS | 1 |
| p.D142Y | LGG | 1 |
| p.I298T | SARC | 1 |
| p.R200X | STAD | 1 |
| p.A126T | COAD | 1 |
| p.S92Y | READ | 1 |
| p.A126T | CESC | 1 |
| p.Q97* | GBM | 1 |
| p.G209R | SARC | 1 |
| p.S152Y | UCEC | 1 |
| Top |
| TissGeneCNV for PPIL6 |
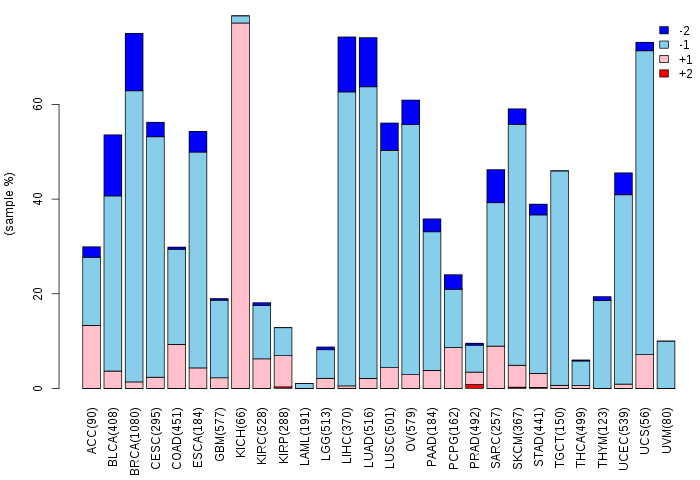
| Copy number variations of TissGene across 28 cancer types (X-axis: cancer type and Y-axis: % of CNV samples) (TCGA Gistic2_CopyNumber_Gistic2_all_data_by_genes, Gistic2 copy number data, version 2016-08-16) |
 |
| Top |
| TissGeneFusions for PPIL6 |
| Fusion genes including TissGene (ChimerDB 3.0, 2016-12-01 and TCGA fusion Portal 2015-12-01) |
| Database | Src | Cancer type | Sample | Fusion gene | ORF | 5'-gene BP | 3'-gene BP |
| Chimerdb3.0 | FusionScan | BRCA | TCGA-E2-A155-01A | ZNF322-PPIL6 | 5'UTR-CDS | chr6:26658785 | chr6:109721373 |
| TCGAfusionPortal | PRADA | BRCA | TCGA-E2-A155-01A | ZNF322-PPIL6 | 5UTR-CDS | Chr6:26658786 | Chr6:109721373 |
| Top |
| TissGeneNet for PPIL6 |
| Co-expressed gene networks based on protein-protein interaction data (CePIN) (TCGA IlluminaHiSeq_RNASeqV2, pan-cancer normalized log2(norm_counts+1) data, version 2016-08-16) (PINA2 ppi data) |
| Top |
| TissGeneProg for PPIL6 |
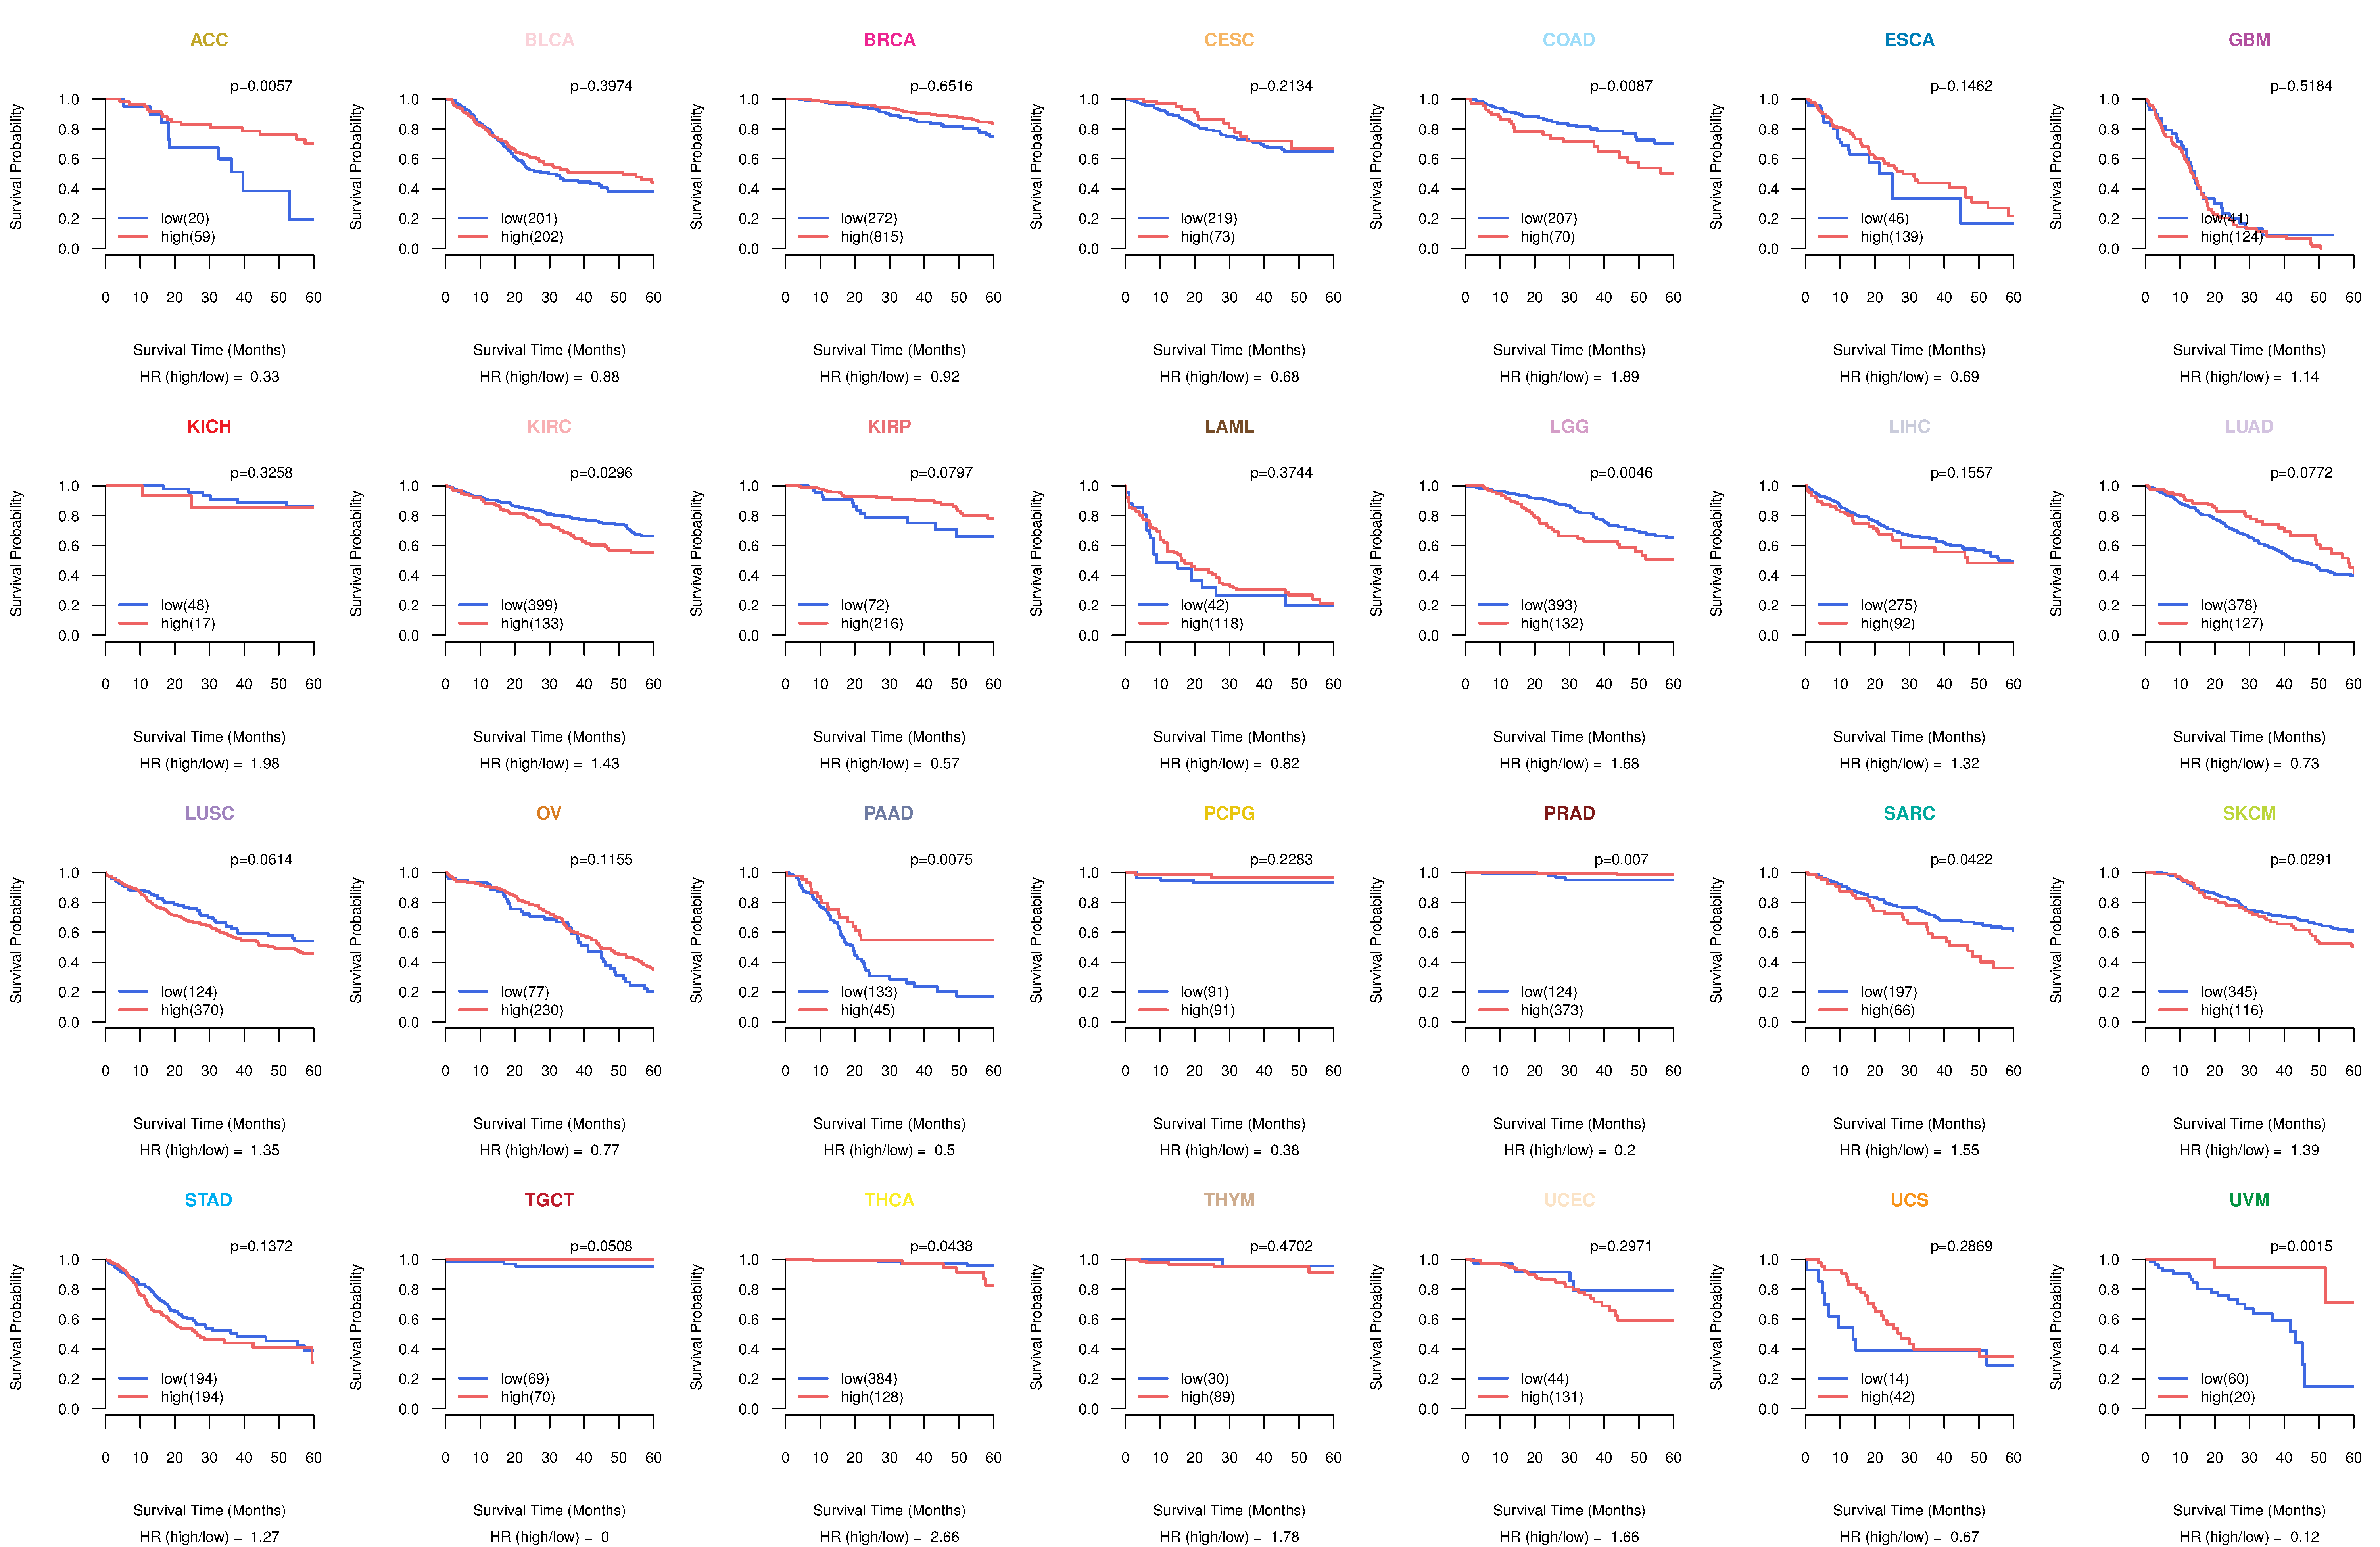
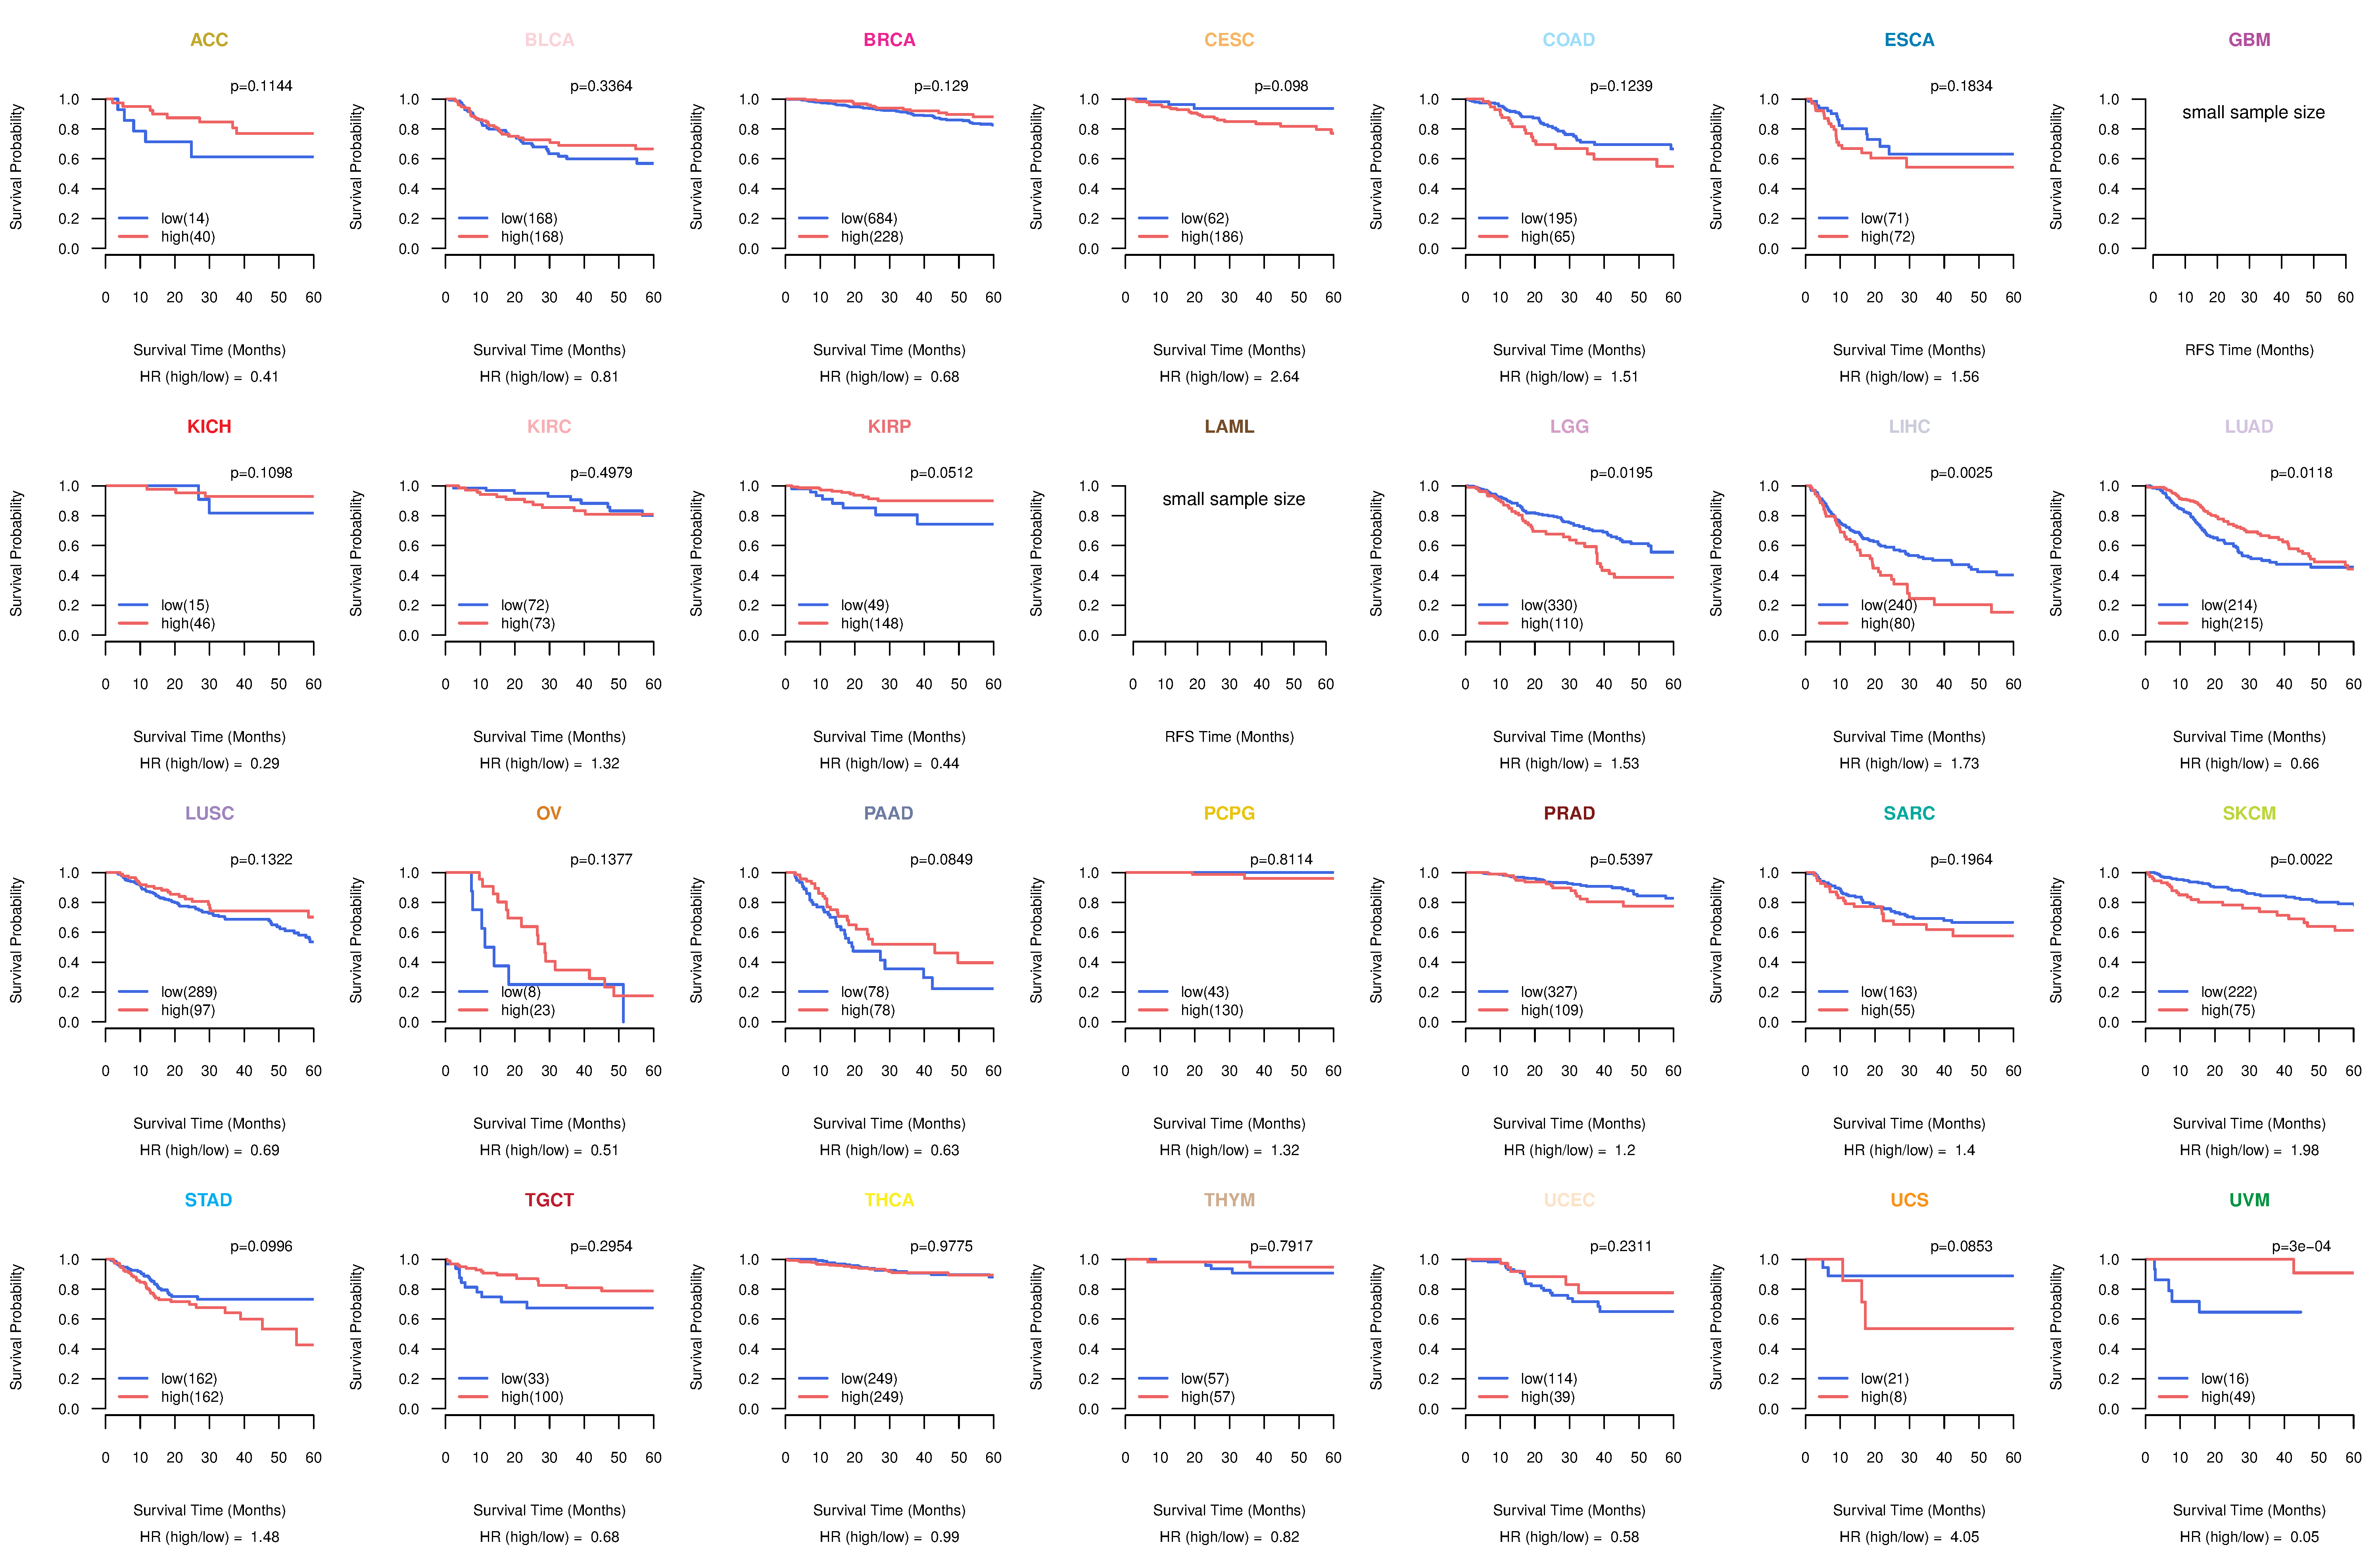
| Kaplan-Meier plots with logrank tests of overall survival (OS) using 28 cancer types (TCGA IlluminaHiSeq_RNASeqV2, pan-cancer normalized log2(norm_counts+1) data, version 2016-08-16) (TCGA clinicalMatrix, phenotype data, version 2016-04-27) * Click on the image to enlarge it in a new window. |
 |
| Kaplan-Meier plots with logrank test of relapse free survival (RFS) using 28 cancer types (TCGA IlluminaHiSeq_RNASeqV2, pan-cancer normalized log2(norm_counts+1) data, version 2016-08-16) (TCGA clinicalMatrix, phenotype data, version 2016-04-27) * Click on the image enlarge it in a new window. |
 |
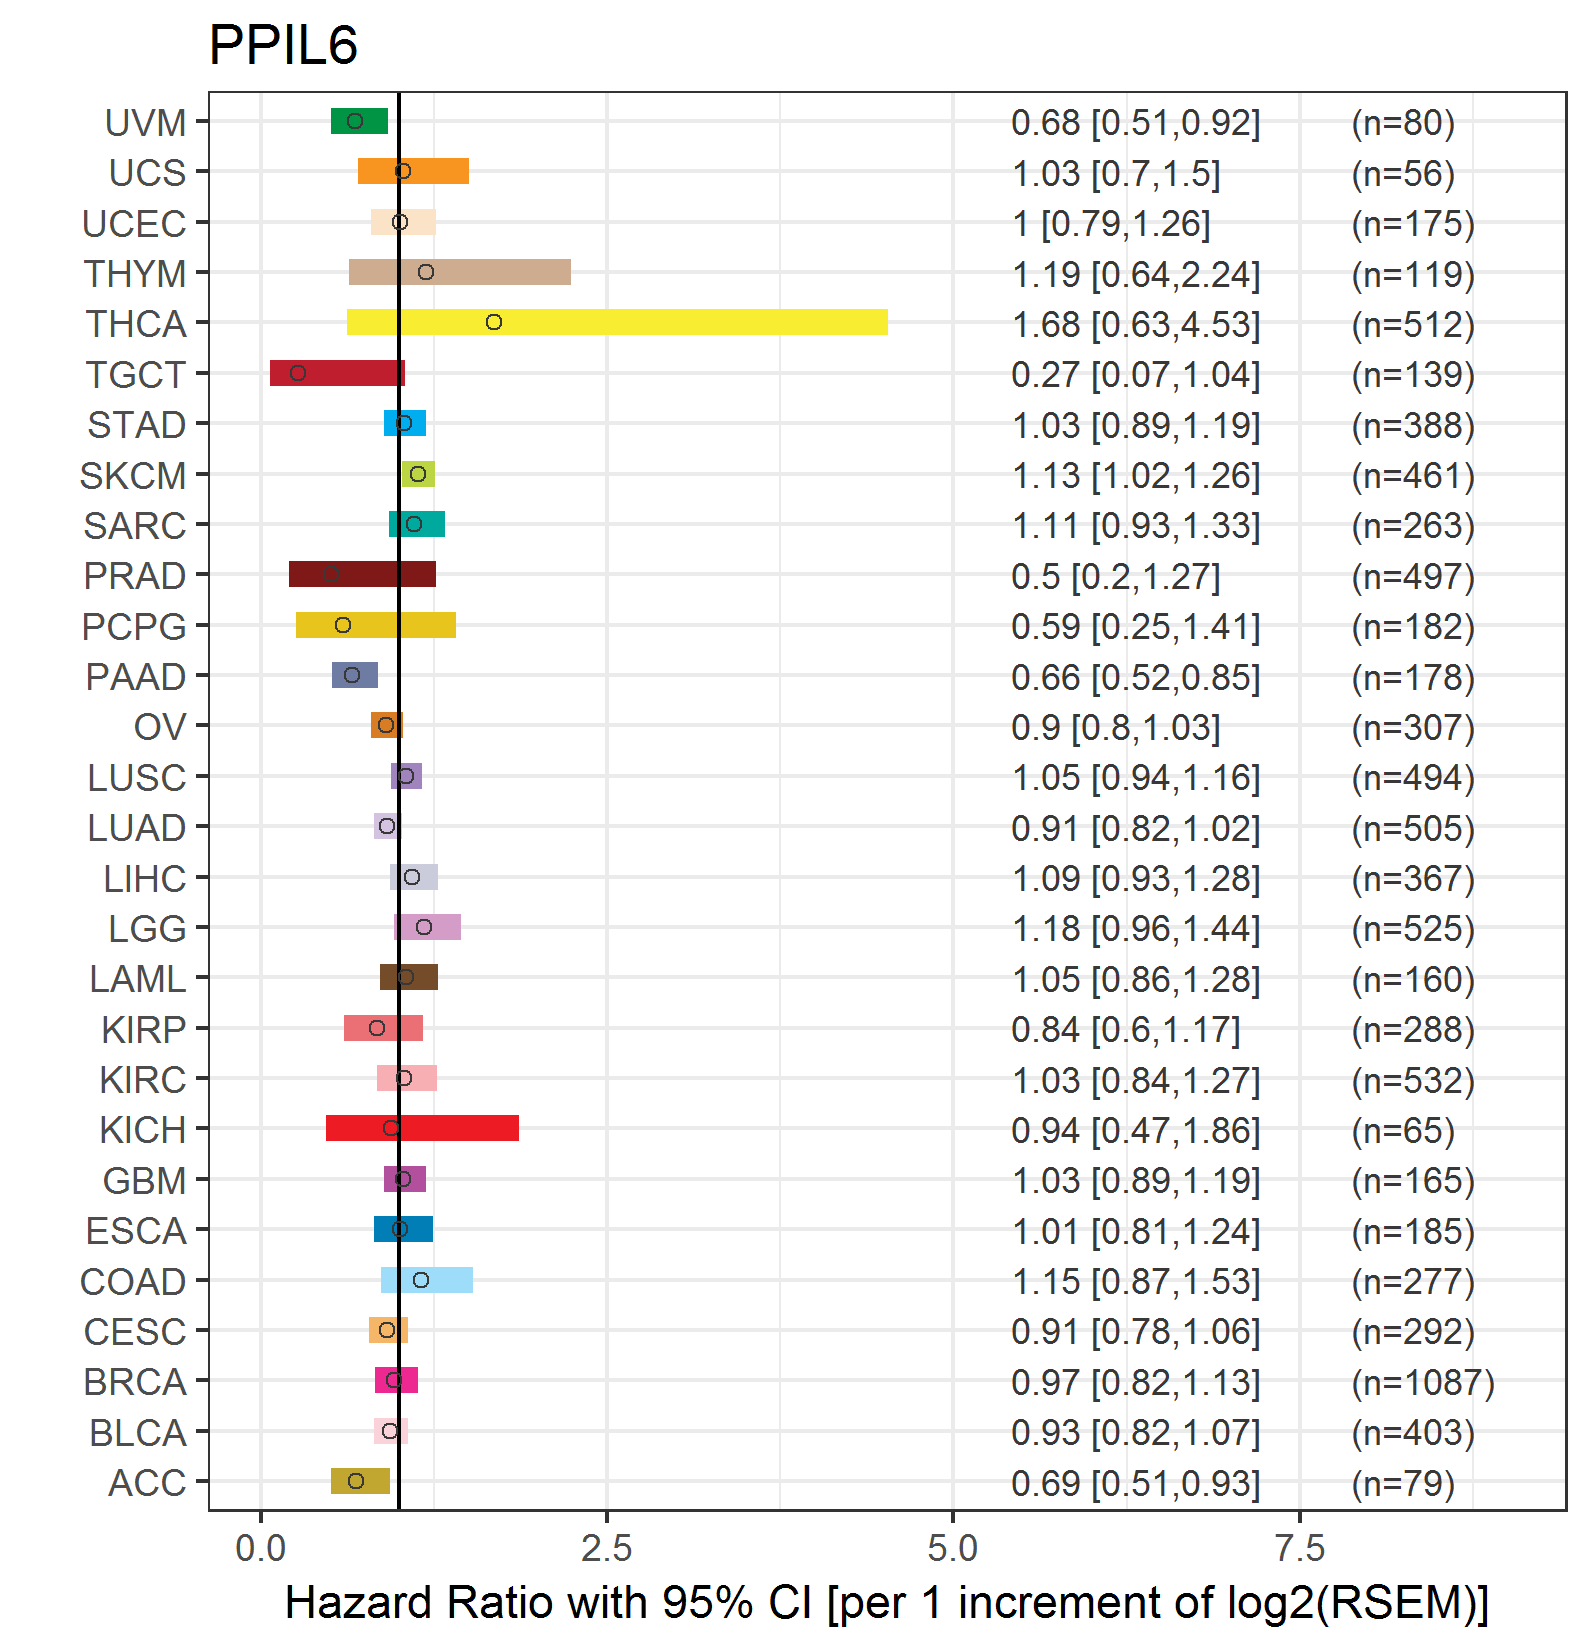
| Forest plot of Cox proportional hazard ratio (HR) and 95% CI of overall survival (OS) using 28 cancer types (TCGA IlluminaHiSeq_RNASeqV2, pan-cancer normalized log2(norm_counts+1) data, version 2016-08-16) (TCGA clinicalMatrix, phenotype data, version 2016-04-27) * Click on the image enlarge it in a new window. |
 |
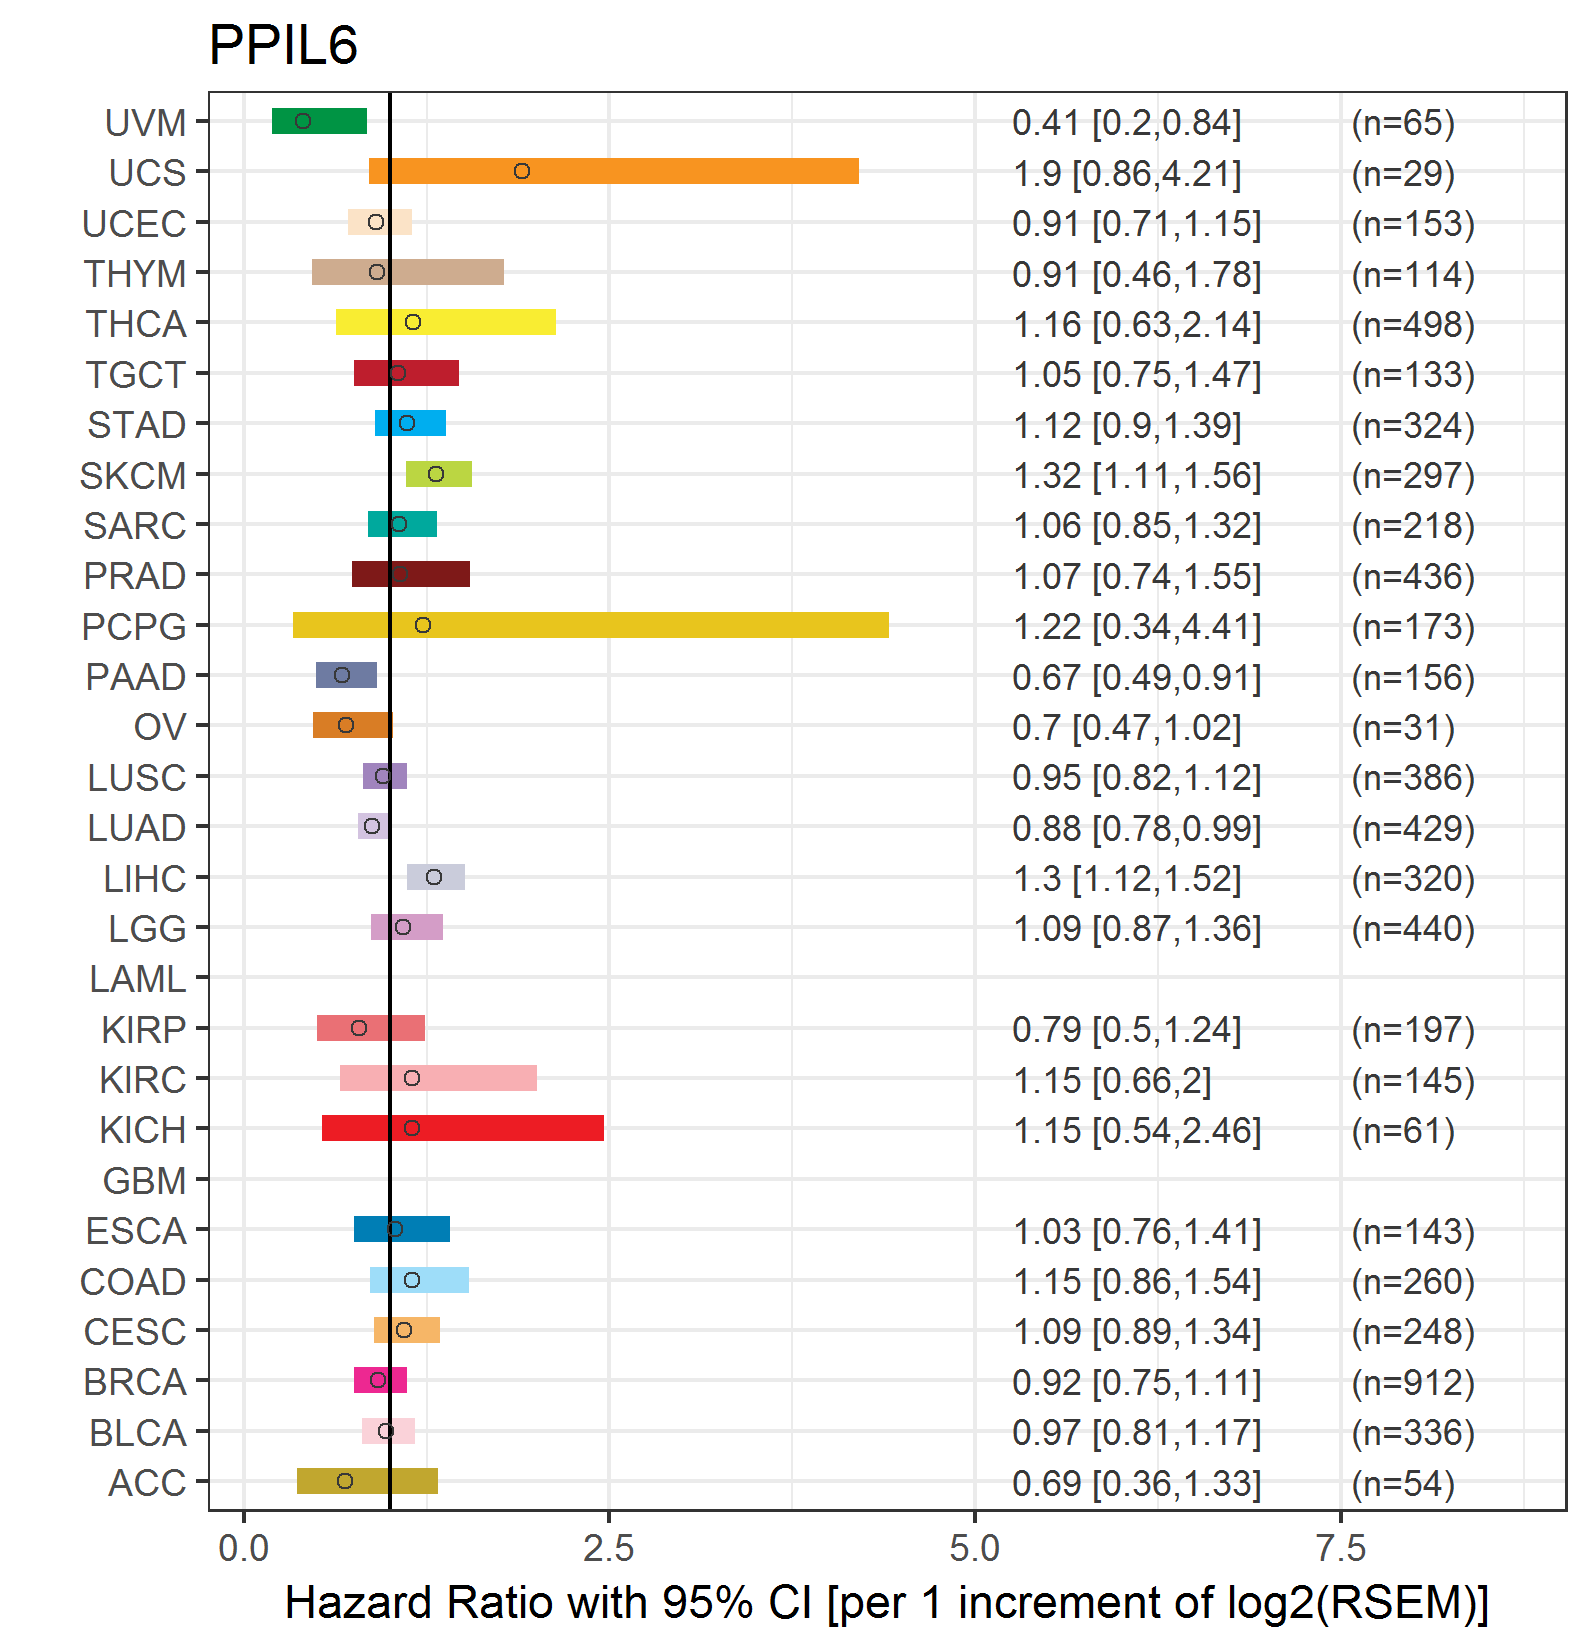
| Forest plot of Cox proportional hazard ratio (HR) and 95% CI of relapse free survival (RFS) using 28 cancer types (TCGA IlluminaHiSeq_RNASeqV2, pan-cancer normalized log2(norm_counts+1) data, version 2016-08-16) (TCGA clinicalMatrix, phenotype data, version 2016-04-27) * Click on the image enlarge it in a new window. |
 |
| Top |
| TissGeneClin for PPIL6 |
| TissGeneDrug for PPIL6 |
| Drug information targeting TissGene (DrugBank Version 5.0.6, 2017-04-01) |
| DrugBank ID | Drug name | Drug activity | Drug type | Drug status |
| Top |
| TissGeneDisease for PPIL6 |
| Disease information associated with TissGene (DisGeNet, 2016-06-01) |
| Disease ID | Disease name | # pubmeds | Source |
| umls:C0374997 | Helicobacter pylori (H. pylori) infection in conditions classified elsewhere and of unspecified site | 1 | BeFree |
|
Copyright 2016-Present - The University of Texas Health Science Center at Houston (UTHealth) Web File Viewing | How to Report, Fraud, Waste and Abuse | State of Texas | Statewide Search | Texas Homeland Security | Site Policies |