 |
| |
| |
| |
| |
| |
| |
|

| TissGeneSummary for SPATA31E1 |
 Gene summary Gene summary |
| Basic gene information | Gene symbol | SPATA31E1 |
| Gene name | SPATA31 subfamily E, member 1 | |
| Synonyms | C9orf79|FAM75E1 | |
| Cytomap | UCSC genome browser: 9q22.1 | |
| Type of gene | protein-coding | |
| RefGenes | NM_178828.4, | |
| Description | FAM75-like protein C9orf79XXyac-YM21GA2.5family with sequence similarity 75, member E1protein FAM75E1spermatogenesis-associated protein 31E1 | |
| Modification date | 20141207 | |
| dbXrefs | HGNC : HGNC | |
| Ensembl : ENSG00000177992 | ||
| HPRD : 12979 | ||
| Vega : OTTHUMG00000020157 | ||
| Protein | UniProt: go to UniProt's Cross Reference DB Table | |
| Expression | CleanEX: HS_SPATA31E1 | |
| BioGPS: 286234 | ||
| Pathway | NCI Pathway Interaction Database: SPATA31E1 | |
| KEGG: SPATA31E1 | ||
| REACTOME: SPATA31E1 | ||
| Pathway Commons: SPATA31E1 | ||
| Context | iHOP: SPATA31E1 | |
| ligand binding site mutation search in PubMed: SPATA31E1 | ||
| UCL Cancer Institute: SPATA31E1 | ||
| Assigned class in TissGDB* | C | |
| Included tissue-specific gene expression resources | HPA,GTEx | |
| Specific-tissues in normal samples (assigned by TissGDB using HPA, TiGER, and GTEx) | Testis | |
| Cancer types related to the specific-tissues in cancer samples (assigned by TissGDB using TCGA) | TGCT | |
| Reference showing the relevant tissue of SPATA31E1 | ||
| Description by TissGene annotations | ||
| * Class A consists of genes with literature evidence and is part of the cTissGenes. Class B consists of only cTissGenes without additional evidence. The remaining genes belong to Class C. |
| Gene ontology having evidence of Inferred from Direct Assay (IDA) from Entrez |
| GO ID | GO term | PubMed ID |
| Top |
| TissGeneExp for SPATA31E1 |
| Gene expressions across 28 cancer types (X-axis: cancer type and Y-axis: log2(norm_counts+1)) (TCGA IlluminaHiSeq_RNASeqV2, pan-cancer normalized log2(norm_counts+1) data, version 2016-08-16) |
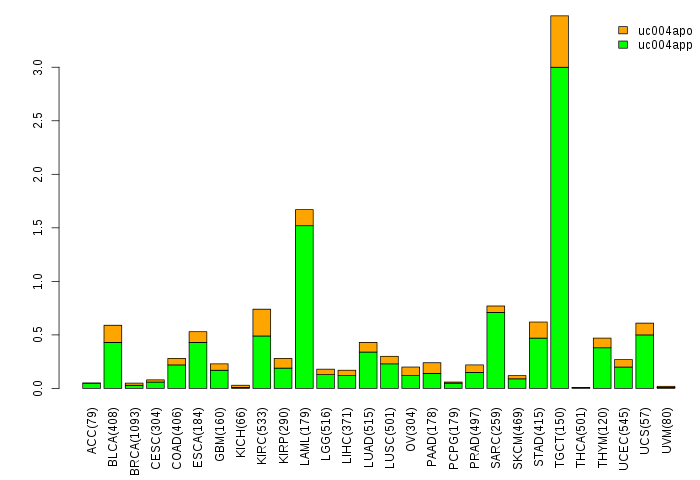
| Gene isoform expressions across 28 cancer types (X-axis: cancer type and Y-axis: log2(norm_counts+1)) (TCGA pan-cancer tcga_rsem_isoform_tpm, version 2016-09-01) |
 |
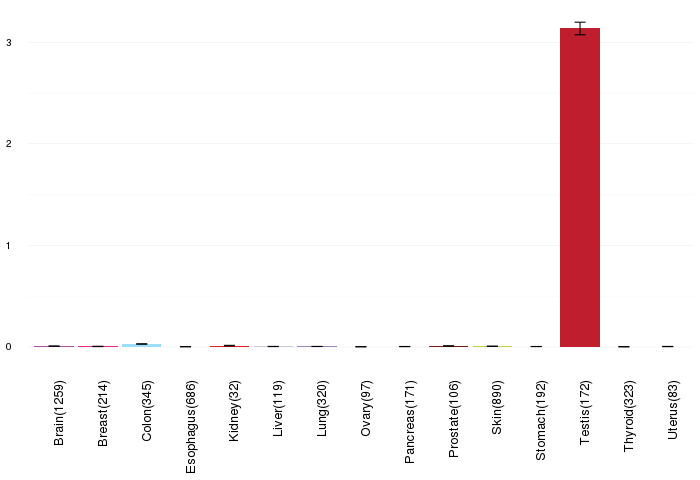
| Gene expressions across normal tissues of GTEx data (GTEx GTEx_Analysis_v6_RNA-seq_RNA-SeQCv1.1.8_gene_rpkm.gct) - Here, we shows the matched tissue types only among our 28 cancer types. |
 |
| Different expressions across 14 cancer types with more than 10 samples between matched tumors and normals (X-axis: cancer type and Y-axis: log2(norm_counts+1)) (TCGA IlluminaHiSeq_RNASeqV2, pan-cancer normalized log2(norm_counts+1) data, version 2016-08-16) |
| - Significantly differentially expressed cancer types and information. (|Fold change|>1 and FDR<0.05) |
| Cancer type | Mean(exp) in tumor | Mean(exp) in matched normal | Log2FC | P-val. | FDR |
| Top |
| TissGene-miRNA for SPATA31E1 |
| Significantly anti-correlated miRNAs of TissGene across 28 cancer types (Gene-miRNA relations from TargetScanHuman Relsease 7.1, Conserved_Site_Context_Scores.txt.zip, 06.01.2016) (TCGA IlluminaHiSeq_miRNASeq, log2(RPM+1) data, version 2016-11-21) (TCGA IlluminaHiSeq_RNASeqV2, log2(normalized_count+1) data, version 2016-08-16) (Spearman’s Rank Correlation (p-value<0.05 and coefficient<-0.25)) |
| Cancer type | miRNA id | miRNA accession | P-val. | Coeff. | # samples |
| Top |
| TissGeneMut for SPATA31E1 |
| TissGeneSNV for SPATA31E1 |
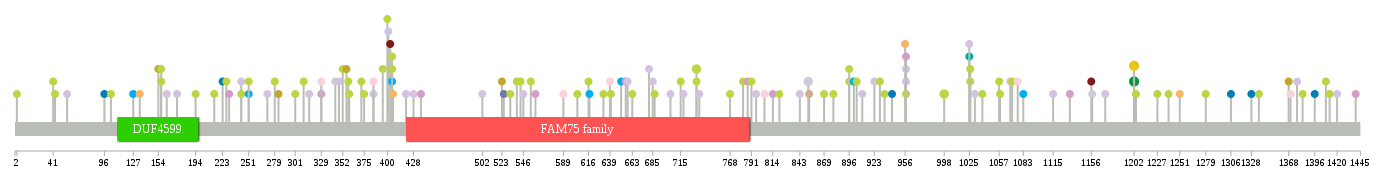
| nsSNV counts per each loci. Different colors of circles represent different cancer types. Circle size denotes number of samples. (TCGA somatic mutation (SNPs and small INDELs) data, version 2016-04-25) * Click on the image to enlarge it in a new window. |
 |
 |
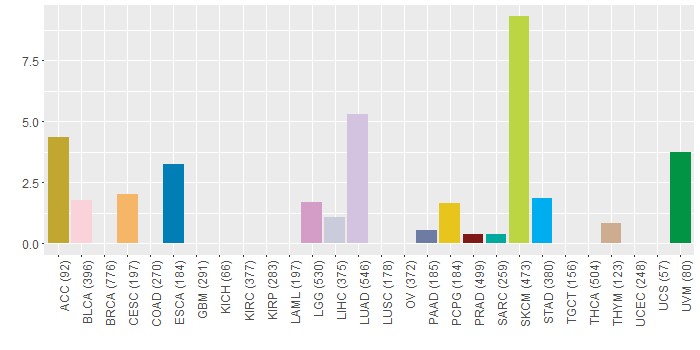
| Somatic nucleotide variants of TissGene across 28 cancer types (X-axis: cancer type and Y-axis: % of mutated samples) The numbers in parentheses are numbers of samples with mutation (nsSNVs). (TCGA somatic mutation (SNPs and small INDELs) data, version 2016-04-25) |
 |
| - nsSNVs sorted by frequency. |
| AAchange | Cancer type | # samples |
| p.D1202G | PCPG | 3 |
| p.D1202G | UVM | 3 |
| p.L852P | LIHC | 2 |
| p.E998K | SKCM | 2 |
| p.E732K | SKCM | 2 |
| p.T401M | LUAD | 1 |
| p.G651R | STAD | 1 |
| p.H174N | LUAD | 1 |
| p.E103K | SKCM | 1 |
| p.W56* | LUAD | 1 |
| p.P405S | SKCM | 1 |
| p.R372K | SKCM | 1 |
| p.E735D | LUAD | 1 |
| p.E150K | HNSC | 1 |
| p.E554K | SKCM | 1 |
| p.G658W | LUAD | 1 |
| p.S640F | SKCM | 1 |
| p.G1058E | SKCM | 1 |
| p.Q589* | BLCA | 1 |
| p.S1157P | LIHC | 1 |
| p.R632K | SKCM | 1 |
| p.S1057L | SKCM | 1 |
| p.G2E | SKCM | 1 |
| p.S699C | HNSC | 1 |
| p.Q639K | BLCA | 1 |
| p.S261F | HNSC | 1 |
| p.R436C | LGG | 1 |
| p.I400F | SKCM | 1 |
| p.R1306M | ESCA | 1 |
| p.G685V | LUAD | 1 |
| p.C843F | LUAD | 1 |
| p.G214R | SKCM | 1 |
| p.A1227T | SKCM | 1 |
| p.A879T | SKCM | 1 |
| p.P251L | SKCM | 1 |
| p.G96R | ESCA | 1 |
| p.P344S | LIHC | 1 |
| p.G617R | STAD | 1 |
| p.R329W | BLCA | 1 |
| p.Q1440H | LGG | 1 |
| p.G1336E | SKCM | 1 |
| p.C1377* | LUAD | 1 |
| p.G896R | SKCM | 1 |
| p.R1133H | LGG | 1 |
| p.T523N | ACC | 1 |
| p.D301N | SKCM | 1 |
| p.Q1251* | CESC | 1 |
| p.S279F | SKCM | 1 |
| p.R329W | LGG | 1 |
| p.P359S | SKCM | 1 |
| p.Q420R | LUAD | 1 |
| p.G957R | SKCM | 1 |
| p.L403P | PRAD | 1 |
| p.E732A | SKCM | 1 |
| p.G957V | LUAD | 1 |
| p.P243H | LUAD | 1 |
| p.Q1025* | LUAD | 1 |
| p.W316C | LUAD | 1 |
| p.L157X | SKCM | 1 |
| p.S965C | HNSC | 1 |
| p.R956S | CESC | 1 |
| p.W1026* | SKCM | 1 |
| p.Q502L | LUAD | 1 |
| p.P532L | SKCM | 1 |
| p.P194L | SKCM | 1 |
| p.S1077L | BLCA | 1 |
| p.H154Q | ACC | 1 |
| p.T942A | ESCA | 1 |
| p.G957W | LUAD | 1 |
| p.G1071E | SKCM | 1 |
| p.H768Y | SKCM | 1 |
| p.Q853H | THYM | 1 |
| p.L1171I | LUAD | 1 |
| p.P923Q | LUAD | 1 |
| p.P256A | HNSC | 1 |
| p.L127P | STAD | 1 |
| p.R1396T | ESCA | 1 |
| p.P227L | SKCM | 1 |
| p.V1328L | ESCA | 1 |
| p.R385Q | LUAD | 1 |
| p.A525D | PAAD | 1 |
| p.S821F | SKCM | 1 |
| p.W1026X | SKCM | 1 |
| p.E43K | SKCM | 1 |
| p.H348N | LUAD | 1 |
| p.G1204S | SKCM | 1 |
| p.G929E | SKCM | 1 |
| p.G1279R | SKCM | 1 |
| p.R1370T | BLCA | 1 |
| p.P251T | STAD | 1 |
| p.M791I | SKCM | 1 |
| p.A1069S | LUAD | 1 |
| p.P934S | SKCM | 1 |
| p.P1383L | SKCM | 1 |
| p.R1419S | HNSC | 1 |
| p.I1239K | SKCM | 1 |
| p.V796L | LUAD | 1 |
| p.P1412S | SKCM | 1 |
| p.G1039E | SKCM | 1 |
| p.N901I | STAD | 1 |
| p.G904R | SKCM | 1 |
| p.V428A | LUAD | 1 |
| p.P230S | LGG | 1 |
| p.P604L | SKCM | 1 |
| p.R1368H | ACC | 1 |
| p.P243S | SKCM | 1 |
| p.R884L | DLBC | 1 |
| p.Q41* | SKCM | 1 |
| p.F406L | CESC | 1 |
| p.G687S | SKCM | 1 |
| p.R718L | LUAD | 1 |
| p.M375I | SKCM | 1 |
| p.S1052R | HNSC | 1 |
| p.Q1025K | SARC | 1 |
| p.D715N | SKCM | 1 |
| p.N283K | ACC | 1 |
| p.P405L | SKCM | 1 |
| p.P869S | SKCM | 1 |
| p.G896E | SKCM | 1 |
| p.L157* | SKCM | 1 |
| p.R663K | SKCM | 1 |
| p.P176Q | HNSC | 1 |
| p.P805R | BLCA | 1 |
| p.P405S | STAD | 1 |
| p.S910N | LUAD | 1 |
| p.E1408K | SKCM | 1 |
| p.R787H | LGG | 1 |
| p.E1002D | HNSC | 1 |
| p.P1271T | HNSC | 1 |
| p.T1152A | HNSC | 1 |
| p.D704G | LUAD | 1 |
| p.P616S | SKCM | 1 |
| p.G395R | SKCM | 1 |
| p.P680H | HNSC | 1 |
| p.P656L | LGG | 1 |
| p.G546R | LUAD | 1 |
| p.R134W | CESC | 1 |
| p.V559A | LGG | 1 |
| p.P1420Q | LUAD | 1 |
| p.P782L | SKCM | 1 |
| p.D1031N | LUAD | 1 |
| p.S681F | LUAD | 1 |
| p.P539L | SKCM | 1 |
| p.G223R | ESCA | 1 |
| p.H358Y | SKCM | 1 |
| p.R310K | SKCM | 1 |
| p.S217L | HNSC | 1 |
| p.V1156M | PRAD | 1 |
| p.G814E | LGG | 1 |
| p.P1043S | HNSC | 1 |
| p.G957E | LGG | 1 |
| p.R543K | SKCM | 1 |
| p.R1115H | LUAD | 1 |
| p.G352S | SKCM | 1 |
| p.T271K | LUAD | 1 |
| p.G163R | LUAD | 1 |
| p.R385Q | BLCA | 1 |
| p.S910G | HNSC | 1 |
| p.V1083A | STAD | 1 |
| p.F356L | ACC | 1 |
| Top |
| TissGeneCNV for SPATA31E1 |
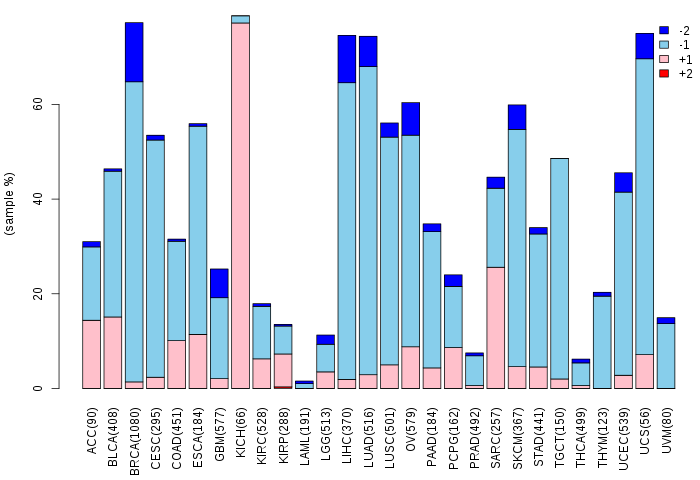
| Copy number variations of TissGene across 28 cancer types (X-axis: cancer type and Y-axis: % of CNV samples) (TCGA Gistic2_CopyNumber_Gistic2_all_data_by_genes, Gistic2 copy number data, version 2016-08-16) |
 |
| Top |
| TissGeneFusions for SPATA31E1 |
| Fusion genes including TissGene (ChimerDB 3.0, 2016-12-01 and TCGA fusion Portal 2015-12-01) |
| Database | Src | Cancer type | Sample | Fusion gene | ORF | 5'-gene BP | 3'-gene BP |
| Top |
| TissGeneNet for SPATA31E1 |
| Co-expressed gene networks based on protein-protein interaction data (CePIN) (TCGA IlluminaHiSeq_RNASeqV2, pan-cancer normalized log2(norm_counts+1) data, version 2016-08-16) (PINA2 ppi data) |
| Top |
| TissGeneProg for SPATA31E1 |
| Kaplan-Meier plots with logrank tests of overall survival (OS) using 28 cancer types (TCGA IlluminaHiSeq_RNASeqV2, pan-cancer normalized log2(norm_counts+1) data, version 2016-08-16) (TCGA clinicalMatrix, phenotype data, version 2016-04-27) * Click on the image to enlarge it in a new window. |
| Kaplan-Meier plots with logrank test of relapse free survival (RFS) using 28 cancer types (TCGA IlluminaHiSeq_RNASeqV2, pan-cancer normalized log2(norm_counts+1) data, version 2016-08-16) (TCGA clinicalMatrix, phenotype data, version 2016-04-27) * Click on the image enlarge it in a new window. |
| Forest plot of Cox proportional hazard ratio (HR) and 95% CI of overall survival (OS) using 28 cancer types (TCGA IlluminaHiSeq_RNASeqV2, pan-cancer normalized log2(norm_counts+1) data, version 2016-08-16) (TCGA clinicalMatrix, phenotype data, version 2016-04-27) * Click on the image enlarge it in a new window. |
| Forest plot of Cox proportional hazard ratio (HR) and 95% CI of relapse free survival (RFS) using 28 cancer types (TCGA IlluminaHiSeq_RNASeqV2, pan-cancer normalized log2(norm_counts+1) data, version 2016-08-16) (TCGA clinicalMatrix, phenotype data, version 2016-04-27) * Click on the image enlarge it in a new window. |
| Top |
| TissGeneClin for SPATA31E1 |
| TissGeneDrug for SPATA31E1 |
| Drug information targeting TissGene (DrugBank Version 5.0.6, 2017-04-01) |
| DrugBank ID | Drug name | Drug activity | Drug type | Drug status |
| Top |
| TissGeneDisease for SPATA31E1 |
| Disease information associated with TissGene (DisGeNet, 2016-06-01) |
| Disease ID | Disease name | # pubmeds | Source |
|
Copyright 2016-Present - The University of Texas Health Science Center at Houston (UTHealth) Web File Viewing | How to Report, Fraud, Waste and Abuse | State of Texas | Statewide Search | Texas Homeland Security | Site Policies |