 |
| |
| |
| |
| |
| |
| |
|

| TissGeneSummary for TUSC5 |
 Gene summary Gene summary |
| Basic gene information | Gene symbol | TUSC5 |
| Gene name | tumor suppressor candidate 5 | |
| Synonyms | DSPB1|IFITMD3|LOST1 | |
| Cytomap | UCSC genome browser: 17p13.3 | |
| Type of gene | protein-coding | |
| RefGenes | NM_172367.2, | |
| Description | dispanin subfamily B member 1interferon induced transmembrane protein domain containing 3interferon-induced transmembrane domain-containing protein D3located at seventeen p thirteen point three 1protein located at seventeen-p-thirteen point three 1 | |
| Modification date | 20141207 | |
| dbXrefs | MIM : 612211 | |
| HGNC : HGNC | ||
| Ensembl : ENSG00000184811 | ||
| HPRD : 18248 | ||
| Vega : OTTHUMG00000132196 | ||
| Protein | UniProt: go to UniProt's Cross Reference DB Table | |
| Expression | CleanEX: HS_TUSC5 | |
| BioGPS: 286753 | ||
| Pathway | NCI Pathway Interaction Database: TUSC5 | |
| KEGG: TUSC5 | ||
| REACTOME: TUSC5 | ||
| Pathway Commons: TUSC5 | ||
| Context | iHOP: TUSC5 | |
| ligand binding site mutation search in PubMed: TUSC5 | ||
| UCL Cancer Institute: TUSC5 | ||
| Assigned class in TissGDB* | C | |
| Included tissue-specific gene expression resources | TiGER,GTEx | |
| Specific-tissues in normal samples (assigned by TissGDB using HPA, TiGER, and GTEx) | BreastSoft tissue | |
| Cancer types related to the specific-tissues in cancer samples (assigned by TissGDB using TCGA) | BRCASARC | |
| Reference showing the relevant tissue of TUSC5 | ||
| Description by TissGene annotations | Cancer gene Significant down-regulated DEG TissgsKTS CNV lost TissGeneKTS | |
| * Class A consists of genes with literature evidence and is part of the cTissGenes. Class B consists of only cTissGenes without additional evidence. The remaining genes belong to Class C. |
| Gene ontology having evidence of Inferred from Direct Assay (IDA) from Entrez |
| GO ID | GO term | PubMed ID |
| Top |
| TissGeneExp for TUSC5 |
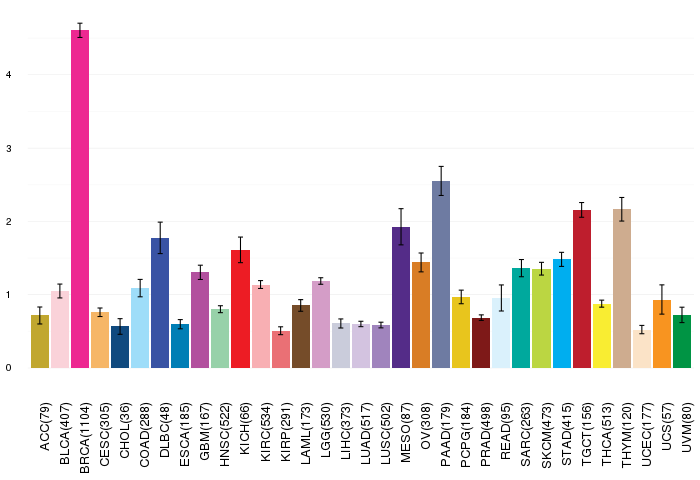
| Gene expressions across 28 cancer types (X-axis: cancer type and Y-axis: log2(norm_counts+1)) (TCGA IlluminaHiSeq_RNASeqV2, pan-cancer normalized log2(norm_counts+1) data, version 2016-08-16) |
 |
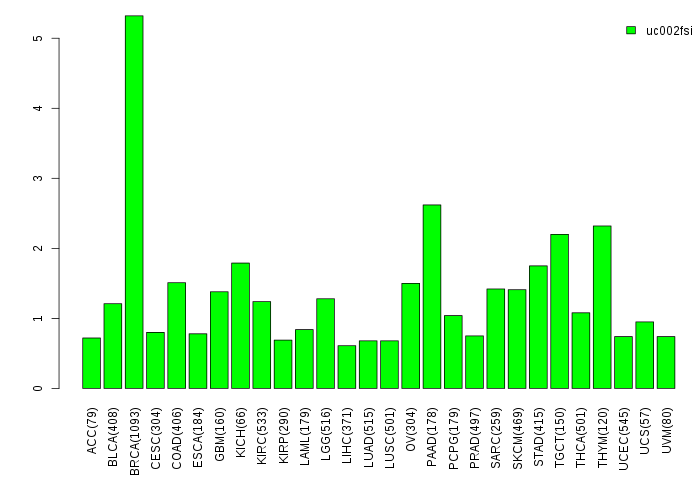
| Gene isoform expressions across 28 cancer types (X-axis: cancer type and Y-axis: log2(norm_counts+1)) (TCGA pan-cancer tcga_rsem_isoform_tpm, version 2016-09-01) |
 |
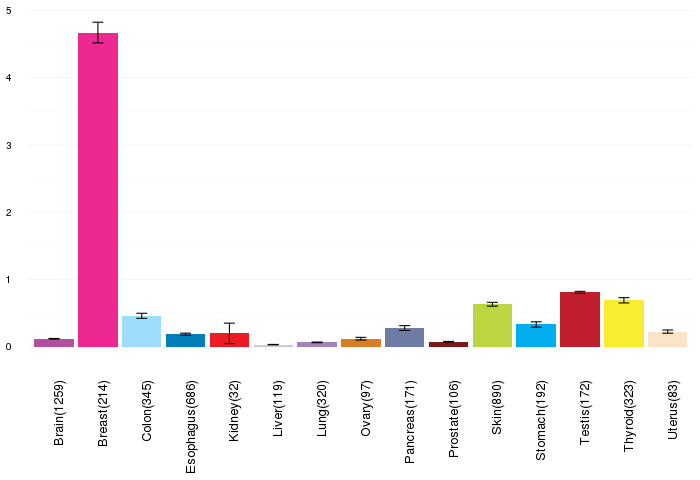
| Gene expressions across normal tissues of GTEx data (GTEx GTEx_Analysis_v6_RNA-seq_RNA-SeQCv1.1.8_gene_rpkm.gct) - Here, we shows the matched tissue types only among our 28 cancer types. |
 |
| Different expressions across 14 cancer types with more than 10 samples between matched tumors and normals (X-axis: cancer type and Y-axis: log2(norm_counts+1)) (TCGA IlluminaHiSeq_RNASeqV2, pan-cancer normalized log2(norm_counts+1) data, version 2016-08-16) |
 |
| - Significantly differentially expressed cancer types and information. (|Fold change|>1 and FDR<0.05) |
| Cancer type | Mean(exp) in tumor | Mean(exp) in matched normal | Log2FC | P-val. | FDR |
| BRCA | 2.920416051 | 9.104943244 | -6.184527193 | 3.58E-38 | 9.17E-37 |
| HNSC | -0.871085173 | 2.482714827 | -3.3538 | 2.46E-11 | 5.77E-10 |
| THCA | -1.203728374 | 0.354651287 | -1.558379661 | 7.53E-11 | 5.16E-10 |
| ESCA | -1.567094475 | 0.695405525 | -2.2625 | 0.00253 | 0.025794338 |
| BLCA | -0.989447107 | 1.813589735 | -2.803036842 | 0.0013 | 0.008923457 |
| KIRP | -1.36376635 | 0.1359649 | -1.49973125 | 0.00318 | 0.007826081 |
| STAD | -0.098169475 | 2.18379615 | -2.281965625 | 0.00101 | 0.005357288 |
| COAD | -0.350094475 | 2.599551679 | -2.949646154 | 5.36E-05 | 0.000209336 |
| Top |
| TissGene-miRNA for TUSC5 |
| Significantly anti-correlated miRNAs of TissGene across 28 cancer types (Gene-miRNA relations from TargetScanHuman Relsease 7.1, Conserved_Site_Context_Scores.txt.zip, 06.01.2016) (TCGA IlluminaHiSeq_miRNASeq, log2(RPM+1) data, version 2016-11-21) (TCGA IlluminaHiSeq_RNASeqV2, log2(normalized_count+1) data, version 2016-08-16) (Spearman’s Rank Correlation (p-value<0.05 and coefficient<-0.25)) |
| Cancer type | miRNA id | miRNA accession | P-val. | Coeff. | # samples |
| Top |
| TissGeneMut for TUSC5 |
| TissGeneSNV for TUSC5 |
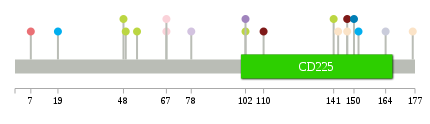
| nsSNV counts per each loci. Different colors of circles represent different cancer types. Circle size denotes number of samples. (TCGA somatic mutation (SNPs and small INDELs) data, version 2016-04-25) * Click on the image to enlarge it in a new window. |
 |
 |
| Somatic nucleotide variants of TissGene across 28 cancer types (X-axis: cancer type and Y-axis: % of mutated samples) The numbers in parentheses are numbers of samples with mutation (nsSNVs). (TCGA somatic mutation (SNPs and small INDELs) data, version 2016-04-25) |
 |
| - nsSNVs sorted by frequency. |
| AAchange | Cancer type | # samples |
| p.R143W | UCEC | 1 |
| p.V110I | PRAD | 1 |
| p.R147H | UCEC | 1 |
| p.R102T | LUSC | 1 |
| p.A19T | STAD | 1 |
| p.R102K | SKCM | 1 |
| p.R147H | HNSC | 1 |
| p.K176N | UCEC | 1 |
| p.E54K | SKCM | 1 |
| p.S48L | SKCM | 1 |
| p.G49R | SKCM | 1 |
| p.R150Q | ESCA | 1 |
| p.I164T | LIHC | 1 |
| p.S7Y | KIRP | 1 |
| p.P78A | LUAD | 1 |
| p.L152I | STAD | 1 |
| p.S44P | HNSC | 1 |
| p.E67K | BLCA | 1 |
| p.R147L | PRAD | 1 |
| p.G141D | SKCM | 1 |
| p.E67K | HNSC | 1 |
| p.E67Q | BLCA | 1 |
| Top |
| TissGeneCNV for TUSC5 |
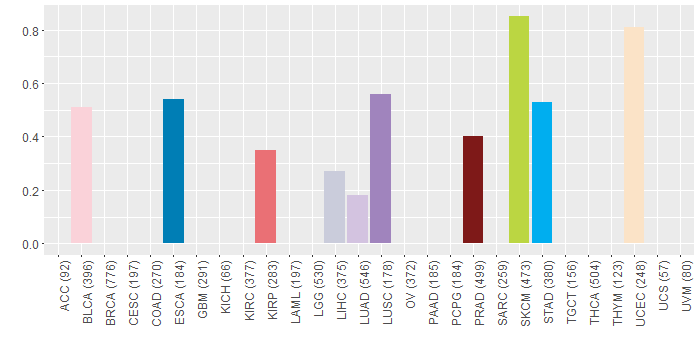
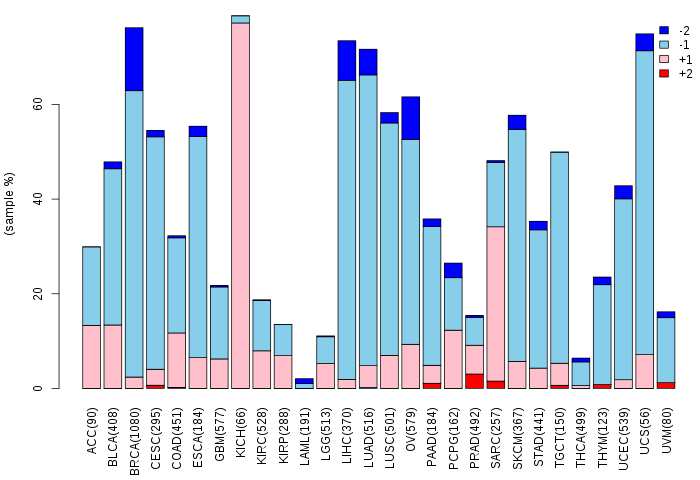
| Copy number variations of TissGene across 28 cancer types (X-axis: cancer type and Y-axis: % of CNV samples) (TCGA Gistic2_CopyNumber_Gistic2_all_data_by_genes, Gistic2 copy number data, version 2016-08-16) |
 |
| Top |
| TissGeneFusions for TUSC5 |
| Fusion genes including TissGene (ChimerDB 3.0, 2016-12-01 and TCGA fusion Portal 2015-12-01) |
| Database | Src | Cancer type | Sample | Fusion gene | ORF | 5'-gene BP | 3'-gene BP |
| TCGAfusionPortal | PRADA | BRCA | TCGA-AN-A0AM-01A | CAND1-TUSC5 | Out-of-frame | Chr12:67675833 | Chr17:1198785 |
| Top |
| TissGeneNet for TUSC5 |
| Co-expressed gene networks based on protein-protein interaction data (CePIN) (TCGA IlluminaHiSeq_RNASeqV2, pan-cancer normalized log2(norm_counts+1) data, version 2016-08-16) (PINA2 ppi data) |
| Top |
| TissGeneProg for TUSC5 |
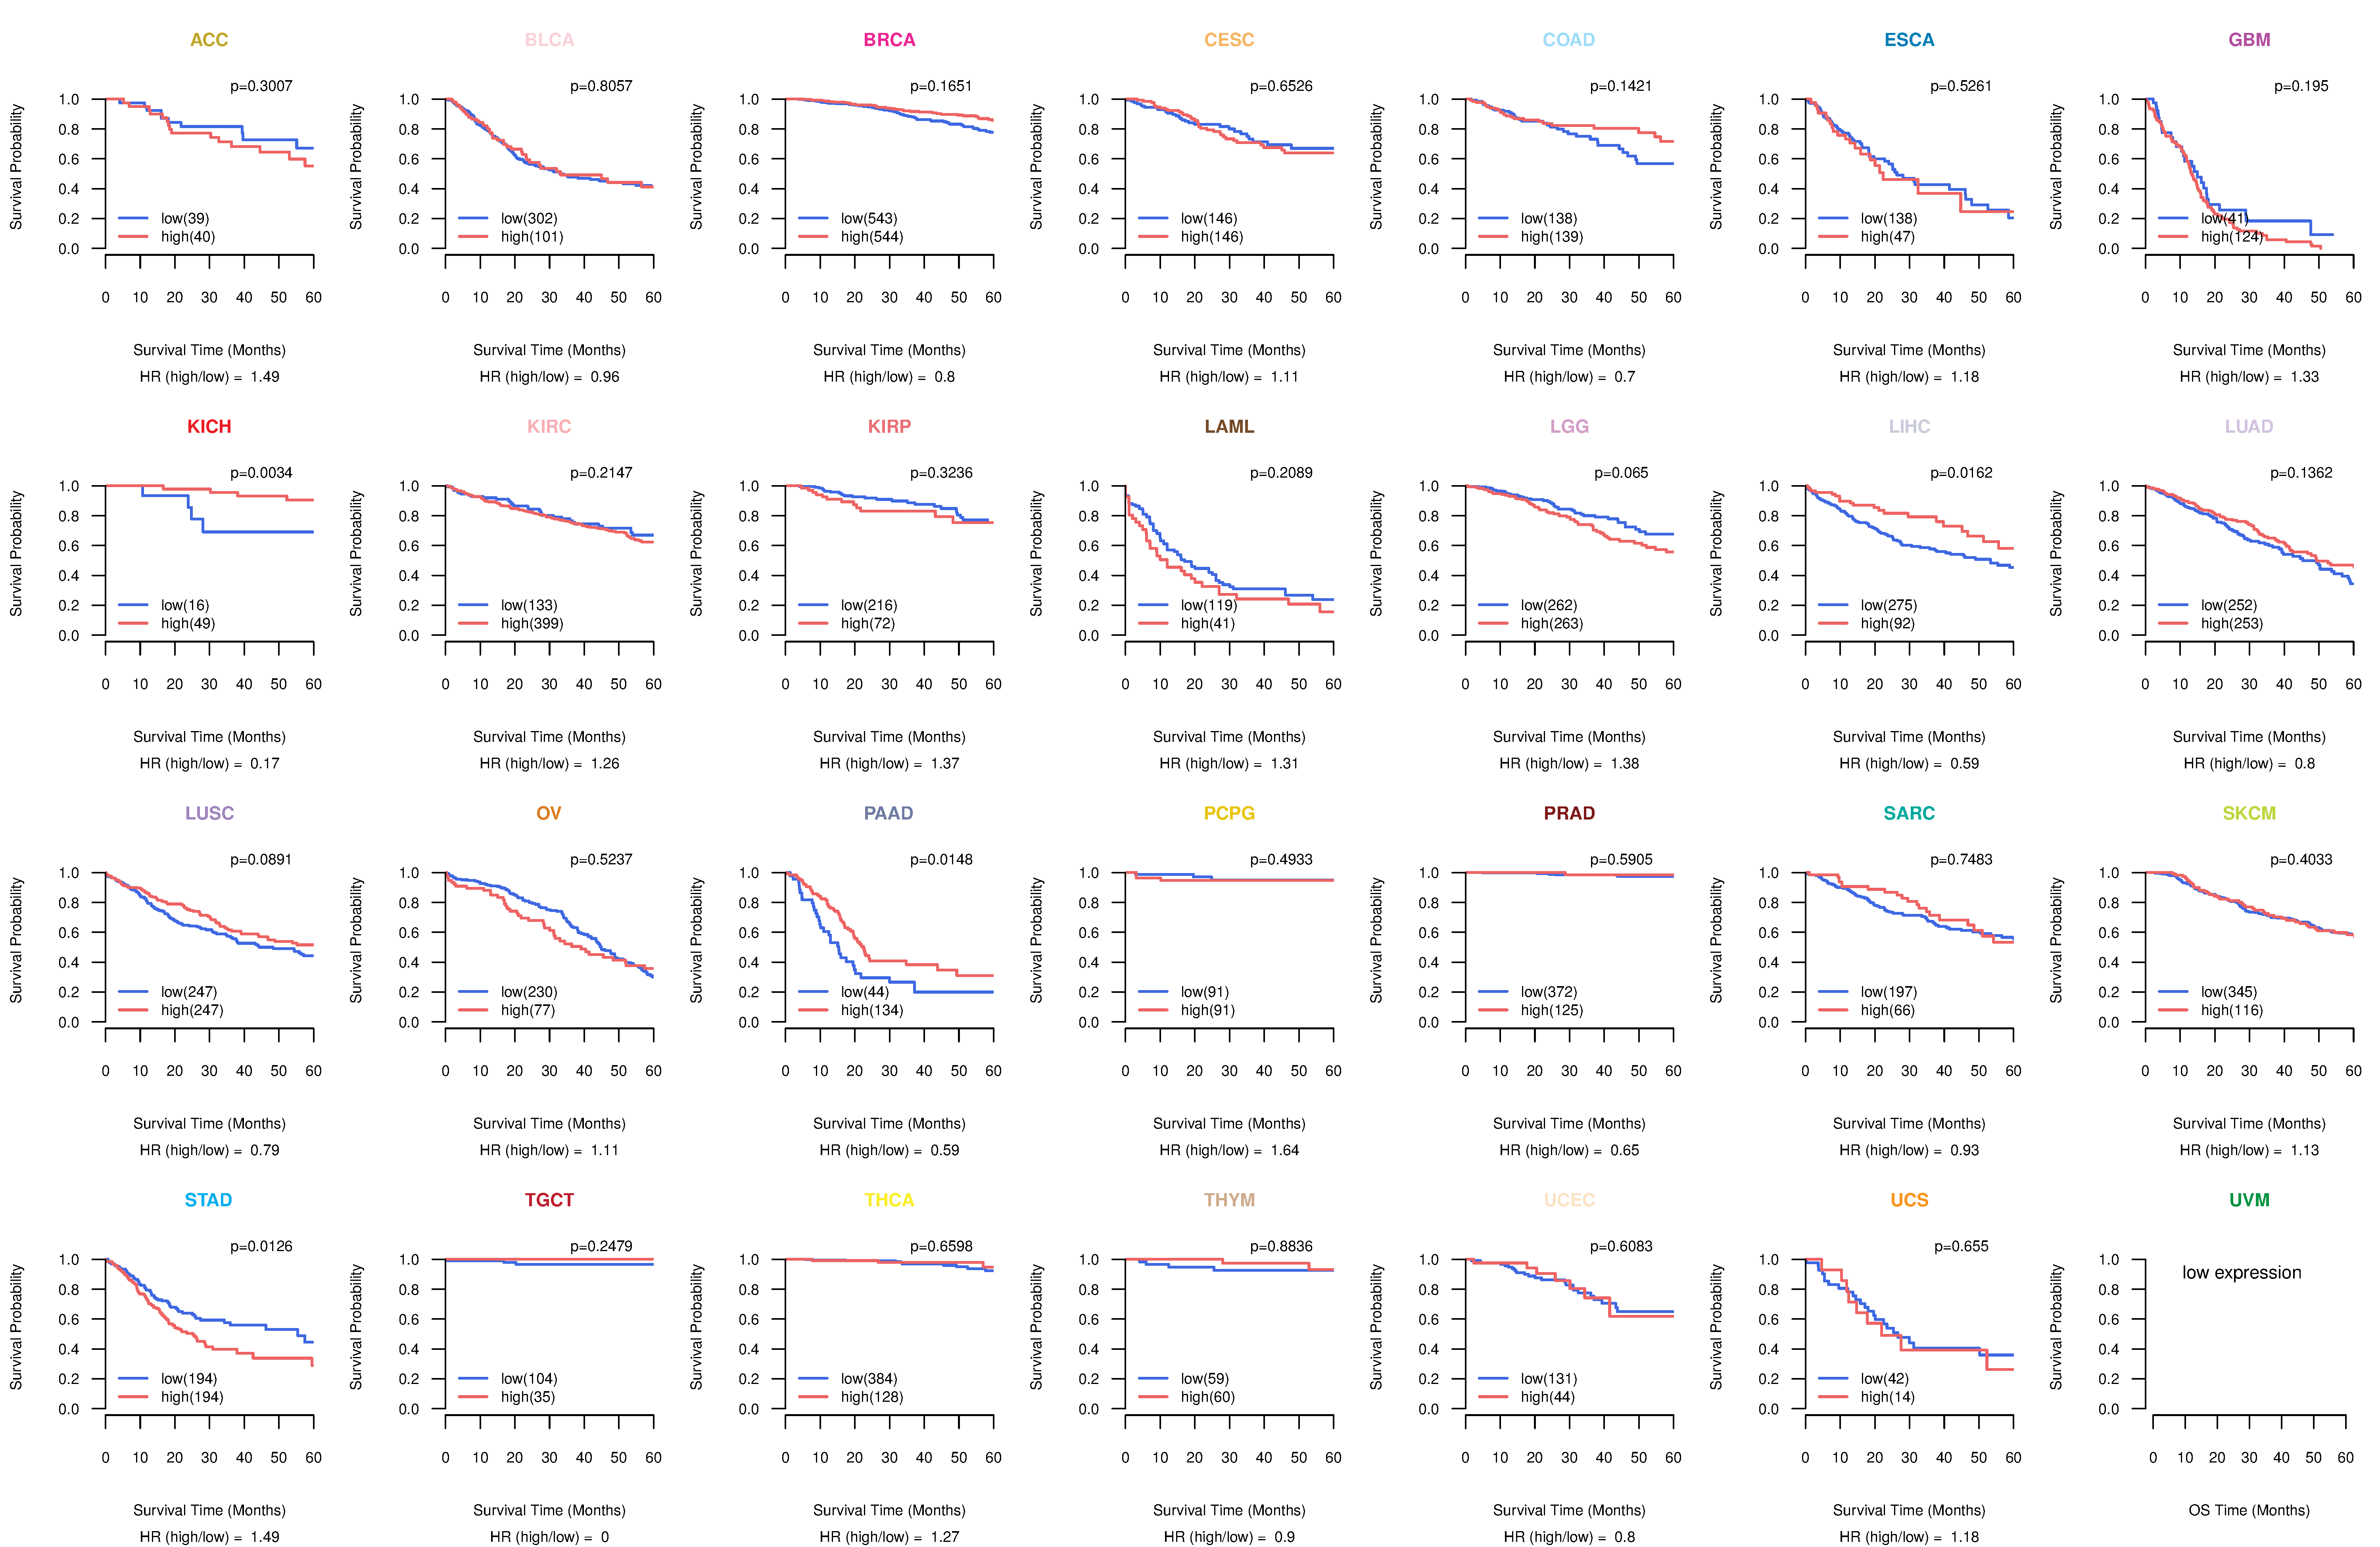
| Kaplan-Meier plots with logrank tests of overall survival (OS) using 28 cancer types (TCGA IlluminaHiSeq_RNASeqV2, pan-cancer normalized log2(norm_counts+1) data, version 2016-08-16) (TCGA clinicalMatrix, phenotype data, version 2016-04-27) * Click on the image to enlarge it in a new window. |
 |
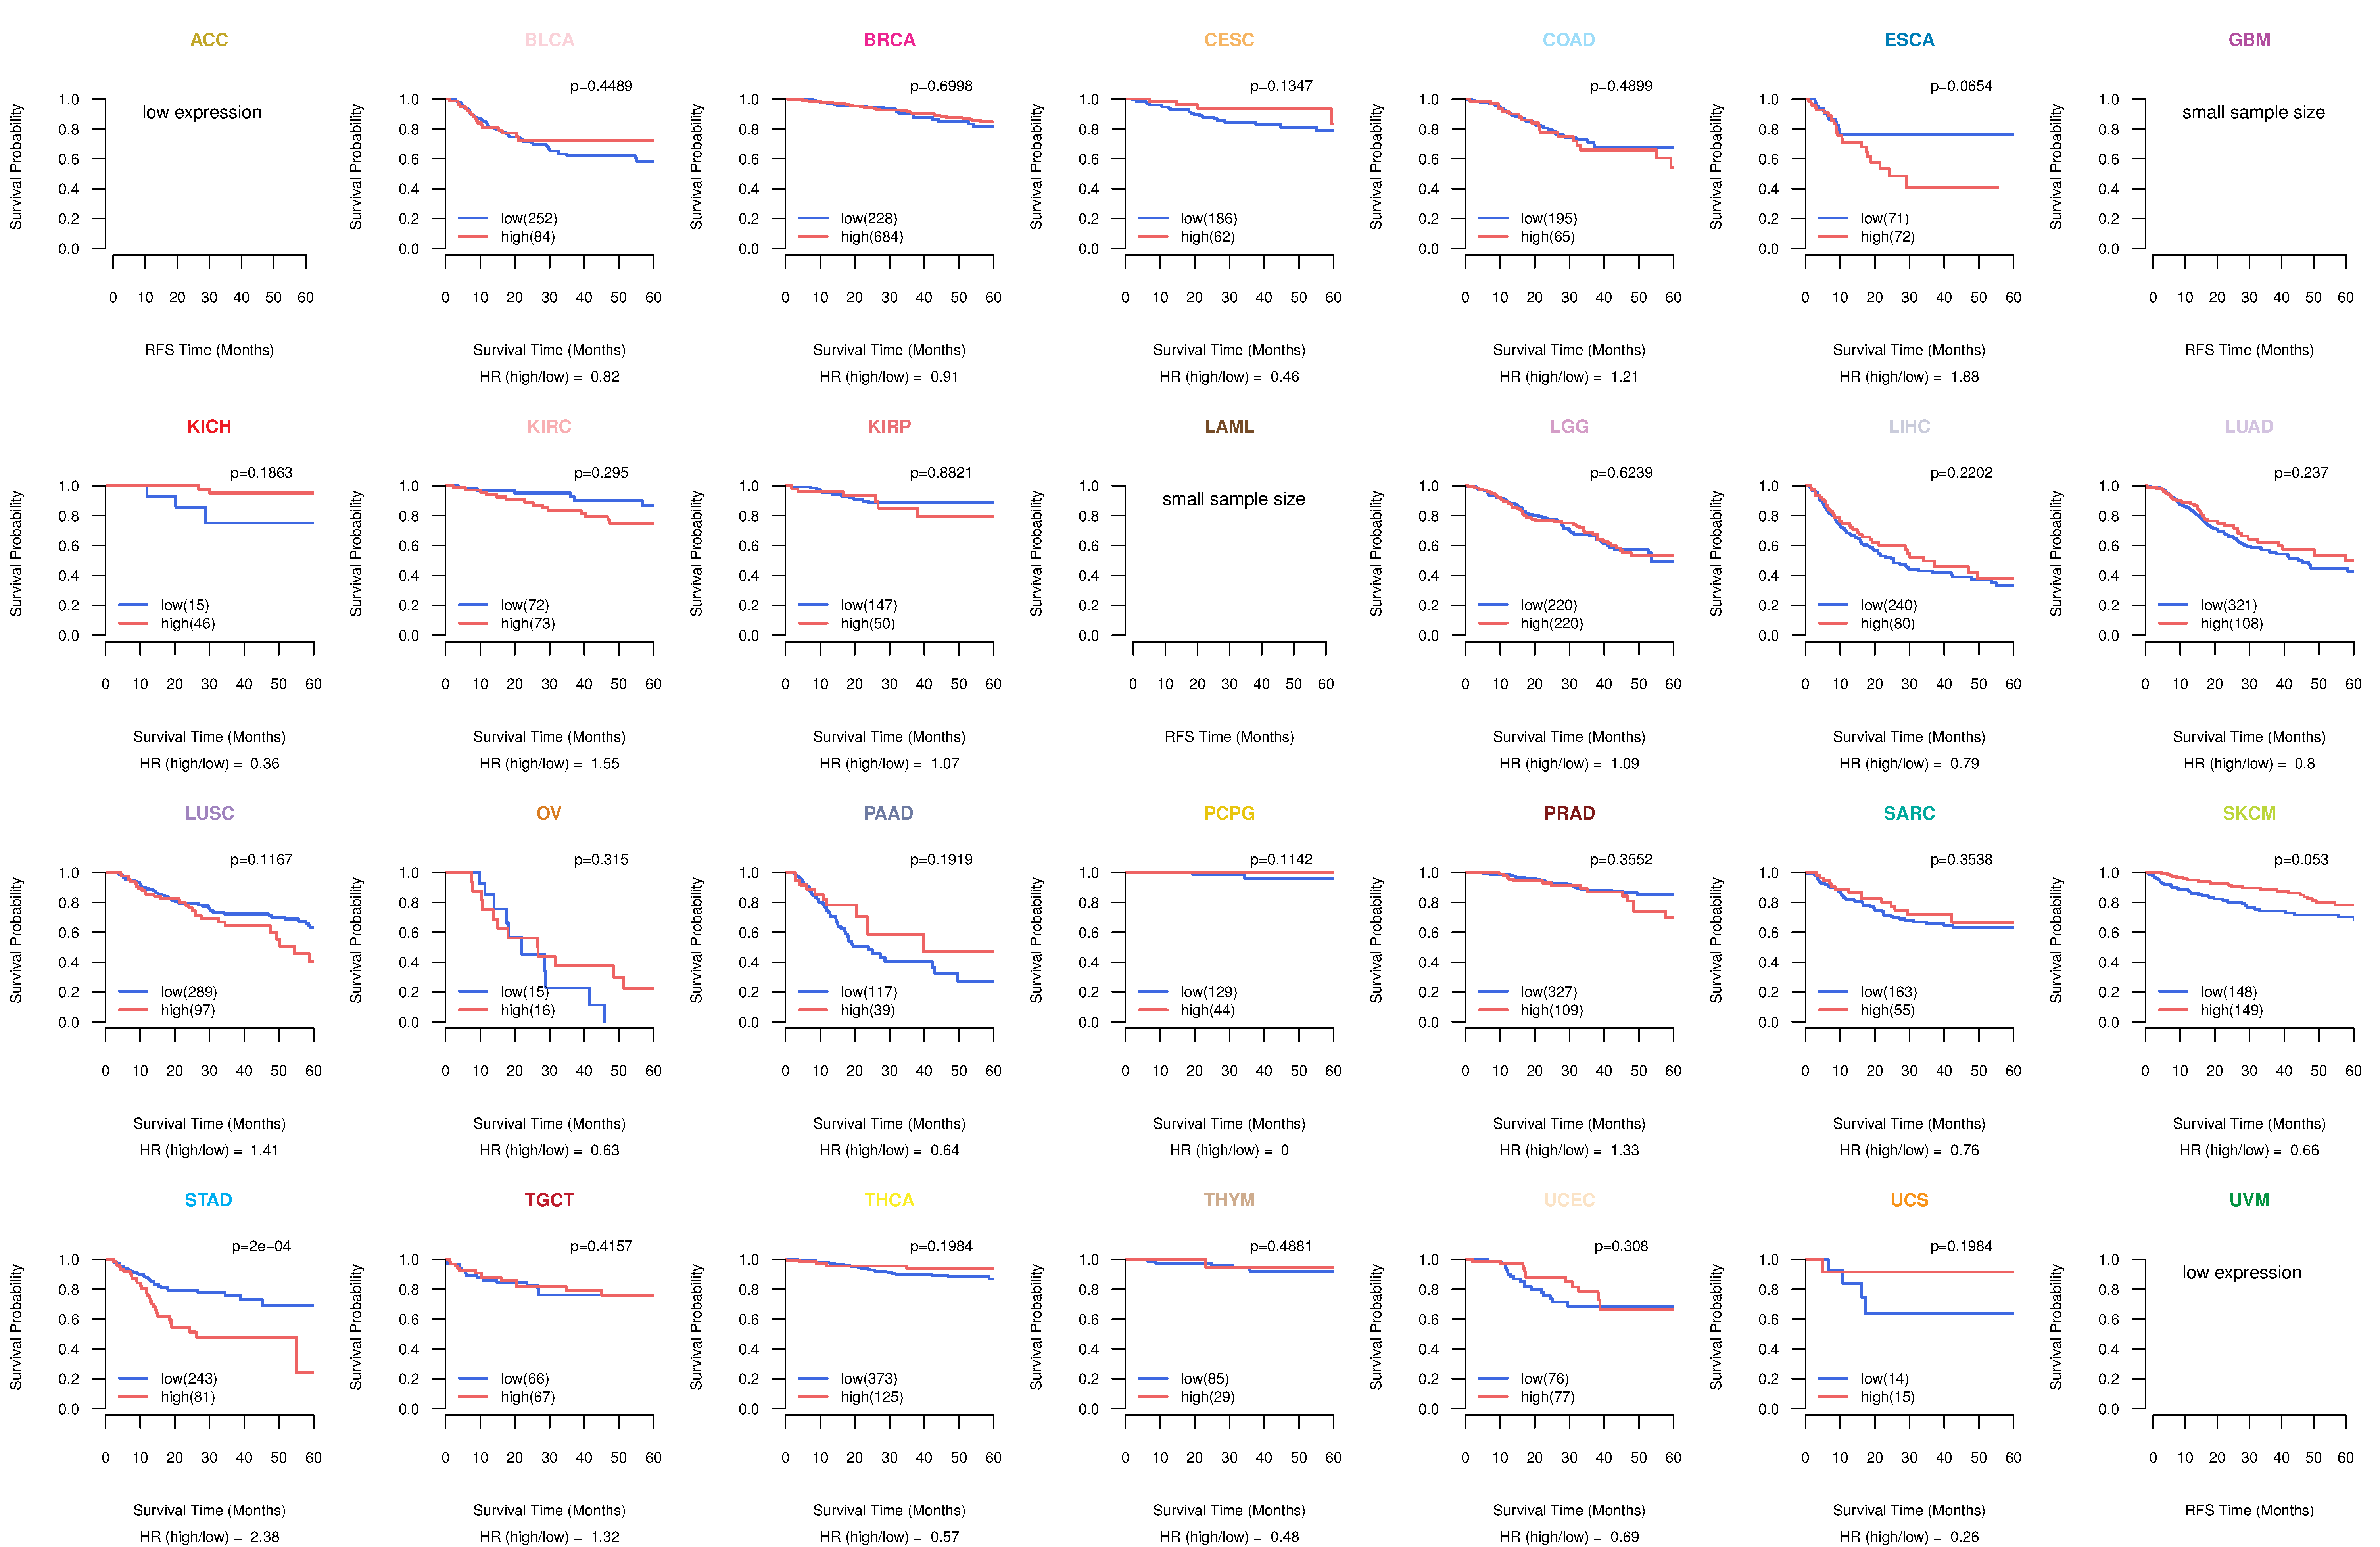
| Kaplan-Meier plots with logrank test of relapse free survival (RFS) using 28 cancer types (TCGA IlluminaHiSeq_RNASeqV2, pan-cancer normalized log2(norm_counts+1) data, version 2016-08-16) (TCGA clinicalMatrix, phenotype data, version 2016-04-27) * Click on the image enlarge it in a new window. |
 |
| Forest plot of Cox proportional hazard ratio (HR) and 95% CI of overall survival (OS) using 28 cancer types (TCGA IlluminaHiSeq_RNASeqV2, pan-cancer normalized log2(norm_counts+1) data, version 2016-08-16) (TCGA clinicalMatrix, phenotype data, version 2016-04-27) * Click on the image enlarge it in a new window. |
 |
| Forest plot of Cox proportional hazard ratio (HR) and 95% CI of relapse free survival (RFS) using 28 cancer types (TCGA IlluminaHiSeq_RNASeqV2, pan-cancer normalized log2(norm_counts+1) data, version 2016-08-16) (TCGA clinicalMatrix, phenotype data, version 2016-04-27) * Click on the image enlarge it in a new window. |
 |
| Top |
| TissGeneClin for TUSC5 |
| TissGeneDrug for TUSC5 |
| Drug information targeting TissGene (DrugBank Version 5.0.6, 2017-04-01) |
| DrugBank ID | Drug name | Drug activity | Drug type | Drug status |
| Top |
| TissGeneDisease for TUSC5 |
| Disease information associated with TissGene (DisGeNet, 2016-06-01) |
| Disease ID | Disease name | # pubmeds | Source |
| umls:C0011847 | Diabetes | 1 | BeFree |
| umls:C0011849 | Diabetes Mellitus | 1 | BeFree |
| umls:C0266617 | Congenital anomaly of face | 1 | BeFree |
|
Copyright 2016-Present - The University of Texas Health Science Center at Houston (UTHealth) Web File Viewing | How to Report, Fraud, Waste and Abuse | State of Texas | Statewide Search | Texas Homeland Security | Site Policies |