 |
| |
| |
| |
| |
| |
| |
|

| TissGeneSummary for SLC6A16 |
 Gene summary Gene summary |
| Basic gene information | Gene symbol | SLC6A16 |
| Gene name | solute carrier family 6, member 16 | |
| Synonyms | NT5|NTT5 | |
| Cytomap | UCSC genome browser: 19q13.33 | |
| Type of gene | protein-coding | |
| RefGenes | NM_014037.2, | |
| Description | orphan sodium- and chloride-dependent neurotransmitter transporter NTT5solute carrier family 6 (neurotransmitter transporter), member 16 | |
| Modification date | 20141207 | |
| dbXrefs | MIM : 607972 | |
| HGNC : HGNC | ||
| Ensembl : ENSG00000063127 | ||
| Vega : OTTHUMG00000183179 | ||
| Protein | UniProt: go to UniProt's Cross Reference DB Table | |
| Expression | CleanEX: HS_SLC6A16 | |
| BioGPS: 28968 | ||
| Pathway | NCI Pathway Interaction Database: SLC6A16 | |
| KEGG: SLC6A16 | ||
| REACTOME: SLC6A16 | ||
| Pathway Commons: SLC6A16 | ||
| Context | iHOP: SLC6A16 | |
| ligand binding site mutation search in PubMed: SLC6A16 | ||
| UCL Cancer Institute: SLC6A16 | ||
| Assigned class in TissGDB* | B | |
| Included tissue-specific gene expression resources | HPA,TiGER,GTEx | |
| Specific-tissues in normal samples (assigned by TissGDB using HPA, TiGER, and GTEx) | Testis | |
| Cancer types related to the specific-tissues in cancer samples (assigned by TissGDB using TCGA) | TGCT | |
| Reference showing the relevant tissue of SLC6A16 | ||
| Description by TissGene annotations | ||
| * Class A consists of genes with literature evidence and is part of the cTissGenes. Class B consists of only cTissGenes without additional evidence. The remaining genes belong to Class C. |
| Gene ontology having evidence of Inferred from Direct Assay (IDA) from Entrez |
| GO ID | GO term | PubMed ID |
| Top |
| TissGeneExp for SLC6A16 |
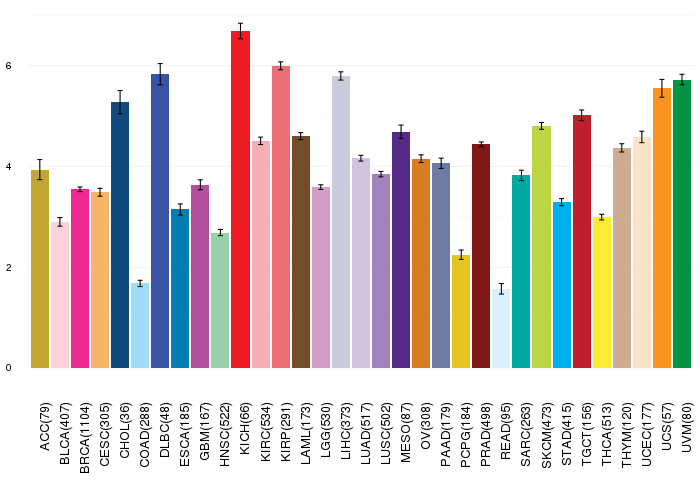
| Gene expressions across 28 cancer types (X-axis: cancer type and Y-axis: log2(norm_counts+1)) (TCGA IlluminaHiSeq_RNASeqV2, pan-cancer normalized log2(norm_counts+1) data, version 2016-08-16) |
 |
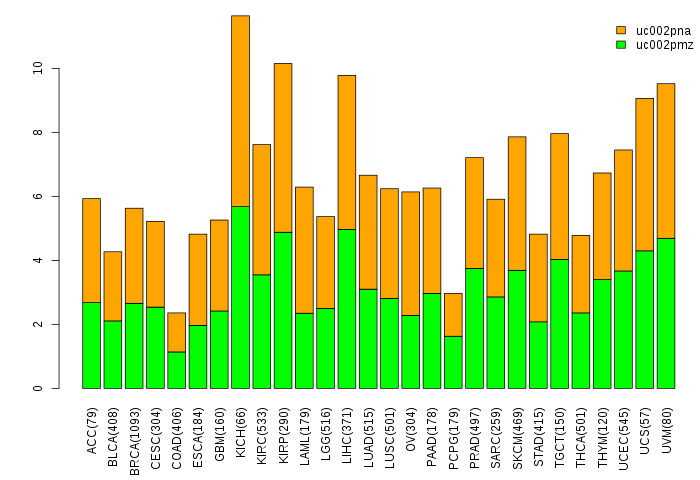
| Gene isoform expressions across 28 cancer types (X-axis: cancer type and Y-axis: log2(norm_counts+1)) (TCGA pan-cancer tcga_rsem_isoform_tpm, version 2016-09-01) |
 |
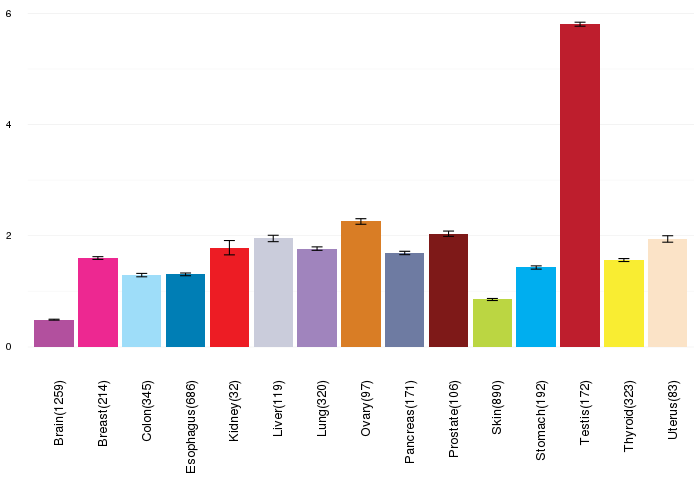
| Gene expressions across normal tissues of GTEx data (GTEx GTEx_Analysis_v6_RNA-seq_RNA-SeQCv1.1.8_gene_rpkm.gct) - Here, we shows the matched tissue types only among our 28 cancer types. |
 |
| Different expressions across 14 cancer types with more than 10 samples between matched tumors and normals (X-axis: cancer type and Y-axis: log2(norm_counts+1)) (TCGA IlluminaHiSeq_RNASeqV2, pan-cancer normalized log2(norm_counts+1) data, version 2016-08-16) |
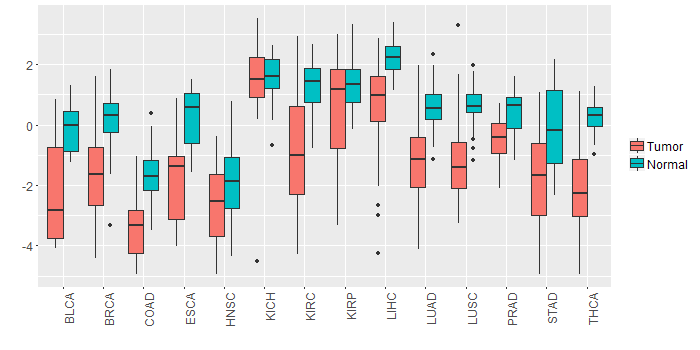 |
| - Significantly differentially expressed cancer types and information. (|Fold change|>1 and FDR<0.05) |
| Cancer type | Mean(exp) in tumor | Mean(exp) in matched normal | Log2FC | P-val. | FDR |
| THCA | -2.083141683 | 0.267288825 | -2.350430508 | 1.79E-20 | 7.77E-19 |
| LIHC | 0.710411774 | 2.241965774 | -1.531554 | 7.72E-09 | 6.89E-08 |
| KIRC | -0.854919226 | 1.26666133 | -2.121580556 | 5.44E-15 | 2.73E-14 |
| LUSC | -1.180878539 | 0.649523422 | -1.830401961 | 5.54E-13 | 2.64E-12 |
| COAD | -3.484332687 | -1.606148072 | -1.878184615 | 2.54E-09 | 2.58E-08 |
| LUAD | -1.184726984 | 0.589373016 | -1.7741 | 1.14E-15 | 1.24E-14 |
| BRCA | -1.690920541 | 0.203775073 | -1.894695614 | 8.34E-29 | 1.03E-27 |
| ESCA | -1.736276044 | 0.179814865 | -1.916090909 | 0.00308 | 0.029525517 |
| BLCA | -2.173904752 | -0.107946857 | -2.065957895 | 6.28E-05 | 0.000771642 |
| STAD | -1.761128601 | -0.136962976 | -1.624165625 | 2.94E-05 | 0.000276655 |
| Top |
| TissGene-miRNA for SLC6A16 |
| Significantly anti-correlated miRNAs of TissGene across 28 cancer types (Gene-miRNA relations from TargetScanHuman Relsease 7.1, Conserved_Site_Context_Scores.txt.zip, 06.01.2016) (TCGA IlluminaHiSeq_miRNASeq, log2(RPM+1) data, version 2016-11-21) (TCGA IlluminaHiSeq_RNASeqV2, log2(normalized_count+1) data, version 2016-08-16) (Spearman’s Rank Correlation (p-value<0.05 and coefficient<-0.25)) |
| Cancer type | miRNA id | miRNA accession | P-val. | Coeff. | # samples |
| Top |
| TissGeneMut for SLC6A16 |
| TissGeneSNV for SLC6A16 |
| nsSNV counts per each loci. Different colors of circles represent different cancer types. Circle size denotes number of samples. (TCGA somatic mutation (SNPs and small INDELs) data, version 2016-04-25) * Click on the image to enlarge it in a new window. |
 |
 |
| Somatic nucleotide variants of TissGene across 28 cancer types (X-axis: cancer type and Y-axis: % of mutated samples) The numbers in parentheses are numbers of samples with mutation (nsSNVs). (TCGA somatic mutation (SNPs and small INDELs) data, version 2016-04-25) |
 |
| - nsSNVs sorted by frequency. |
| AAchange | Cancer type | # samples |
| p.S356F | SKCM | 1 |
| p.A428V | READ | 1 |
| p.P657S | SKCM | 1 |
| p.P687T | KIRP | 1 |
| p.E222D | BLCA | 1 |
| p.L126I | READ | 1 |
| p.V387A | UCEC | 1 |
| p.F553Y | SKCM | 1 |
| p.A400V | ACC | 1 |
| p.E655* | LGG | 1 |
| p.Y436* | LUSC | 1 |
| p.G138S | READ | 1 |
| p.S362F | SKCM | 1 |
| p.P654T | ESCA | 1 |
| p.G171V | STAD | 1 |
| p.E316K | HNSC | 1 |
| p.E4Q | LUAD | 1 |
| p.G422V | LUAD | 1 |
| p.M191V | UCEC | 1 |
| p.G262E | STAD | 1 |
| p.E96Q | BLCA | 1 |
| p.W643* | LGG | 1 |
| p.I304S | LUAD | 1 |
| p.P365T | PAAD | 1 |
| p.S243Y | ESCA | 1 |
| p.C277G | SARC | 1 |
| p.S41Y | STAD | 1 |
| p.F528L | UCEC | 1 |
| p.T599M | STAD | 1 |
| p.L721I | UCEC | 1 |
| p.W614C | LUSC | 1 |
| p.A596T | LIHC | 1 |
| p.P493S | SKCM | 1 |
| p.M228L | HNSC | 1 |
| p.R55W | LUAD | 1 |
| p.V298L | LUSC | 1 |
| p.R128H | SKCM | 1 |
| p.G197C | LUAD | 1 |
| p.P687S | BLCA | 1 |
| p.T31M | PRAD | 1 |
| p.P431L | STAD | 1 |
| p.S736F | SKCM | 1 |
| p.S230P | LIHC | 1 |
| p.L347M | GBM | 1 |
| p.V579I | LUAD | 1 |
| p.S124Y | COAD | 1 |
| p.P104L | BRCA | 1 |
| p.L156V | BLCA | 1 |
| p.L666P | STAD | 1 |
| p.E409D | STAD | 1 |
| p.V327A | COAD | 1 |
| p.G693R | COAD | 1 |
| p.L491R | SKCM | 1 |
| p.R103S | LUAD | 1 |
| p.E413D | UCEC | 1 |
| p.Q345K | PRAD | 1 |
| p.E718K | SKCM | 1 |
| p.L458F | SKCM | 1 |
| p.C125F | HNSC | 1 |
| p.P711S | PRAD | 1 |
| p.A318V | OV | 1 |
| p.L538F | UCEC | 1 |
| Top |
| TissGeneCNV for SLC6A16 |
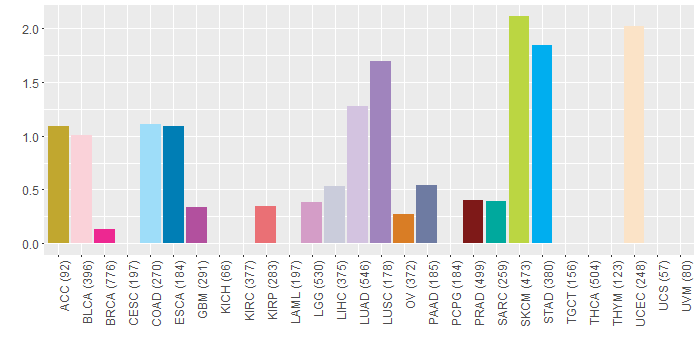
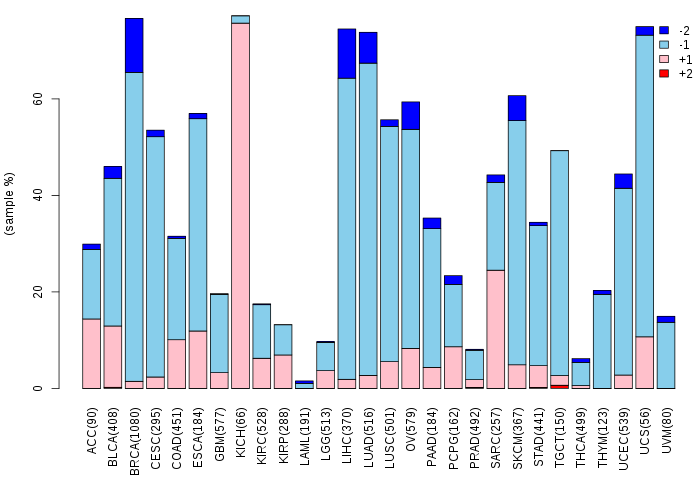
| Copy number variations of TissGene across 28 cancer types (X-axis: cancer type and Y-axis: % of CNV samples) (TCGA Gistic2_CopyNumber_Gistic2_all_data_by_genes, Gistic2 copy number data, version 2016-08-16) |
 |
| Top |
| TissGeneFusions for SLC6A16 |
| Fusion genes including TissGene (ChimerDB 3.0, 2016-12-01 and TCGA fusion Portal 2015-12-01) |
| Database | Src | Cancer type | Sample | Fusion gene | ORF | 5'-gene BP | 3'-gene BP |
| Top |
| TissGeneNet for SLC6A16 |
| Co-expressed gene networks based on protein-protein interaction data (CePIN) (TCGA IlluminaHiSeq_RNASeqV2, pan-cancer normalized log2(norm_counts+1) data, version 2016-08-16) (PINA2 ppi data) |
| Top |
| TissGeneProg for SLC6A16 |
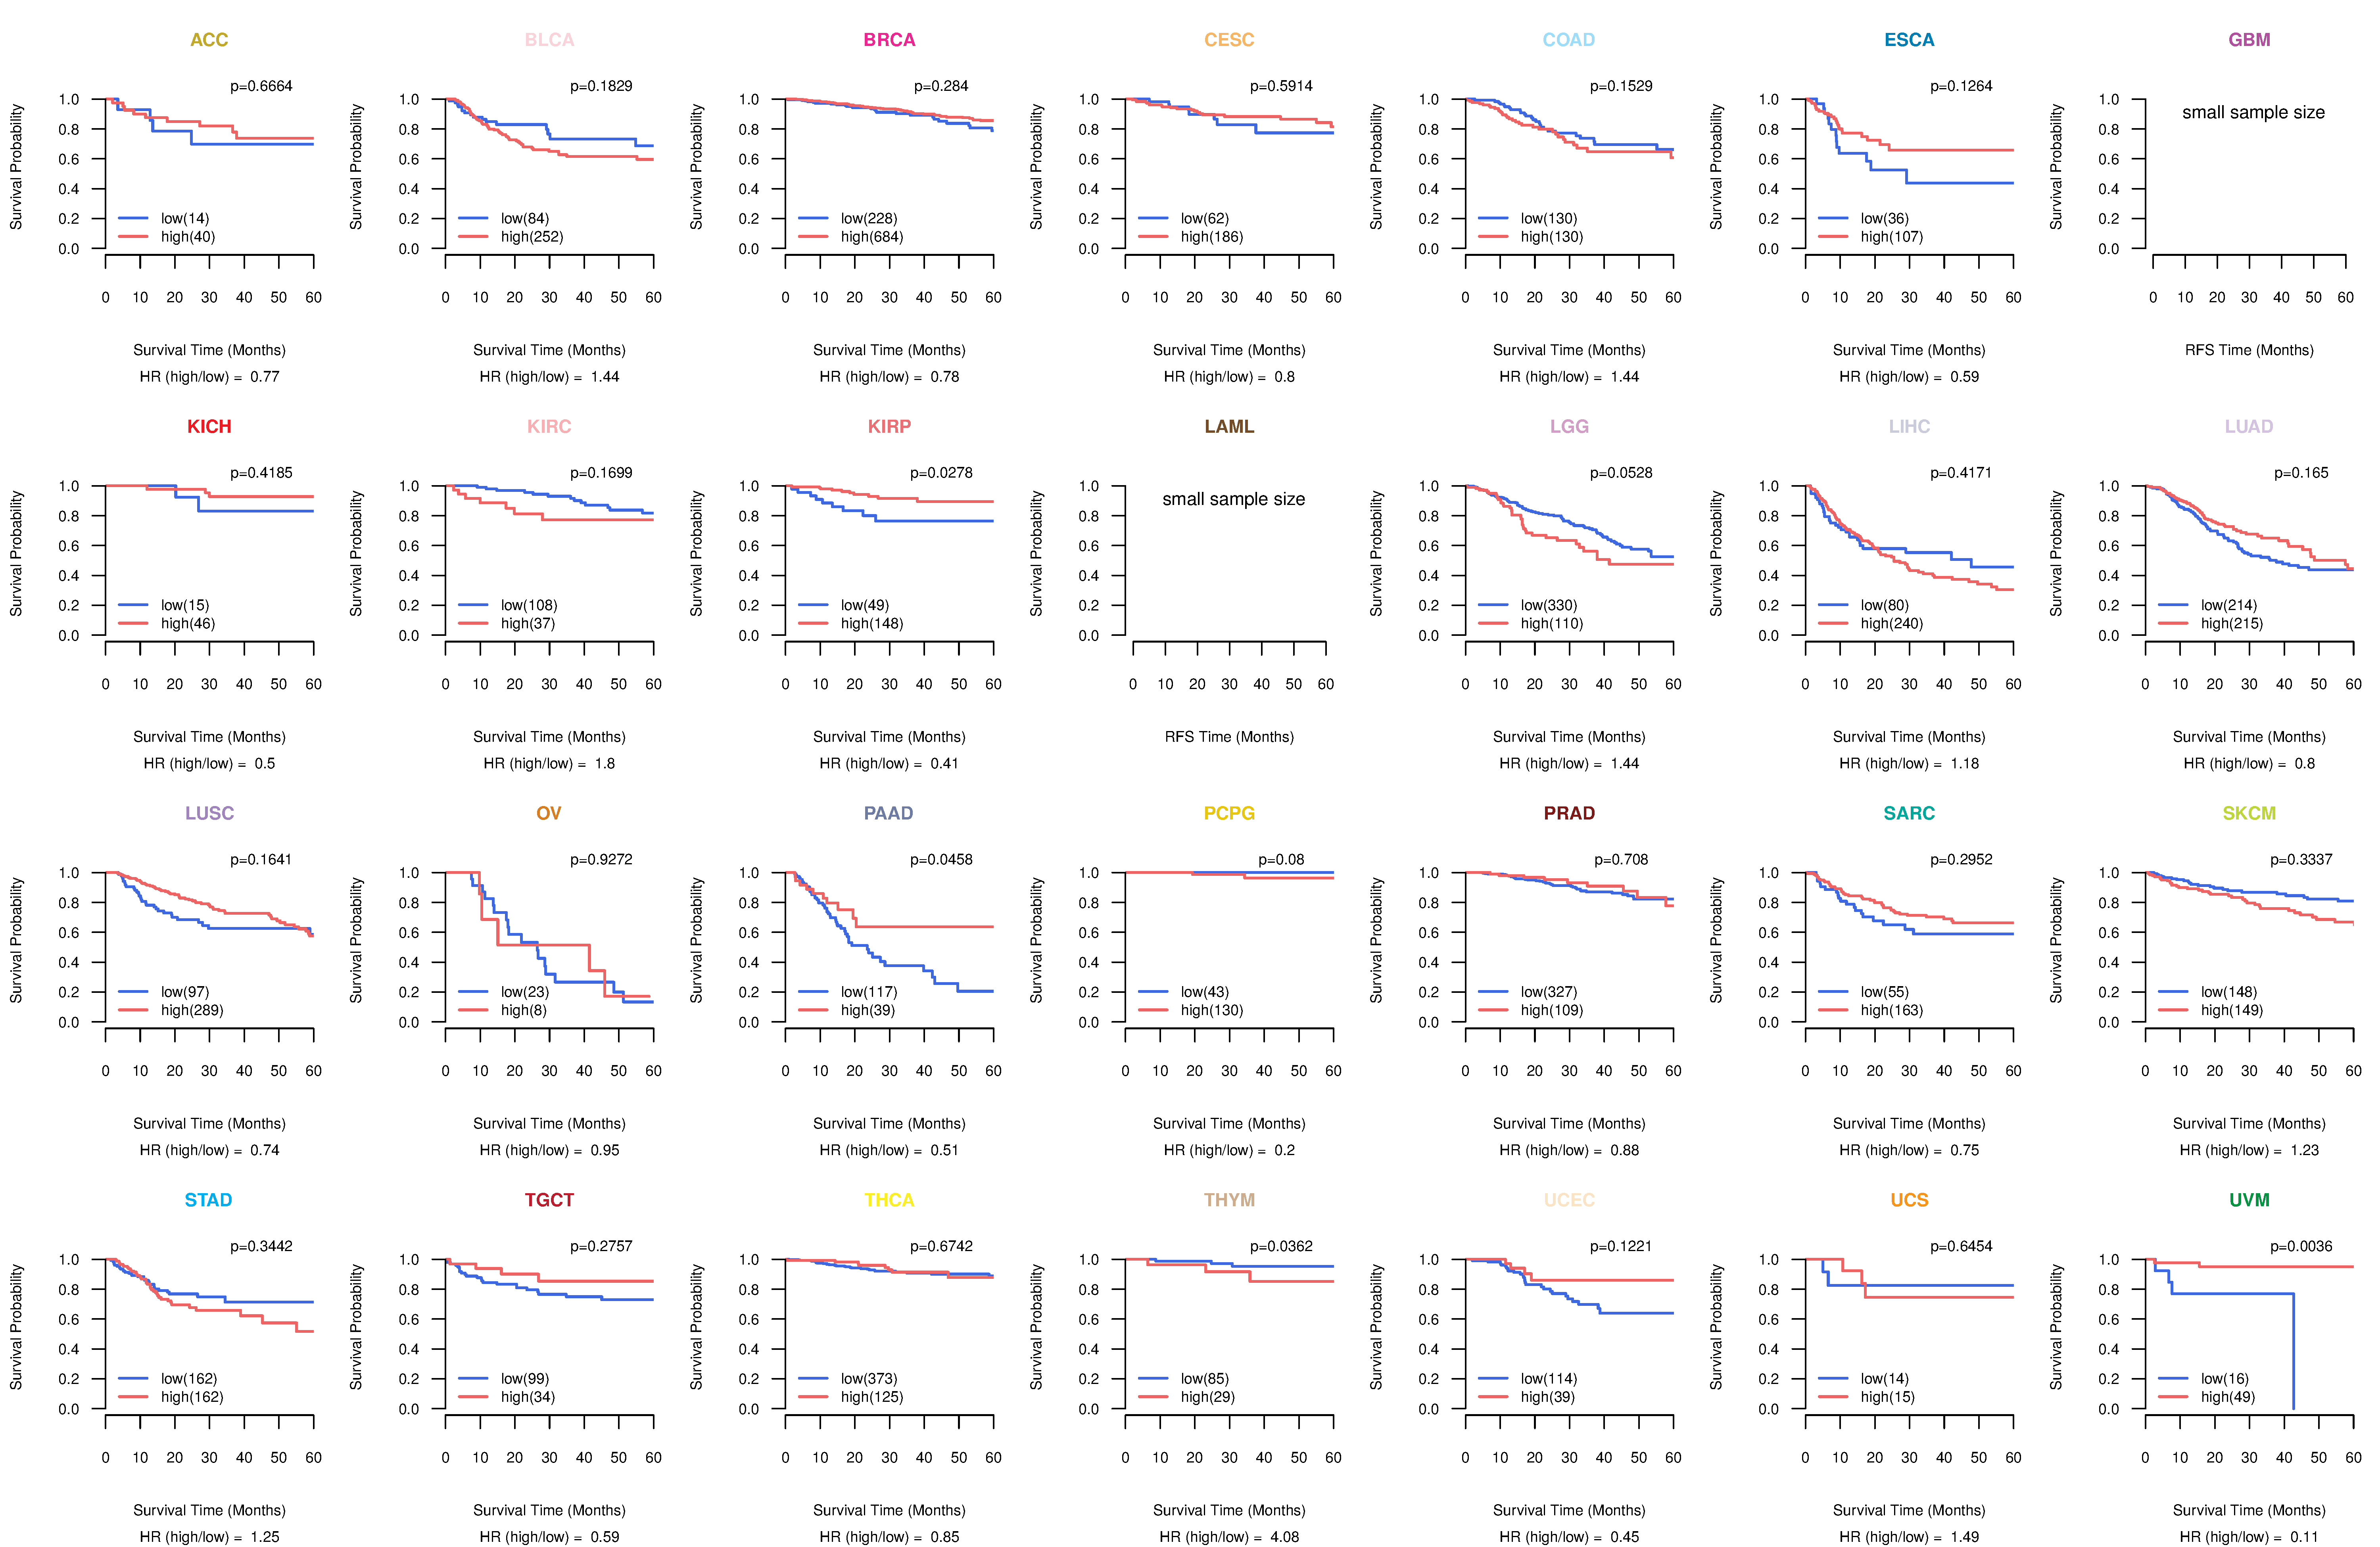
| Kaplan-Meier plots with logrank tests of overall survival (OS) using 28 cancer types (TCGA IlluminaHiSeq_RNASeqV2, pan-cancer normalized log2(norm_counts+1) data, version 2016-08-16) (TCGA clinicalMatrix, phenotype data, version 2016-04-27) * Click on the image to enlarge it in a new window. |
 |
| Kaplan-Meier plots with logrank test of relapse free survival (RFS) using 28 cancer types (TCGA IlluminaHiSeq_RNASeqV2, pan-cancer normalized log2(norm_counts+1) data, version 2016-08-16) (TCGA clinicalMatrix, phenotype data, version 2016-04-27) * Click on the image enlarge it in a new window. |
 |
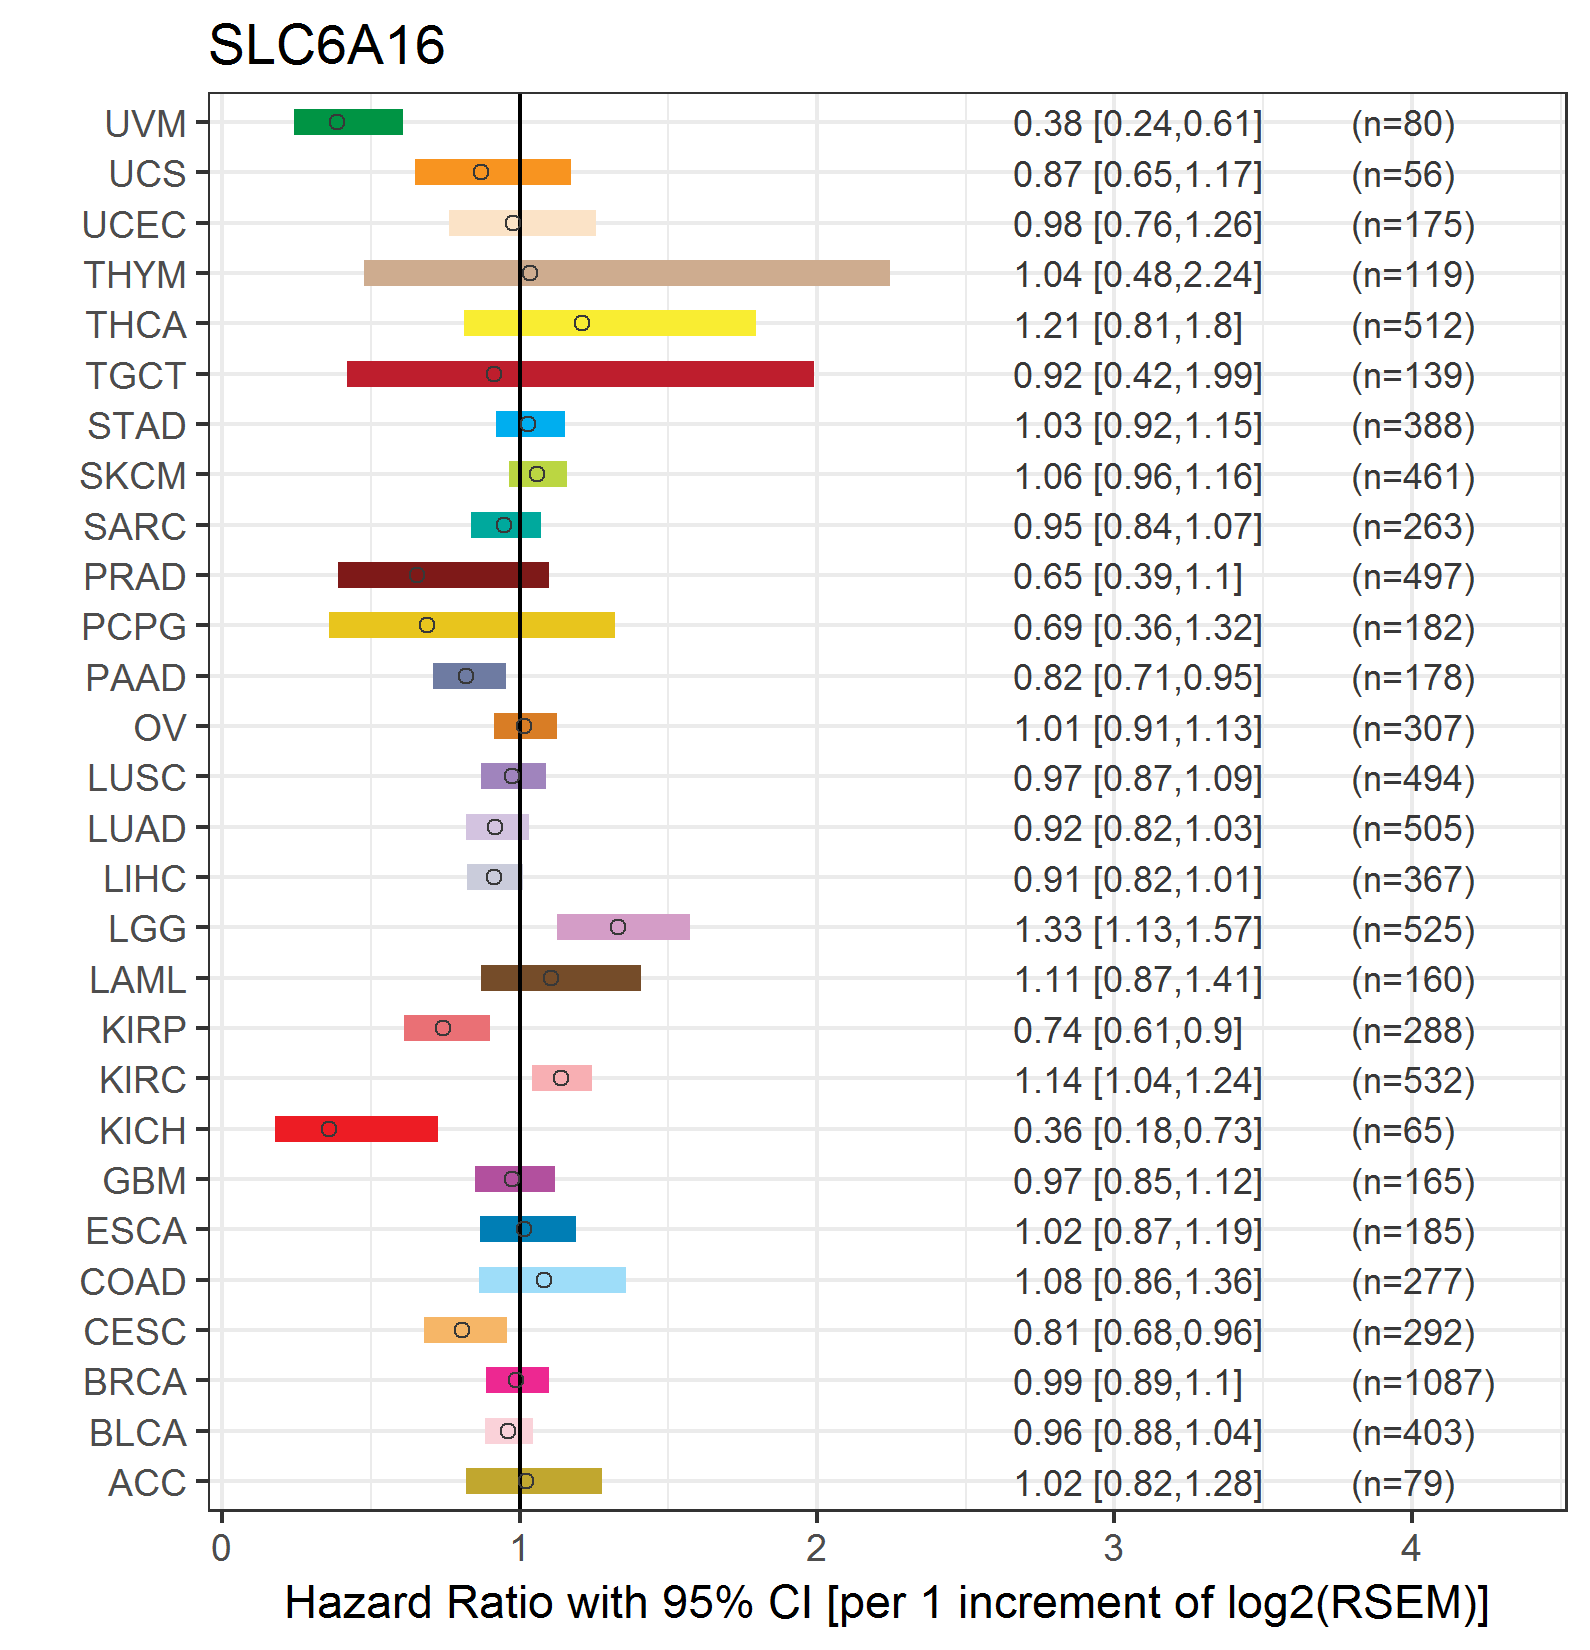
| Forest plot of Cox proportional hazard ratio (HR) and 95% CI of overall survival (OS) using 28 cancer types (TCGA IlluminaHiSeq_RNASeqV2, pan-cancer normalized log2(norm_counts+1) data, version 2016-08-16) (TCGA clinicalMatrix, phenotype data, version 2016-04-27) * Click on the image enlarge it in a new window. |
 |
| Forest plot of Cox proportional hazard ratio (HR) and 95% CI of relapse free survival (RFS) using 28 cancer types (TCGA IlluminaHiSeq_RNASeqV2, pan-cancer normalized log2(norm_counts+1) data, version 2016-08-16) (TCGA clinicalMatrix, phenotype data, version 2016-04-27) * Click on the image enlarge it in a new window. |
 |
| Top |
| TissGeneClin for SLC6A16 |
| TissGeneDrug for SLC6A16 |
| Drug information targeting TissGene (DrugBank Version 5.0.6, 2017-04-01) |
| DrugBank ID | Drug name | Drug activity | Drug type | Drug status |
| Top |
| TissGeneDisease for SLC6A16 |
| Disease information associated with TissGene (DisGeNet, 2016-06-01) |
| Disease ID | Disease name | # pubmeds | Source |
|
Copyright 2016-Present - The University of Texas Health Science Center at Houston (UTHealth) Web File Viewing | How to Report, Fraud, Waste and Abuse | State of Texas | Statewide Search | Texas Homeland Security | Site Policies |