 |
| |
| |
| |
| |
| |
| |
|

| TissGeneSummary for GRIN1 |
 Gene summary Gene summary |
| Basic gene information | Gene symbol | GRIN1 |
| Gene name | glutamate receptor, ionotropic, N-methyl D-aspartate 1 | |
| Synonyms | GluN1|MRD8|NMD-R1|NMDA1|NMDAR1|NR1 | |
| Cytomap | UCSC genome browser: 9q34.3 | |
| Type of gene | protein-coding | |
| RefGenes | NM_000832.6, NM_001185090.1,NM_001185091.1,NM_007327.3,NM_021569.3, | |
| Description | N-methyl-D-aspartate receptor channel, subunit zeta-1N-methyl-D-aspartate receptor subunit NR1glutamate [NMDA] receptor subunit zeta 1glutamate [NMDA] receptor subunit zeta-1glutamate receptor ionotropic, NMDA 1 | |
| Modification date | 20141207 | |
| dbXrefs | MIM : 138249 | |
| HGNC : HGNC | ||
| Ensembl : ENSG00000176884 | ||
| HPRD : 15926 | ||
| Vega : OTTHUMG00000020976 | ||
| Protein | UniProt: go to UniProt's Cross Reference DB Table | |
| Expression | CleanEX: HS_GRIN1 | |
| BioGPS: 2902 | ||
| Pathway | NCI Pathway Interaction Database: GRIN1 | |
| KEGG: GRIN1 | ||
| REACTOME: GRIN1 | ||
| Pathway Commons: GRIN1 | ||
| Context | iHOP: GRIN1 | |
| ligand binding site mutation search in PubMed: GRIN1 | ||
| UCL Cancer Institute: GRIN1 | ||
| Assigned class in TissGDB* | C | |
| Included tissue-specific gene expression resources | HPA,TiGER | |
| Specific-tissues in normal samples (assigned by TissGDB using HPA, TiGER, and GTEx) | Brain | |
| Cancer types related to the specific-tissues in cancer samples (assigned by TissGDB using TCGA) | GBM,LGG | |
| Reference showing the relevant tissue of GRIN1 | ||
| Description by TissGene annotations | ||
| * Class A consists of genes with literature evidence and is part of the cTissGenes. Class B consists of only cTissGenes without additional evidence. The remaining genes belong to Class C. |
| Gene ontology having evidence of Inferred from Direct Assay (IDA) from Entrez |
| GO ID | GO term | PubMed ID | GO:0006812 | cation transport | 7685113 | GO:0042391 | regulation of membrane potential | 17047094 | GO:0045471 | response to ethanol | 18445116 | GO:0070588 | calcium ion transmembrane transport | 7685113 | GO:0006812 | cation transport | 7685113 | GO:0042391 | regulation of membrane potential | 17047094 | GO:0045471 | response to ethanol | 18445116 | GO:0070588 | calcium ion transmembrane transport | 7685113 |
| Top |
| TissGeneExp for GRIN1 |
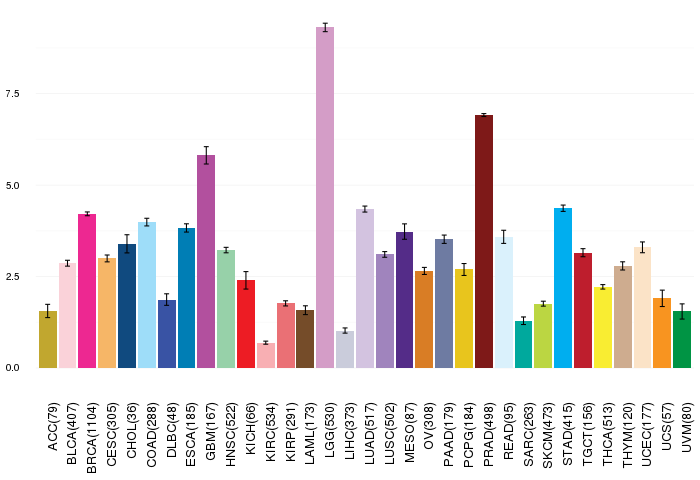
| Gene expressions across 28 cancer types (X-axis: cancer type and Y-axis: log2(norm_counts+1)) (TCGA IlluminaHiSeq_RNASeqV2, pan-cancer normalized log2(norm_counts+1) data, version 2016-08-16) |
 |
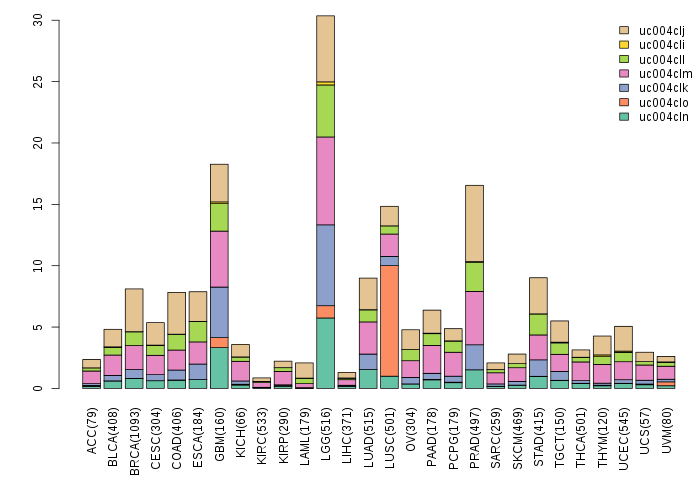
| Gene isoform expressions across 28 cancer types (X-axis: cancer type and Y-axis: log2(norm_counts+1)) (TCGA pan-cancer tcga_rsem_isoform_tpm, version 2016-09-01) |
 |
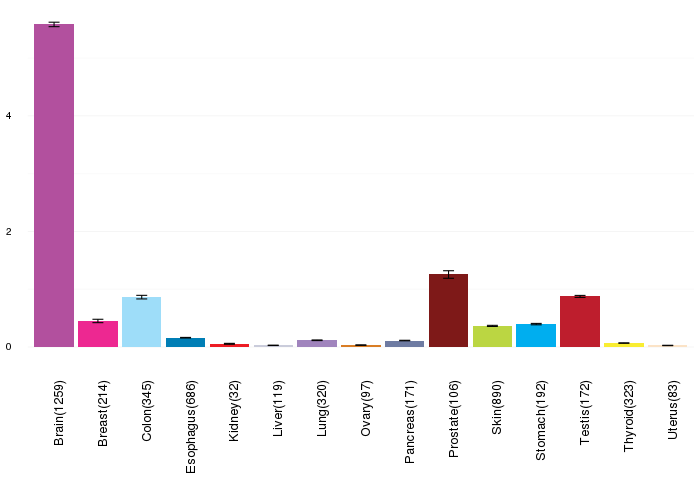
| Gene expressions across normal tissues of GTEx data (GTEx GTEx_Analysis_v6_RNA-seq_RNA-SeQCv1.1.8_gene_rpkm.gct) - Here, we shows the matched tissue types only among our 28 cancer types. |
 |
| Different expressions across 14 cancer types with more than 10 samples between matched tumors and normals (X-axis: cancer type and Y-axis: log2(norm_counts+1)) (TCGA IlluminaHiSeq_RNASeqV2, pan-cancer normalized log2(norm_counts+1) data, version 2016-08-16) |
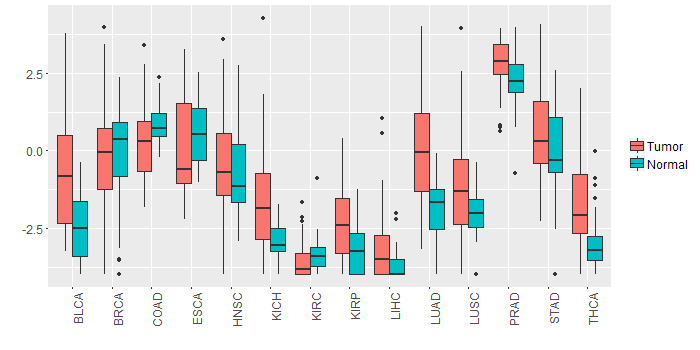 |
| - Significantly differentially expressed cancer types and information. (|Fold change|>1 and FDR<0.05) |
| Cancer type | Mean(exp) in tumor | Mean(exp) in matched normal | Log2FC | P-val. | FDR |
| LUAD | -0.00167191 | -1.860433979 | 1.858762069 | 3.44E-10 | 1.93E-09 |
| THCA | -1.748144937 | -3.011844937 | 1.2637 | 2.79E-08 | 1.31E-07 |
| BLCA | -0.709259478 | -2.46181211 | 1.752552632 | 0.00159 | 0.010493056 |
| KICH | -1.581184531 | -2.930248531 | 1.349064 | 0.00257 | 0.005158725 |
| Top |
| TissGene-miRNA for GRIN1 |
| Significantly anti-correlated miRNAs of TissGene across 28 cancer types (Gene-miRNA relations from TargetScanHuman Relsease 7.1, Conserved_Site_Context_Scores.txt.zip, 06.01.2016) (TCGA IlluminaHiSeq_miRNASeq, log2(RPM+1) data, version 2016-11-21) (TCGA IlluminaHiSeq_RNASeqV2, log2(normalized_count+1) data, version 2016-08-16) (Spearman’s Rank Correlation (p-value<0.05 and coefficient<-0.25)) |
| Cancer type | miRNA id | miRNA accession | P-val. | Coeff. | # samples |
| Top |
| TissGeneMut for GRIN1 |
| TissGeneSNV for GRIN1 |
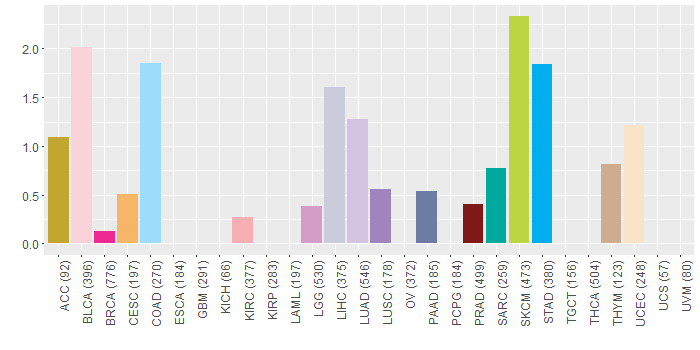
| nsSNV counts per each loci. Different colors of circles represent different cancer types. Circle size denotes number of samples. (TCGA somatic mutation (SNPs and small INDELs) data, version 2016-04-25) * Click on the image to enlarge it in a new window. |
 |
 |
| Somatic nucleotide variants of TissGene across 28 cancer types (X-axis: cancer type and Y-axis: % of mutated samples) The numbers in parentheses are numbers of samples with mutation (nsSNVs). (TCGA somatic mutation (SNPs and small INDELs) data, version 2016-04-25) |
 |
| - nsSNVs sorted by frequency. |
| AAchange | Cancer type | # samples |
| p.E253K | BLCA | 2 |
| p.T8M | COAD | 2 |
| p.R877W | BLCA | 1 |
| p.R36G | LUAD | 1 |
| p.P106L | LIHC | 1 |
| p.L91I | PRAD | 1 |
| p.R895M | STAD | 1 |
| p.A804T | UCEC | 1 |
| p.S108F | SARC | 1 |
| p.W657X | PAAD | 1 |
| p.Q73* | SKCM | 1 |
| p.R36Q | COAD | 1 |
| p.A735G | LIHC | 1 |
| p.N427I | HNSC | 1 |
| p.L651M | LUSC | 1 |
| p.R916M | STAD | 1 |
| p.R139C | STAD | 1 |
| p.R179C | LGG | 1 |
| p.E406X | CHOL | 1 |
| p.N592K | LUAD | 1 |
| p.D511H | MESO | 1 |
| p.V141L | THYM | 1 |
| p.D429G | STAD | 1 |
| p.E811G | SARC | 1 |
| p.G881S | SKCM | 1 |
| p.G482D | ACC | 1 |
| p.D906N | BLCA | 1 |
| p.M258V | LIHC | 1 |
| p.Q796* | SKCM | 1 |
| p.H134Y | SKCM | 1 |
| p.D343N | SKCM | 1 |
| p.H293L | PRAD | 1 |
| p.W151L | LIHC | 1 |
| p.Q686H | BLCA | 1 |
| p.I663V | LIHC | 1 |
| p.G761R | LUAD | 1 |
| p.E297Q | BLCA | 1 |
| p.D332H | BRCA | 1 |
| p.T302S | UCEC | 1 |
| p.T900M | UCEC | 1 |
| p.Y902C | LGG | 1 |
| p.R489W | STAD | 1 |
| p.E80D | COAD | 1 |
| p.R124G | LUAD | 1 |
| p.E406K | SKCM | 1 |
| p.R801P | BLCA | 1 |
| p.A176V | KIRC | 1 |
| p.I642V | LIHC | 1 |
| p.W636* | PAAD | 1 |
| p.R920H | COAD | 1 |
| p.R859Q | SKCM | 1 |
| p.V434A | STAD | 1 |
| p.A223V | STAD | 1 |
| p.D417N | SKCM | 1 |
| p.F113L | CESC | 1 |
| p.G900R | SKCM | 1 |
| p.A847V | STAD | 1 |
| p.D899N | SKCM | 1 |
| p.P382S | HNSC | 1 |
| p.S885P | SKCM | 1 |
| p.T791M | COAD | 1 |
| p.F113L | UCEC | 1 |
| p.D283N | BLCA | 1 |
| p.A826V | STAD | 1 |
| p.V362L | BLCA | 1 |
| p.Q796X | SKCM | 1 |
| p.I314F | LUAD | 1 |
| p.M154I | LUAD | 1 |
| p.A876T | LIHC | 1 |
| p.G587D | LUAD | 1 |
| Top |
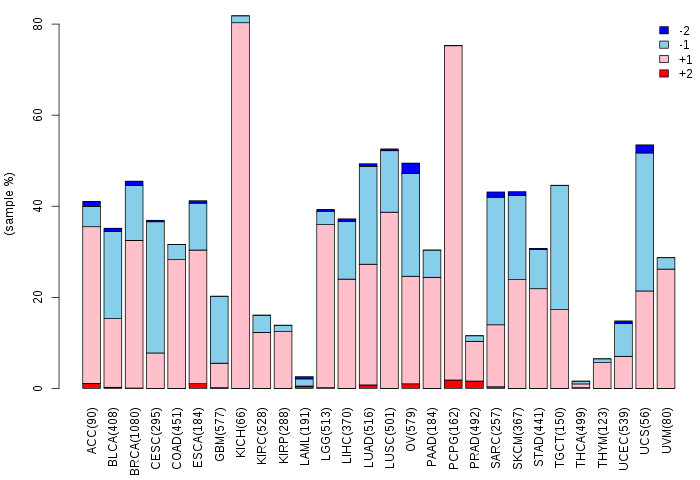
| TissGeneCNV for GRIN1 |
| Copy number variations of TissGene across 28 cancer types (X-axis: cancer type and Y-axis: % of CNV samples) (TCGA Gistic2_CopyNumber_Gistic2_all_data_by_genes, Gistic2 copy number data, version 2016-08-16) |
 |
| Top |
| TissGeneFusions for GRIN1 |
| Fusion genes including TissGene (ChimerDB 3.0, 2016-12-01 and TCGA fusion Portal 2015-12-01) |
| Database | Src | Cancer type | Sample | Fusion gene | ORF | 5'-gene BP | 3'-gene BP |
| Chimerdb3.0 | ChiTaRs | NA | BQ636708 | GRIN1-GRIN1 | chr9:140063072 | chr9:140056481 | |
| Chimerdb3.0 | FusionScan | PRAD | TCGA-EJ-A46G-01A | EHMT1-GRIN1 | In-Frame | chr9:140707982 | chr9:140036464 |
| TCGAfusionPortal | PRADA | BRCA | TCGA-A7-A6VY-01A | EHMT1-GRIN1 | In-frame | Chr9:140611634 | Chr9:140036465 |
| TCGAfusionPortal | PRADA | LGG | TCGA-HT-7873-01B | CDK5RAP2-GRIN1 | In-frame | Chr9:123280705 | Chr9:140036465 |
| TCGAfusionPortal | PRADA | PRAD | TCGA-EJ-A46G-01A | EHMT1-GRIN1 | In-frame | Chr9:140707982 | Chr9:140036465 |
| Top |
| TissGeneNet for GRIN1 |
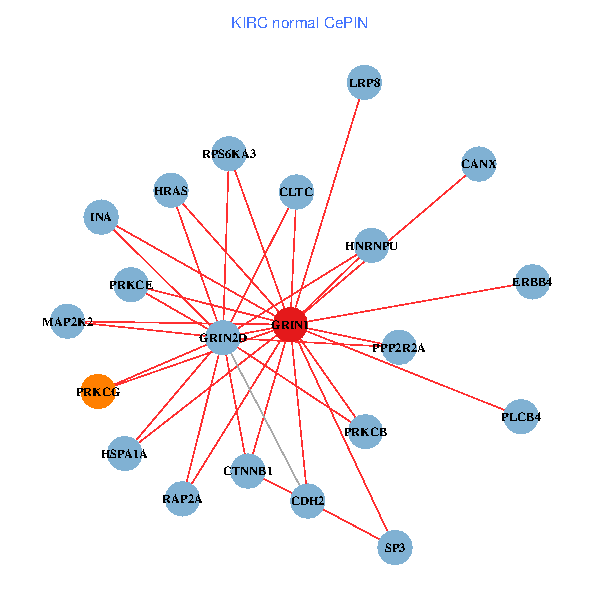
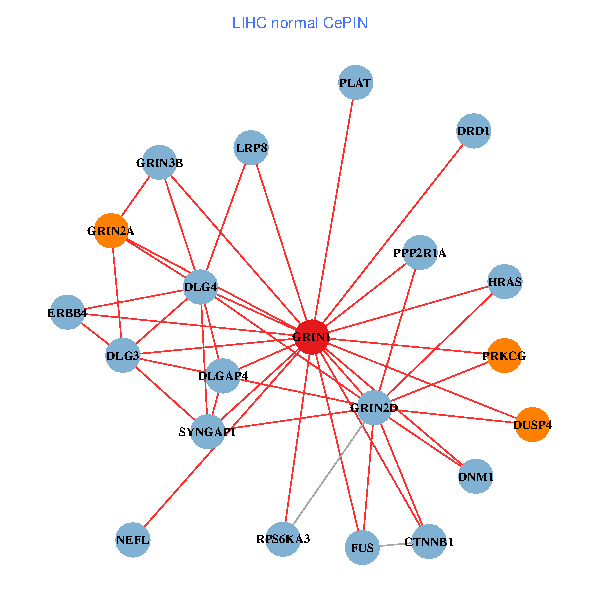
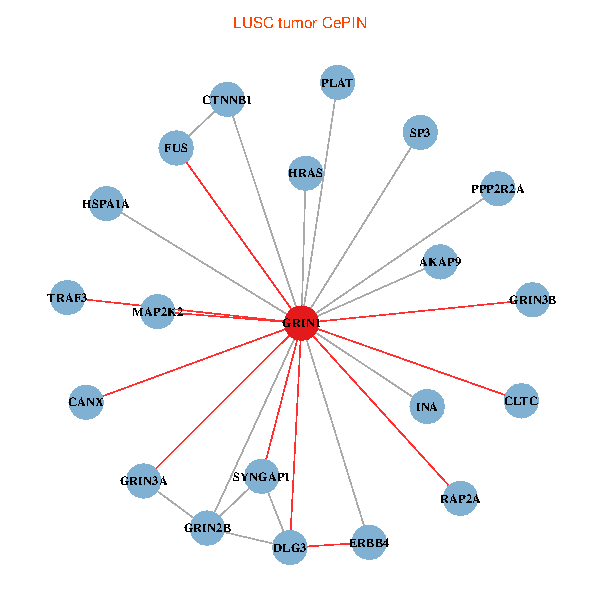
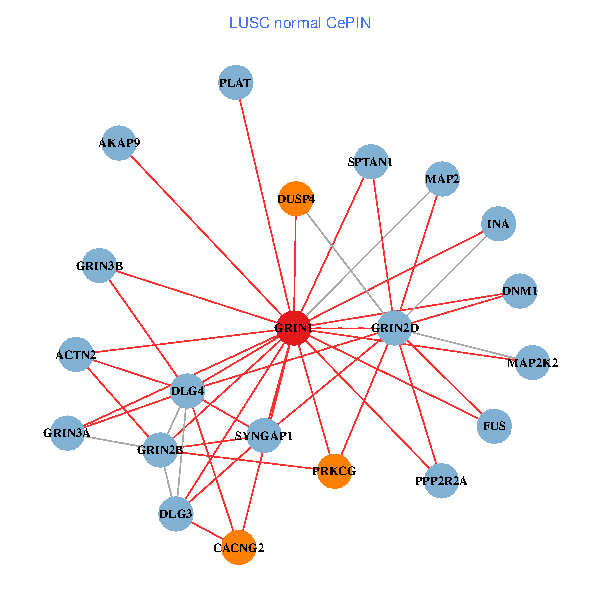
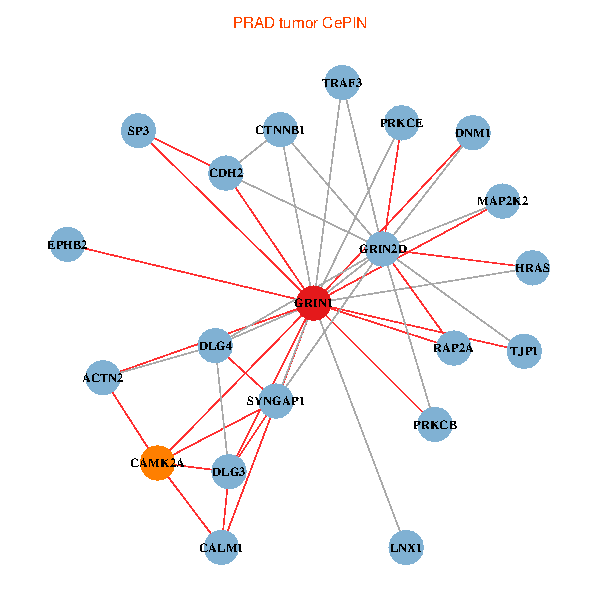
| Co-expressed gene networks based on protein-protein interaction data (CePIN) (TCGA IlluminaHiSeq_RNASeqV2, pan-cancer normalized log2(norm_counts+1) data, version 2016-08-16) (PINA2 ppi data) |
| BRCA (tumor) | BRCA (normal) |
| GRIN1, FUS, ERBB4, RAP2A, CTNNB1, DRD1, DLG2, DLG4, CALM1, EPHB2, HNRNPU, PPP2R1A, PLAT, CLTC, MYH9, TJP1, DUSP4, RPS6KA3, SYNGAP1, DLG3, EPHB4 (tumor) | GRIN1, ERBB4, HRAS, RAP2A, CTNNB1, DLG2, GRIN2B, HNRNPU, PPP2R1A, PLAT, LRP8, DNM1, LNX1, DUSP4, RPS6KA3, CDH2, DLG3, AKAP9, MAP2, INA, EPHB4 (normal) |
 |  |
| COAD (tumor) | COAD (normal) |
| GRIN1, PRKCG, PLCG1, CTNNB1, GRIN2A, DLG2, CAMK2A, DLG4, PPP2R1A, PRKCE, PLAT, CANX, MAP2K2, DNM1, TJP1, SYNGAP1, PPP2R2A, DLG3, DLGAP4, MAP2, EPHB4 (tumor) | GRIN1, ERBB4, PRKCG, PLCG1, RAP2A, GRIN2D, NANOS1, CTNNB1, DRD1, CAMK2A, EPHB2, SPTAN1, TRAF3, NEFL, DUSP4, RPS6KA3, PPP2R2A, NF1, CACNG2, PLCB4, EPHB4 (normal) |
 |  |
| HNSC (tumor) | HNSC (normal) |
| GRIN1, ERBB4, HRAS, RAP2A, GRIN2D, CTNNB1, GRIN2A, GRIN2B, DLG4, CALM1, EPHB2, PPP2R1A, CANX, LRP8, NEFL, TJP1, DUSP4, SYNGAP1, PPP2R2A, NF1, PLCB4 (tumor) | GRIN1, FUS, ERBB4, PRKCG, GRIN2D, CTNNB1, DRD1, GRIN2B, CAMK2A, MYH9, CANX, DNM1, LNX1, TJP1, DUSP4, DLG3, CACNG2, GRIN3B, INA, PLCB4, EPHB4 (normal) |
 | 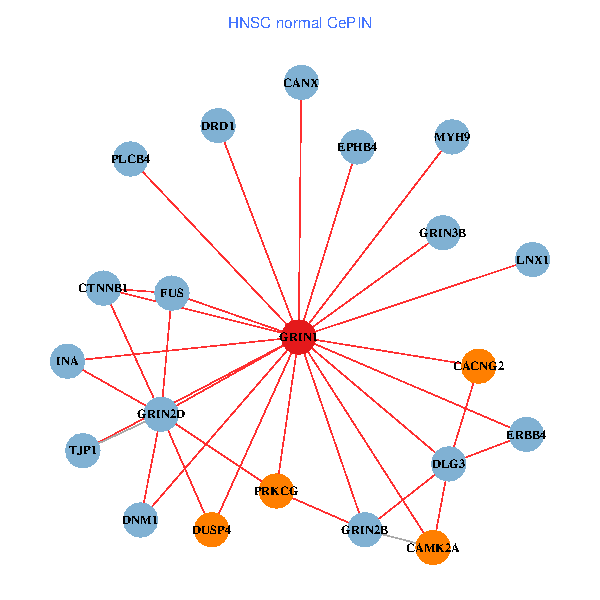 |
| KICH (tumor) | KICH (normal) |
| GRIN1, FUS, HRAS, PRKCG, PLCG1, GRIN2D, GRIN2A, DLG4, ACTN2, PRKCE, SPTAN1, MYH9, CANX, MAP2K2, NEFL, DNM1, DUSP4, SYNGAP1, DLGAP4, PLCB4, EPHB4 (tumor) | GRIN1, PRKCG, RAP2A, DRD1, GRIN2A, GRIN2B, CALM1, ACTN2, PRKCE, SPTAN1, SP3, CANX, TRAF3, LNX1, DUSP4, CDH2, PPP2R2A, DLG3, AKAP9, CACNG2, PLCB4 (normal) |
 | 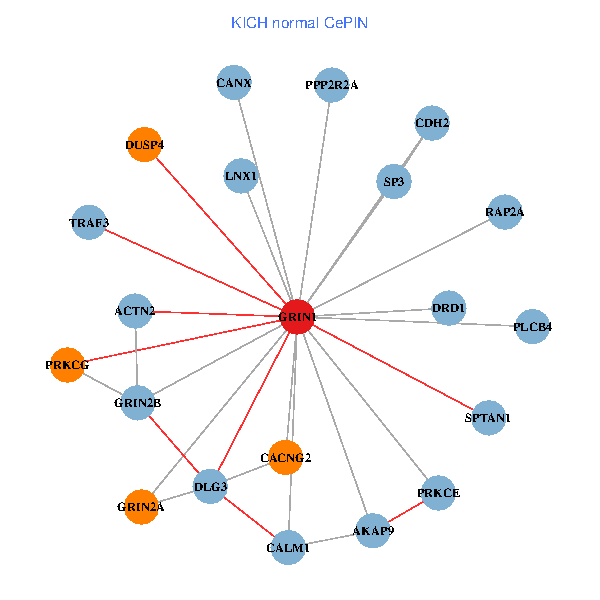 |
| KIRC (tumor) | KIRC (normal) |
| GRIN1, FUS, HRAS, PRKCG, RAP2A, GRIN2D, DLG4, EPHB2, HNRNPU, PPP2R1A, HSPA1A, PRKCE, MYH9, LRP8, MAP2K2, DUSP4, PRKCB, NF1, GRIN3B, INA, GRIN3A (tumor) | GRIN1, ERBB4, HRAS, PRKCG, RAP2A, GRIN2D, CTNNB1, HNRNPU, HSPA1A, PRKCE, CLTC, SP3, CANX, LRP8, MAP2K2, PRKCB, RPS6KA3, CDH2, PPP2R2A, INA, PLCB4 (normal) |
 |  |
| KIRP (tumor) | KIRP (normal) |
| GRIN1, FUS, PRKCG, PLCG1, RAP2A, GRIN2D, CTNNB1, CAMK2A, DLG4, CALM1, EPHB2, ACTN2, PRKCE, SPTAN1, LRP8, PRKCB, CDH2, SYNGAP1, PPP2R2A, MAP2, PLCB4 (tumor) | GRIN1, HRAS, PRKCG, RAP2A, GRIN2D, GRIN2B, DLG4, PRKCE, CLTC, MYH9, SP3, CANX, MAP2K2, TRAF3, NEFL, DNM1, RPS6KA3, NF1, GRIN3B, PLCB4, EPHB4 (normal) |
 |  |
| LIHC (tumor) | LIHC (normal) |
| GRIN1, ERBB4, PRKCG, PLCG1, GRIN2D, NANOS1, CTNNB1, DRD1, GRIN2A, CAMK2A, ACTN2, HSPA1A, PRKCE, PLAT, MYH9, MAP2K2, PRKCB, DLG3, NF1, AKAP9, GRIN3B (tumor) | GRIN1, FUS, ERBB4, HRAS, PRKCG, GRIN2D, CTNNB1, DRD1, GRIN2A, DLG4, PPP2R1A, PLAT, LRP8, NEFL, DNM1, DUSP4, RPS6KA3, SYNGAP1, DLG3, DLGAP4, GRIN3B (normal) |
 |  |
| LUAD (tumor) | LUAD (normal) |
| GRIN1, ERBB4, RAP2A, DRD1, CALM1, PLAT, SP3, TRAF3, DNM1, LNX1, PRKCB, CDH2, SYNGAP1, DLG3, NF1, AKAP9, CACNG2, MAP2, GRIN3B, INA, GRIN3A (tumor) | GRIN1, FUS, HRAS, PRKCG, PLCG1, RAP2A, GRIN2D, NANOS1, CTNNB1, GRIN2A, CALM1, HSPA1A, SPTAN1, MYH9, CANX, MAP2K2, DNM1, DLGAP4, AKAP9, GRIN3B, PLCB4 (normal) |
 |  |
| LUSC (tumor) | LUSC (normal) |
| GRIN1, FUS, ERBB4, HRAS, RAP2A, CTNNB1, GRIN2B, HSPA1A, PLAT, CLTC, SP3, CANX, MAP2K2, TRAF3, SYNGAP1, PPP2R2A, DLG3, AKAP9, GRIN3B, INA, GRIN3A (tumor) | GRIN1, FUS, PRKCG, GRIN2D, GRIN2B, DLG4, ACTN2, PLAT, SPTAN1, MAP2K2, DNM1, DUSP4, SYNGAP1, PPP2R2A, DLG3, AKAP9, CACNG2, MAP2, GRIN3B, INA, GRIN3A (normal) |
 |  |
| PRAD (tumor) | PRAD (normal) |
| GRIN1, HRAS, RAP2A, GRIN2D, CTNNB1, CAMK2A, DLG4, CALM1, EPHB2, ACTN2, PRKCE, SP3, MAP2K2, TRAF3, DNM1, LNX1, TJP1, PRKCB, CDH2, SYNGAP1, DLG3 (tumor) | GRIN1, FUS, HRAS, PLCG1, RAP2A, GRIN2D, GRIN2A, HNRNPU, PRKCE, CLTC, CANX, MAP2K2, PRKCB, RPS6KA3, CDH2, PPP2R2A, NF1, DLGAP4, CACNG2, GRIN3B, EPHB4 (normal) |
 |  |
| STAD (tumor) | STAD (normal) |
| GRIN1, FUS, PLCG1, NANOS1, GRIN2A, CAMK2A, DLG4, CALM1, HNRNPU, ACTN2, PRKCE, SPTAN1, MYH9, DNM1, PRKCB, SYNGAP1, NF1, DLGAP4, CACNG2, INA, GRIN3A (tumor) | GRIN1, FUS, HRAS, PRKCG, RAP2A, GRIN2D, GRIN2A, DLG2, HNRNPU, PPP2R1A, PRKCE, PLAT, MYH9, LRP8, MAP2K2, DUSP4, PRKCB, RPS6KA3, NF1, GRIN3B, PLCB4 (normal) |
 |  |
| THCA (tumor) | THCA (normal) |
| GRIN1, FUS, ERBB4, HRAS, PRKCG, DRD1, DLG2, CLTC, SP3, CANX, LRP8, MAP2K2, TRAF3, LNX1, TJP1, DUSP4, PRKCB, NF1, AKAP9, PLCB4, GRIN3A (tumor) | GRIN1, FUS, HRAS, GRIN2D, DLG2, DLG4, PPP2R1A, CLTC, SP3, CANX, LRP8, MAP2K2, TRAF3, DNM1, DUSP4, CDH2, SYNGAP1, PPP2R2A, AKAP9, GRIN3B, PLCB4 (normal) |
 |  |
| Top |
| TissGeneProg for GRIN1 |
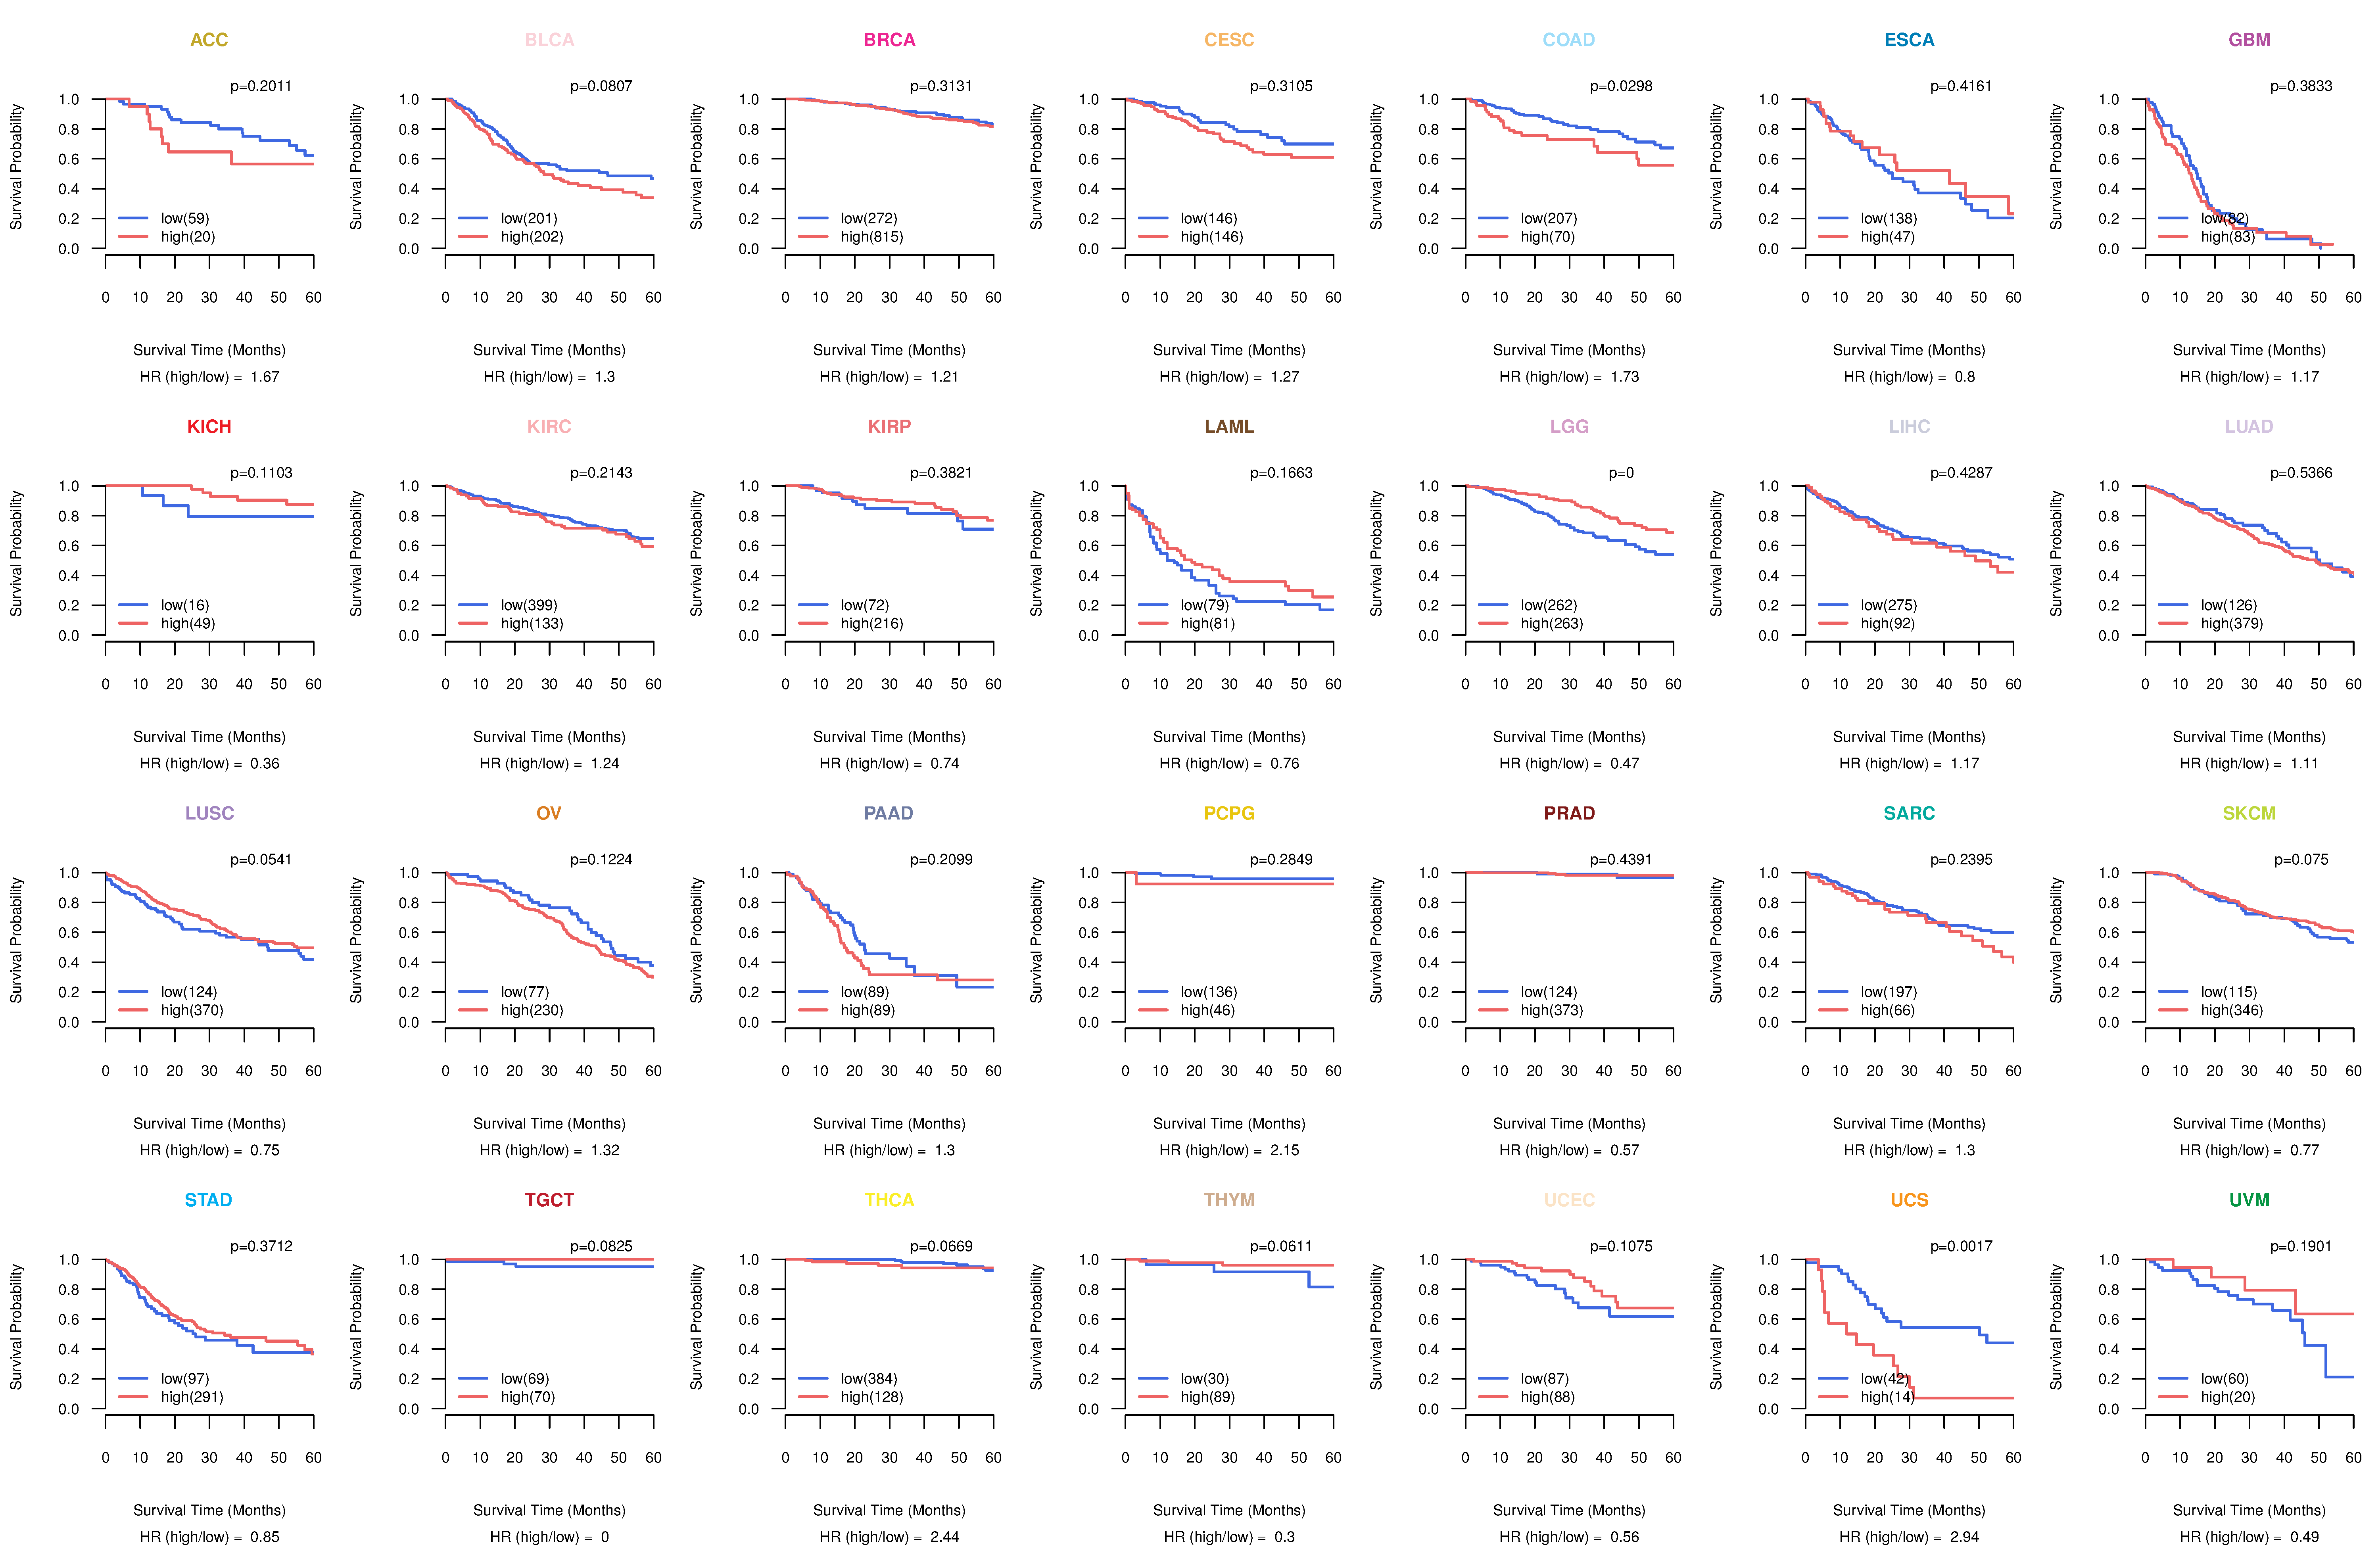
| Kaplan-Meier plots with logrank tests of overall survival (OS) using 28 cancer types (TCGA IlluminaHiSeq_RNASeqV2, pan-cancer normalized log2(norm_counts+1) data, version 2016-08-16) (TCGA clinicalMatrix, phenotype data, version 2016-04-27) * Click on the image to enlarge it in a new window. |
 |
| Kaplan-Meier plots with logrank test of relapse free survival (RFS) using 28 cancer types (TCGA IlluminaHiSeq_RNASeqV2, pan-cancer normalized log2(norm_counts+1) data, version 2016-08-16) (TCGA clinicalMatrix, phenotype data, version 2016-04-27) * Click on the image enlarge it in a new window. |
 |
| Forest plot of Cox proportional hazard ratio (HR) and 95% CI of overall survival (OS) using 28 cancer types (TCGA IlluminaHiSeq_RNASeqV2, pan-cancer normalized log2(norm_counts+1) data, version 2016-08-16) (TCGA clinicalMatrix, phenotype data, version 2016-04-27) * Click on the image enlarge it in a new window. |
 |
| Forest plot of Cox proportional hazard ratio (HR) and 95% CI of relapse free survival (RFS) using 28 cancer types (TCGA IlluminaHiSeq_RNASeqV2, pan-cancer normalized log2(norm_counts+1) data, version 2016-08-16) (TCGA clinicalMatrix, phenotype data, version 2016-04-27) * Click on the image enlarge it in a new window. |
 |
| Top |
| TissGeneClin for GRIN1 |
| TissGeneDrug for GRIN1 |
| Drug information targeting TissGene (DrugBank Version 5.0.6, 2017-04-01) |
| DrugBank ID | Drug name | Drug activity | Drug type | Drug status |
| DB01173 | Orphenadrine | Antagonist | Small molecule | Approved |
| DB01043 | Memantine | Binder | Small molecule | Approved|Investigational |
| DB08954 | Ifenprodil | Antagonist | Small molecule | Approved|Withdrawn |
| Top |
| TissGeneDisease for GRIN1 |
| Disease information associated with TissGene (DisGeNet, 2016-06-01) |
| Disease ID | Disease name | # pubmeds | Source |
| umls:C0036341 | Schizophrenia | 20 | BeFree,GAD,LHGDN,MGD |
| umls:C0005586 | Bipolar Disorder | 6 | BeFree,GAD,LHGDN |
| umls:C0001973 | Alcoholic Intoxication, Chronic | 5 | BeFree,GAD,LHGDN |
| umls:C0014544 | Epilepsy | 5 | BeFree |
| umls:C0014556 | Epilepsy, Temporal Lobe | 3 | BeFree |
| umls:C0033975 | Psychotic Disorders | 3 | BeFree,CTD_human |
| umls:C0002395 | Alzheimer's Disease | 2 | BeFree,LHGDN |
| umls:C0236736 | Cocaine-Related Disorders | 2 | CTD_human |
| umls:C1096063 | Drug Resistant Epilepsy | 2 | BeFree |
| umls:C0006142 | Malignant neoplasm of breast | 1 | BeFree |
| umls:C0013423 | Dystonia Musculorum Deformans | 1 | BeFree |
| umls:C0020179 | Huntington Disease | 1 | BeFree |
| umls:C0020615 | Hypoglycemia | 1 | BeFree |
| umls:C0026650 | Movement Disorders | 1 | BeFree |
| umls:C0028754 | Obesity | 1 | BeFree |
| umls:C0030193 | Pain | 1 | CTD_human |
| umls:C0030567 | Parkinson Disease | 1 | GAD |
| umls:C0032051 | Placental Insufficiency | 1 | RGD |
| umls:C0033860 | Psoriasis | 1 | LHGDN |
| umls:C0036572 | Seizures | 1 | BeFree,GAD |
| umls:C0037769 | West Syndrome | 1 | BeFree,GAD |
| umls:C0038273 | Stereotypic Movement Disorder | 1 | BeFree |
| umls:C0038454 | Cerebrovascular accident | 1 | BeFree |
| umls:C0043094 | Weight Gain | 1 | GAD |
| umls:C0085584 | Encephalopathies | 1 | BeFree |
| umls:C0206716 | Ganglioglioma | 1 | BeFree |
| umls:C0236663 | Alcohol withdrawal syndrome | 1 | BeFree |
| umls:C0543888 | Epileptic encephalopathy | 1 | BeFree |
| umls:C0678222 | Breast Carcinoma | 1 | BeFree |
| umls:C0746408 | mass lesion | 1 | BeFree |
| umls:C0751495 | Seizures, Focal | 1 | BeFree |
| umls:C0752308 | Hypoxia-Ischemia, Brain | 1 | RGD |
| umls:C0948008 | Ischemic stroke | 1 | BeFree |
| umls:C1458155 | Mammary Neoplasms | 1 | BeFree |
| umls:C1504404 | Hippocampal sclerosis | 1 | BeFree |
| umls:C1955869 | Malformations of Cortical Development | 1 | LHGDN |
| umls:C2911645 | Weight Loss Adverse Event | 1 | GAD |
| umls:C2911647 | Weight Gain Adverse Event | 1 | GAD |
| umls:C3272363 | Ischemic Cerebrovascular Accident | 1 | BeFree |
| umls:C3280282 | MENTAL RETARDATION, AUTOSOMAL DOMINANT 8 | 1 | CLINVAR,UNIPROT |
| umls:C3549742 | Breast cancer, lobular | 1 | BeFree |
|
Copyright 2016-Present - The University of Texas Health Science Center at Houston (UTHealth) Web File Viewing | How to Report, Fraud, Waste and Abuse | State of Texas | Statewide Search | Texas Homeland Security | Site Policies |