 |
| |
| |
| |
| |
| |
| |
|

| TissGeneSummary for DDX25 |
 Gene summary Gene summary |
| Basic gene information | Gene symbol | DDX25 |
| Gene name | DEAD (Asp-Glu-Ala-Asp) box helicase 25 | |
| Synonyms | GRTH | |
| Cytomap | UCSC genome browser: 11q24 | |
| Type of gene | protein-coding | |
| RefGenes | NM_013264.4, | |
| Description | ATP-dependent RNA helicase DDX25DEAD (Asp-Glu-Ala-Asp) box polypeptide 25DEAD box protein 25DEAD/H (Asp-Glu-Ala-Asp/His) box polypeptide 25gonadotropin-regulated testicular RNA helicase | |
| Modification date | 20141207 | |
| dbXrefs | MIM : 607663 | |
| HGNC : HGNC | ||
| Ensembl : ENSG00000109832 | ||
| HPRD : 06367 | ||
| Vega : OTTHUMG00000165859 | ||
| Protein | UniProt: go to UniProt's Cross Reference DB Table | |
| Expression | CleanEX: HS_DDX25 | |
| BioGPS: 29118 | ||
| Pathway | NCI Pathway Interaction Database: DDX25 | |
| KEGG: DDX25 | ||
| REACTOME: DDX25 | ||
| Pathway Commons: DDX25 | ||
| Context | iHOP: DDX25 | |
| ligand binding site mutation search in PubMed: DDX25 | ||
| UCL Cancer Institute: DDX25 | ||
| Assigned class in TissGDB* | C | |
| Included tissue-specific gene expression resources | TiGER,GTEx | |
| Specific-tissues in normal samples (assigned by TissGDB using HPA, TiGER, and GTEx) | Testis | |
| Cancer types related to the specific-tissues in cancer samples (assigned by TissGDB using TCGA) | TGCT | |
| Reference showing the relevant tissue of DDX25 | ||
| Description by TissGene annotations | ||
| * Class A consists of genes with literature evidence and is part of the cTissGenes. Class B consists of only cTissGenes without additional evidence. The remaining genes belong to Class C. |
| Gene ontology having evidence of Inferred from Direct Assay (IDA) from Entrez |
| GO ID | GO term | PubMed ID |
| Top |
| TissGeneExp for DDX25 |
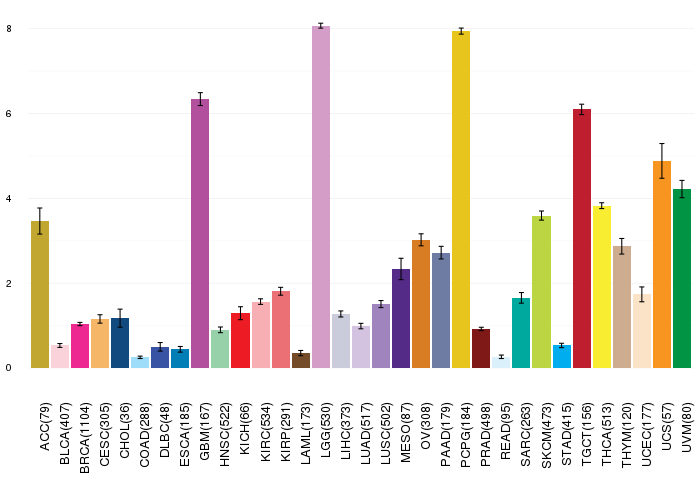
| Gene expressions across 28 cancer types (X-axis: cancer type and Y-axis: log2(norm_counts+1)) (TCGA IlluminaHiSeq_RNASeqV2, pan-cancer normalized log2(norm_counts+1) data, version 2016-08-16) |
 |
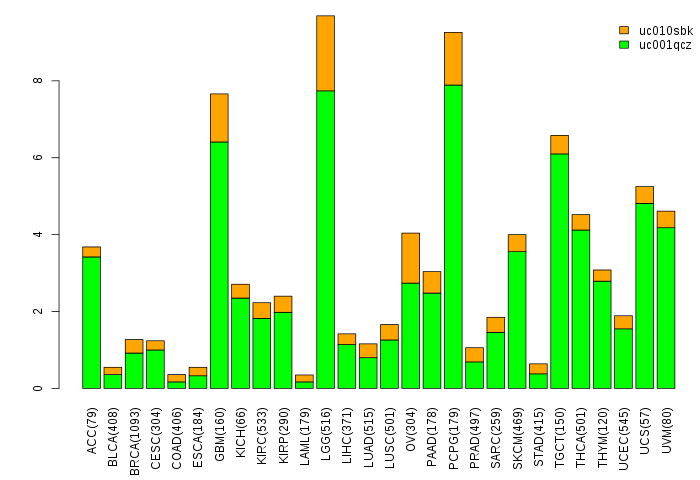
| Gene isoform expressions across 28 cancer types (X-axis: cancer type and Y-axis: log2(norm_counts+1)) (TCGA pan-cancer tcga_rsem_isoform_tpm, version 2016-09-01) |
 |
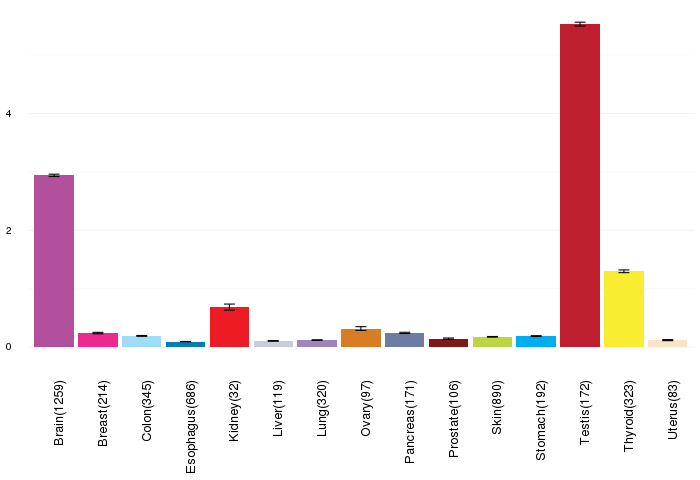
| Gene expressions across normal tissues of GTEx data (GTEx GTEx_Analysis_v6_RNA-seq_RNA-SeQCv1.1.8_gene_rpkm.gct) - Here, we shows the matched tissue types only among our 28 cancer types. |
 |
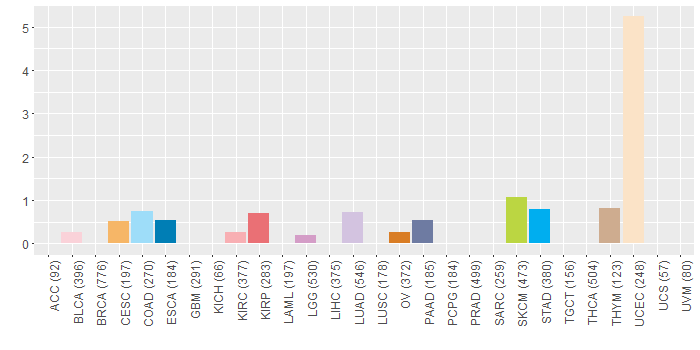
| Different expressions across 14 cancer types with more than 10 samples between matched tumors and normals (X-axis: cancer type and Y-axis: log2(norm_counts+1)) (TCGA IlluminaHiSeq_RNASeqV2, pan-cancer normalized log2(norm_counts+1) data, version 2016-08-16) |
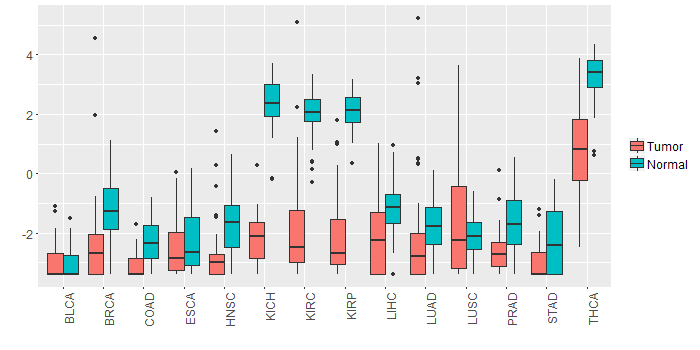 |
| - Significantly differentially expressed cancer types and information. (|Fold change|>1 and FDR<0.05) |
| Cancer type | Mean(exp) in tumor | Mean(exp) in matched normal | Log2FC | P-val. | FDR |
| KICH | -2.19280663 | 2.25146537 | -4.444272 | 6.58E-22 | 6.59E-20 |
| BRCA | -2.470087717 | -1.165869296 | -1.304218421 | 9.82E-18 | 5.98E-17 |
| THCA | 0.74569737 | 3.258043133 | -2.512345763 | 4.61E-21 | 2.43E-19 |
| KIRP | -1.996387005 | 2.093737995 | -4.090125 | 4.78E-17 | 1.93E-15 |
| KIRC | -1.93404013 | 2.05390987 | -3.98795 | 4.33E-35 | 1.16E-33 |
| Top |
| TissGene-miRNA for DDX25 |
| Significantly anti-correlated miRNAs of TissGene across 28 cancer types (Gene-miRNA relations from TargetScanHuman Relsease 7.1, Conserved_Site_Context_Scores.txt.zip, 06.01.2016) (TCGA IlluminaHiSeq_miRNASeq, log2(RPM+1) data, version 2016-11-21) (TCGA IlluminaHiSeq_RNASeqV2, log2(normalized_count+1) data, version 2016-08-16) (Spearman’s Rank Correlation (p-value<0.05 and coefficient<-0.25)) |
| Cancer type | miRNA id | miRNA accession | P-val. | Coeff. | # samples |
| Top |
| TissGeneMut for DDX25 |
| TissGeneSNV for DDX25 |
| nsSNV counts per each loci. Different colors of circles represent different cancer types. Circle size denotes number of samples. (TCGA somatic mutation (SNPs and small INDELs) data, version 2016-04-25) * Click on the image to enlarge it in a new window. |
 |
 |
| Somatic nucleotide variants of TissGene across 28 cancer types (X-axis: cancer type and Y-axis: % of mutated samples) The numbers in parentheses are numbers of samples with mutation (nsSNVs). (TCGA somatic mutation (SNPs and small INDELs) data, version 2016-04-25) |
 |
| - nsSNVs sorted by frequency. |
| AAchange | Cancer type | # samples |
| p.F258L | UCEC | 2 |
| p.M130I | UCEC | 1 |
| p.M115R | COAD | 1 |
| p.V199L | STAD | 1 |
| p.Q169R | STAD | 1 |
| p.E375D | UCEC | 1 |
| p.R242C | UCEC | 1 |
| p.R41Q | UCEC | 1 |
| p.I402L | UCEC | 1 |
| p.R204X | READ | 1 |
| p.R160T | BLCA | 1 |
| p.R348C | LUAD | 1 |
| p.N396T | PAAD | 1 |
| p.M190K | LUAD | 1 |
| p.L318M | UCEC | 1 |
| p.A399S | THYM | 1 |
| p.D424G | UCEC | 1 |
| p.G191E | SKCM | 1 |
| p.I336N | KIRP | 1 |
| p.R349Q | LUAD | 1 |
| p.E191Q | OV | 1 |
| p.K149N | UCEC | 1 |
| p.F344C | UCEC | 1 |
| p.R204Q | ESCA | 1 |
| p.A127V | UCEC | 1 |
| p.Q382* | CESC | 1 |
| p.R349Q | READ | 1 |
| p.N24D | COAD | 1 |
| p.L102M | UCEC | 1 |
| p.E477A | STAD | 1 |
| p.L179F | LUAD | 1 |
| p.A280V | KIRC | 1 |
| p.K441E | SKCM | 1 |
| p.G111R | SKCM | 1 |
| p.F193L | UCEC | 1 |
| p.A10T | DLBC | 1 |
| p.L139F | SKCM | 1 |
| p.P129H | LGG | 1 |
| p.E291G | KIRP | 1 |
| p.D414Y | SKCM | 1 |
| Top |
| TissGeneCNV for DDX25 |
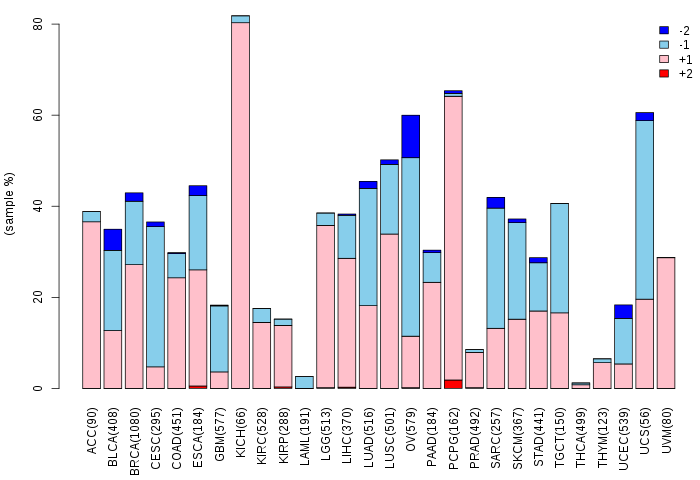
| Copy number variations of TissGene across 28 cancer types (X-axis: cancer type and Y-axis: % of CNV samples) (TCGA Gistic2_CopyNumber_Gistic2_all_data_by_genes, Gistic2 copy number data, version 2016-08-16) |
 |
| Top |
| TissGeneFusions for DDX25 |
| Fusion genes including TissGene (ChimerDB 3.0, 2016-12-01 and TCGA fusion Portal 2015-12-01) |
| Database | Src | Cancer type | Sample | Fusion gene | ORF | 5'-gene BP | 3'-gene BP |
| Chimerdb3.0 | ChiTaRs | NA | DB057466 | PAPPA-DDX25 | chr9:119024501 | chr11:125774403 | |
| Chimerdb3.0 | ChiTaRs | NA | AI954747 | PPM1G-DDX25 | chr2:27604190 | chr11:125775107 |
| Top |
| TissGeneNet for DDX25 |
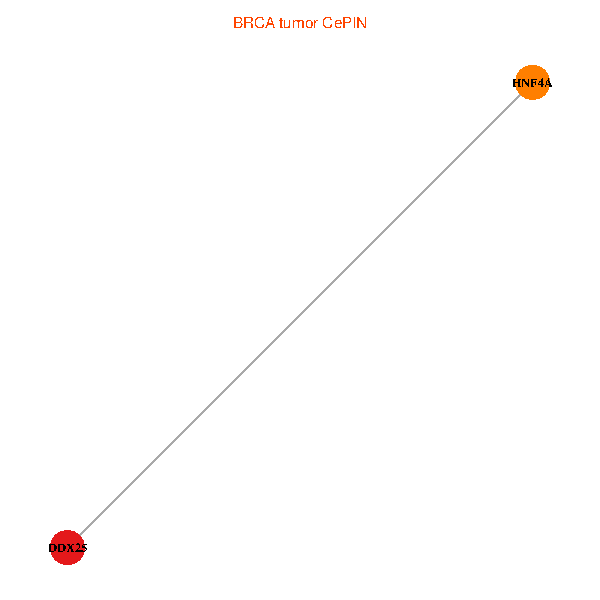
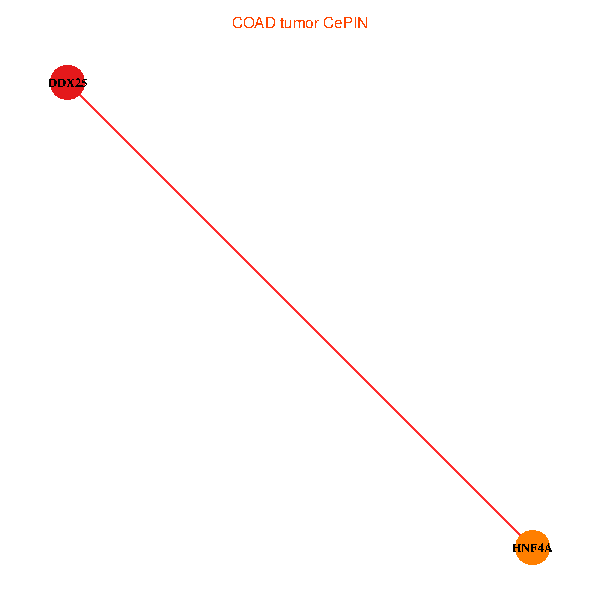
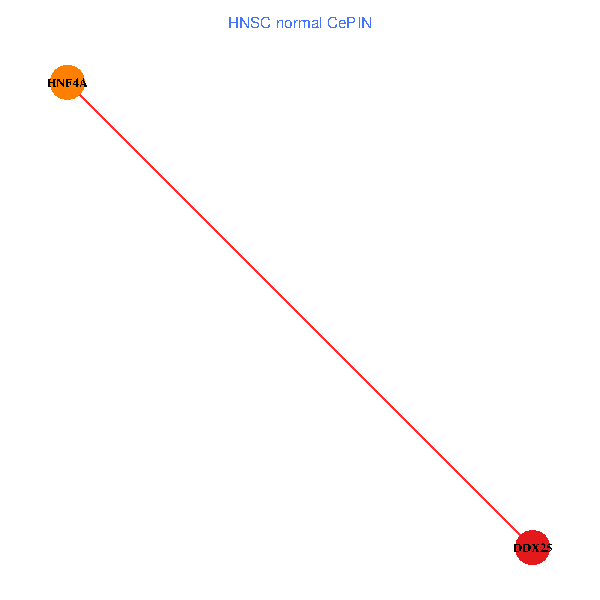
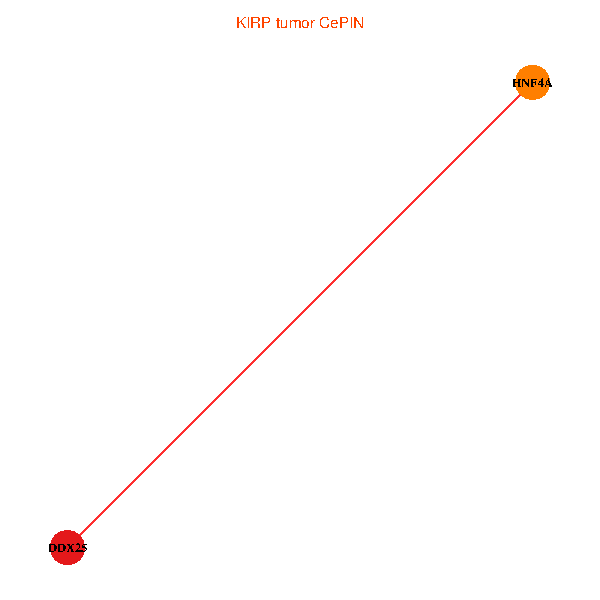
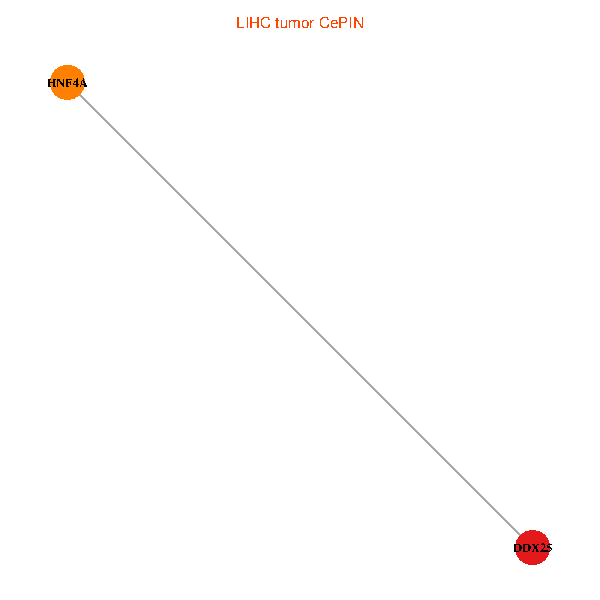
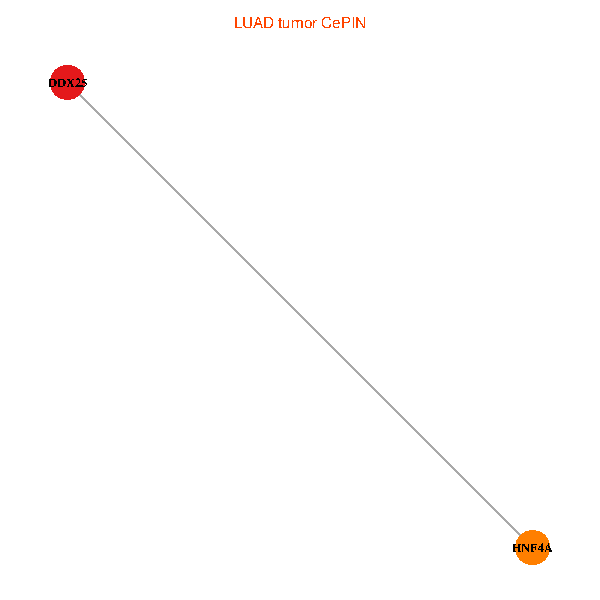
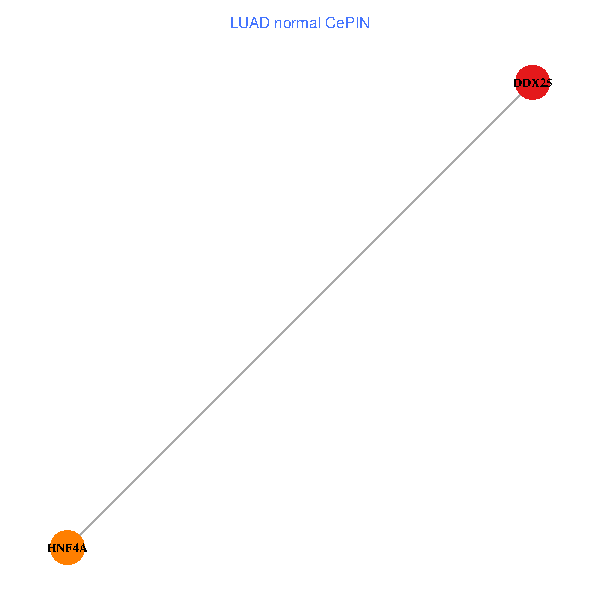
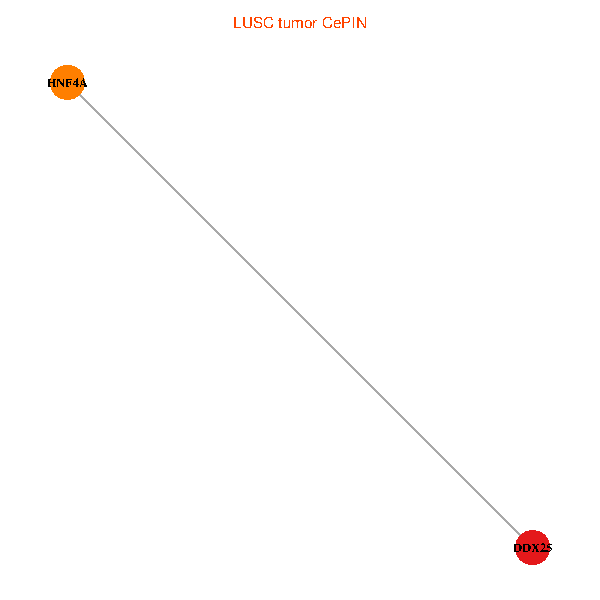
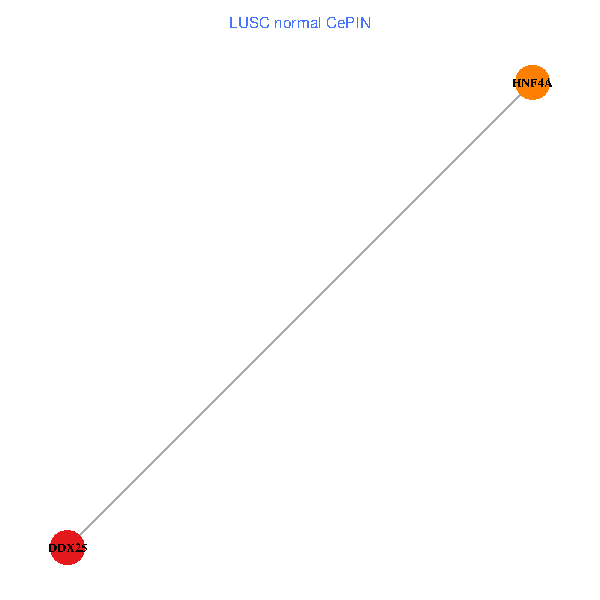
| Co-expressed gene networks based on protein-protein interaction data (CePIN) (TCGA IlluminaHiSeq_RNASeqV2, pan-cancer normalized log2(norm_counts+1) data, version 2016-08-16) (PINA2 ppi data) |
| BRCA (tumor) | BRCA (normal) |
| DDX25, HNF4A (tumor) | DDX25, HNF4A (normal) |
 |  |
| COAD (tumor) | COAD (normal) |
| DDX25, HNF4A (tumor) | DDX25, HNF4A (normal) |
 |  |
| HNSC (tumor) | HNSC (normal) |
| DDX25, HNF4A (tumor) | DDX25, HNF4A (normal) |
 |  |
| KICH (tumor) | KICH (normal) |
| DDX25, HNF4A (tumor) | DDX25, HNF4A (normal) |
 |  |
| KIRC (tumor) | KIRC (normal) |
| DDX25, HNF4A (tumor) | DDX25, HNF4A (normal) |
 |  |
| KIRP (tumor) | KIRP (normal) |
| DDX25, HNF4A (tumor) | DDX25, HNF4A (normal) |
 |  |
| LIHC (tumor) | LIHC (normal) |
| DDX25, HNF4A (tumor) | DDX25, HNF4A (normal) |
 |  |
| LUAD (tumor) | LUAD (normal) |
| DDX25, HNF4A (tumor) | DDX25, HNF4A (normal) |
 |  |
| LUSC (tumor) | LUSC (normal) |
| DDX25, HNF4A (tumor) | DDX25, HNF4A (normal) |
 |  |
| PRAD (tumor) | PRAD (normal) |
| DDX25, HNF4A (tumor) | DDX25, HNF4A (normal) |
 |  |
| STAD (tumor) | STAD (normal) |
| DDX25, HNF4A (tumor) | DDX25, HNF4A (normal) |
 |  |
| THCA (tumor) | THCA (normal) |
| DDX25, HNF4A (tumor) | DDX25, HNF4A (normal) |
 |  |
| Top |
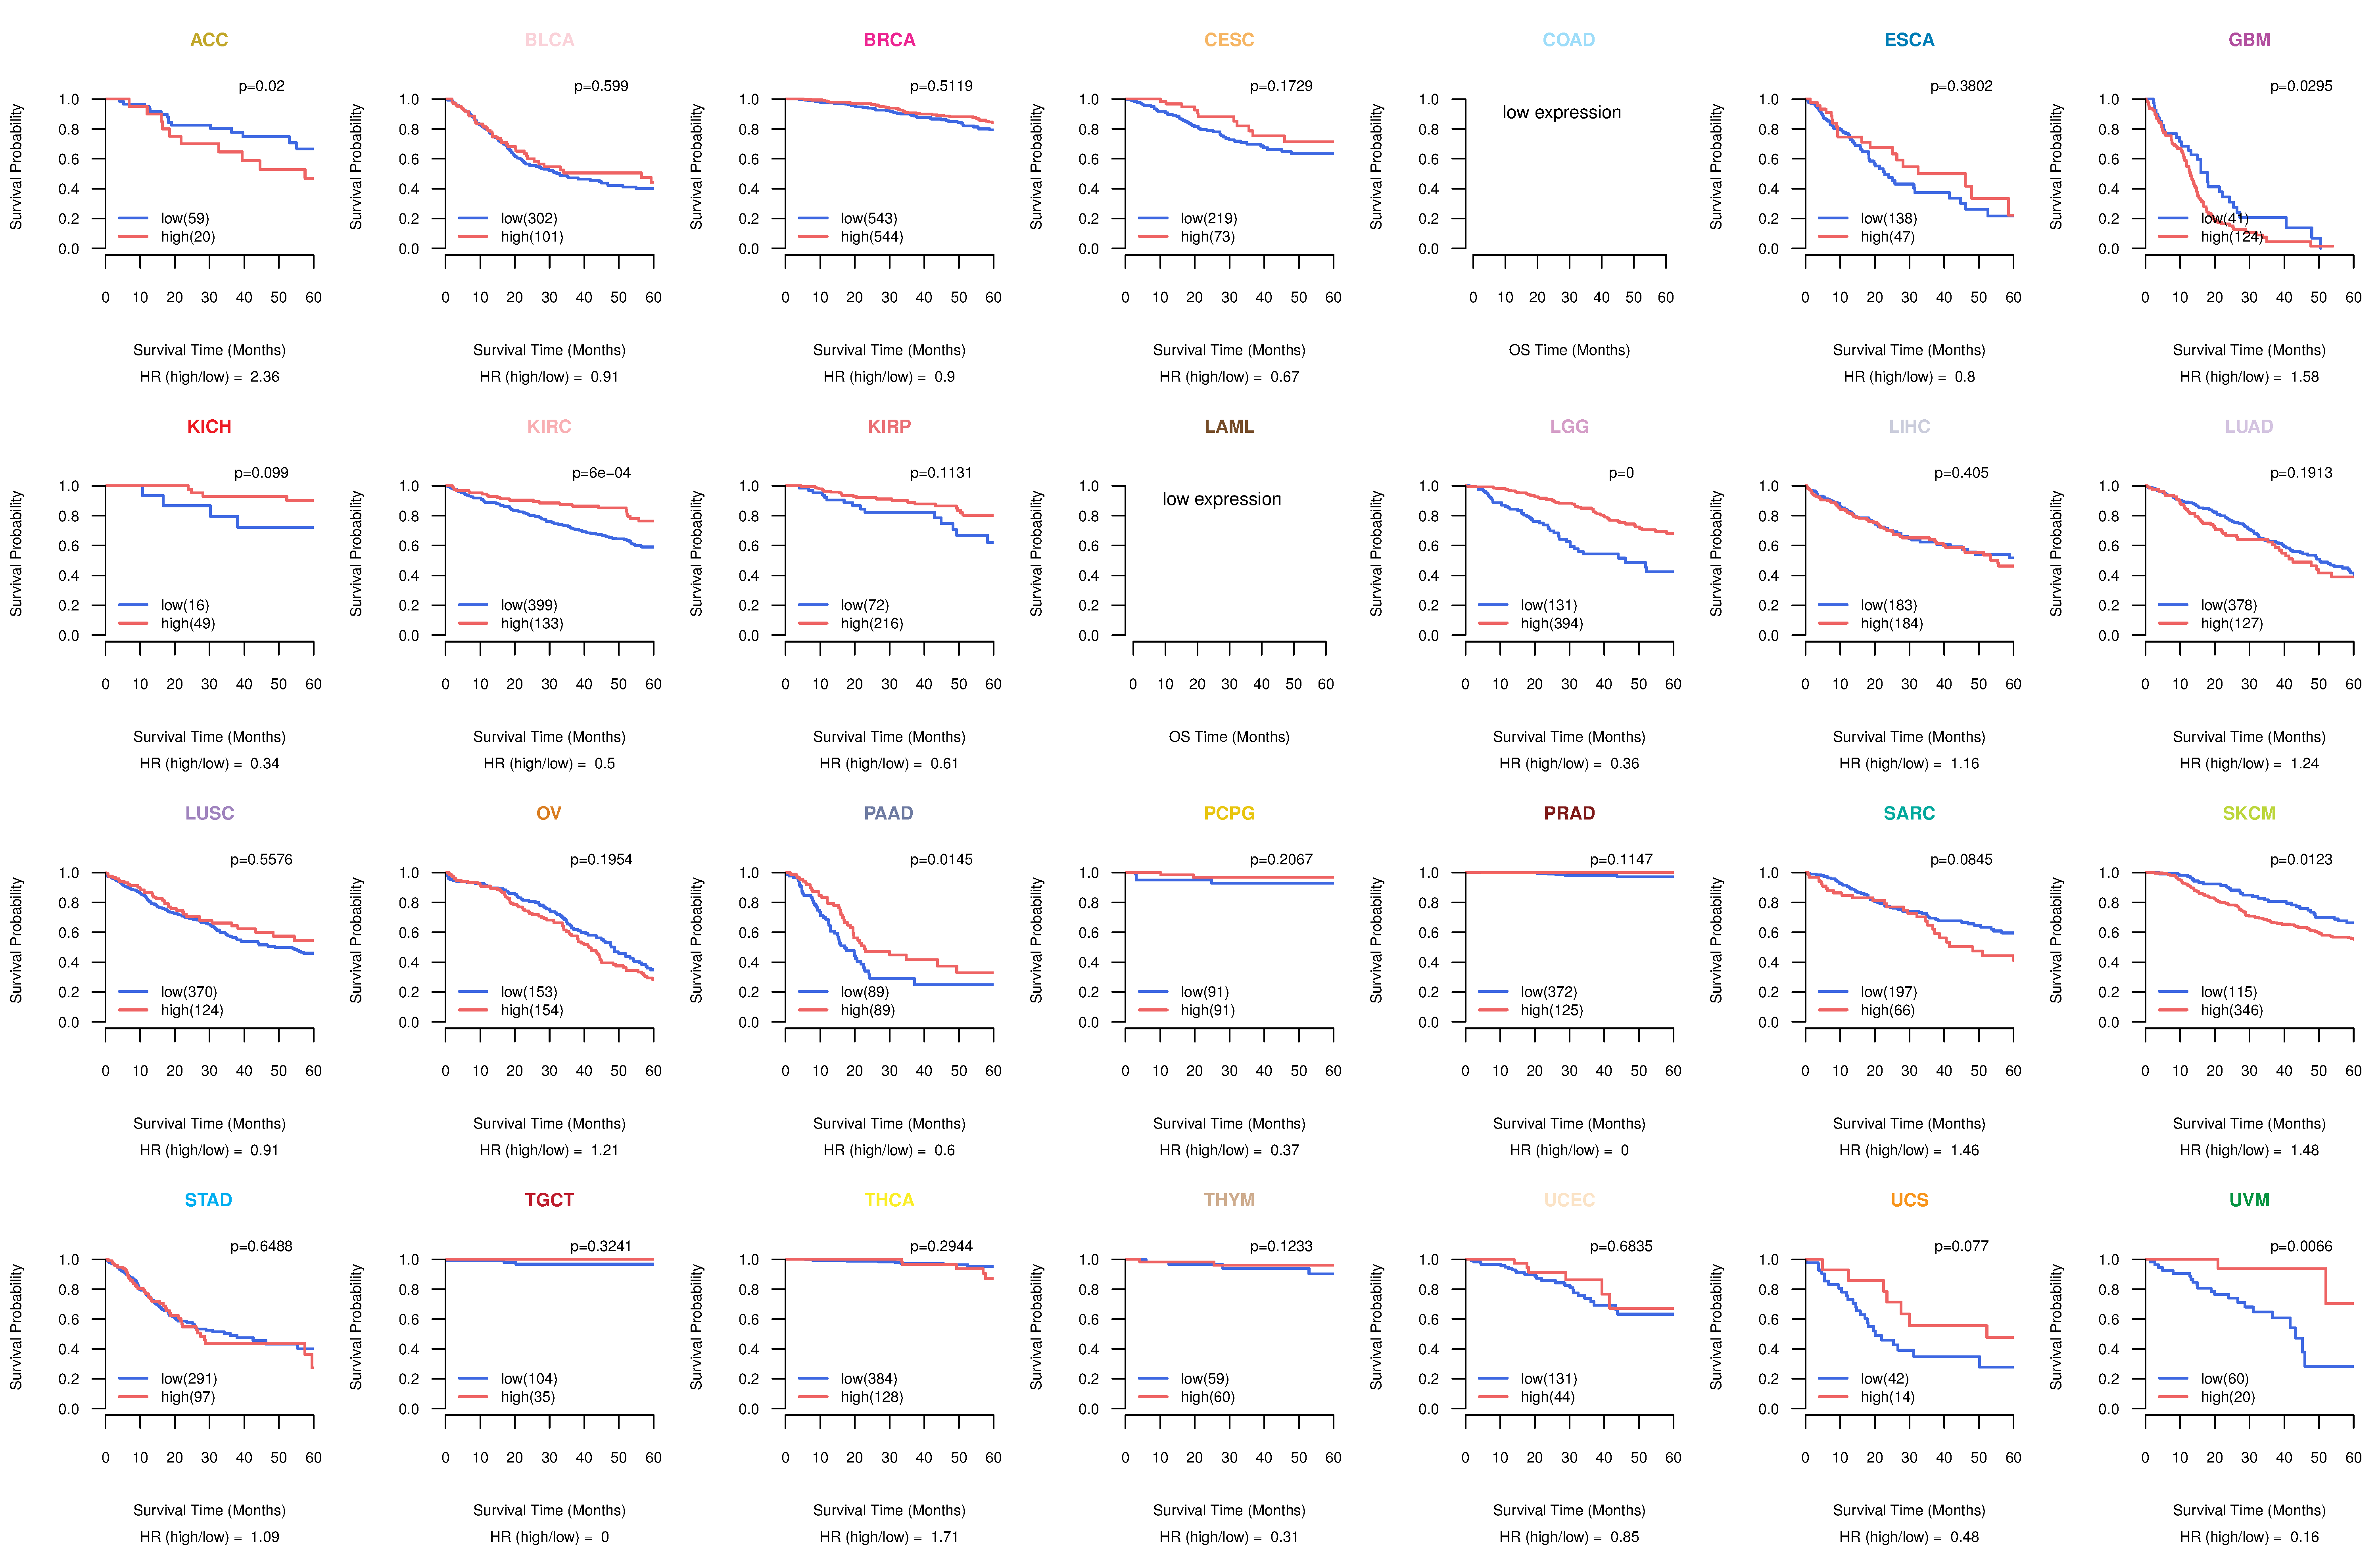
| TissGeneProg for DDX25 |
| Kaplan-Meier plots with logrank tests of overall survival (OS) using 28 cancer types (TCGA IlluminaHiSeq_RNASeqV2, pan-cancer normalized log2(norm_counts+1) data, version 2016-08-16) (TCGA clinicalMatrix, phenotype data, version 2016-04-27) * Click on the image to enlarge it in a new window. |
 |
| Kaplan-Meier plots with logrank test of relapse free survival (RFS) using 28 cancer types (TCGA IlluminaHiSeq_RNASeqV2, pan-cancer normalized log2(norm_counts+1) data, version 2016-08-16) (TCGA clinicalMatrix, phenotype data, version 2016-04-27) * Click on the image enlarge it in a new window. |
 |
| Forest plot of Cox proportional hazard ratio (HR) and 95% CI of overall survival (OS) using 28 cancer types (TCGA IlluminaHiSeq_RNASeqV2, pan-cancer normalized log2(norm_counts+1) data, version 2016-08-16) (TCGA clinicalMatrix, phenotype data, version 2016-04-27) * Click on the image enlarge it in a new window. |
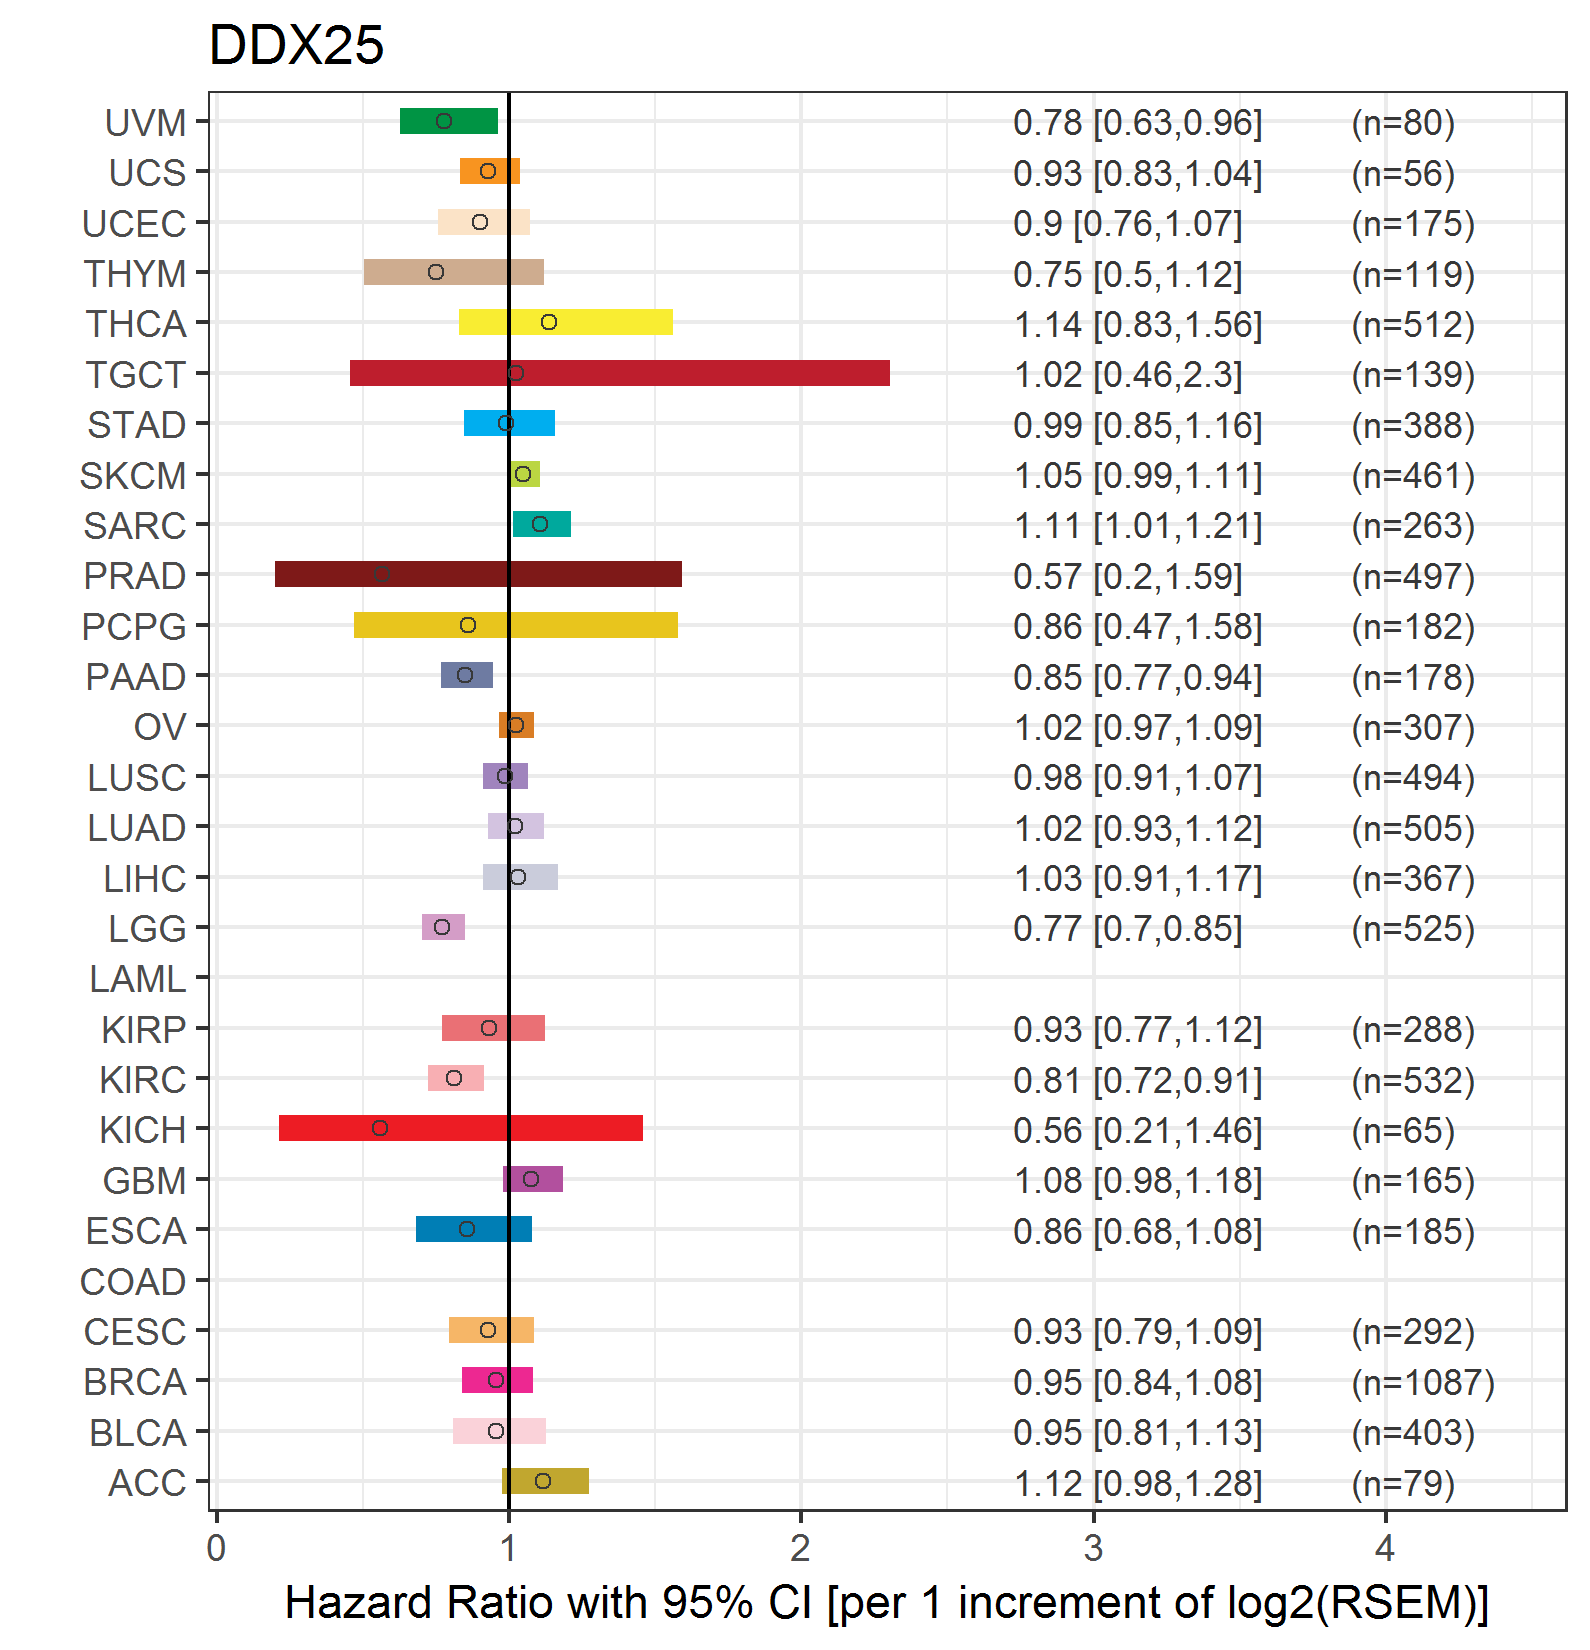 |
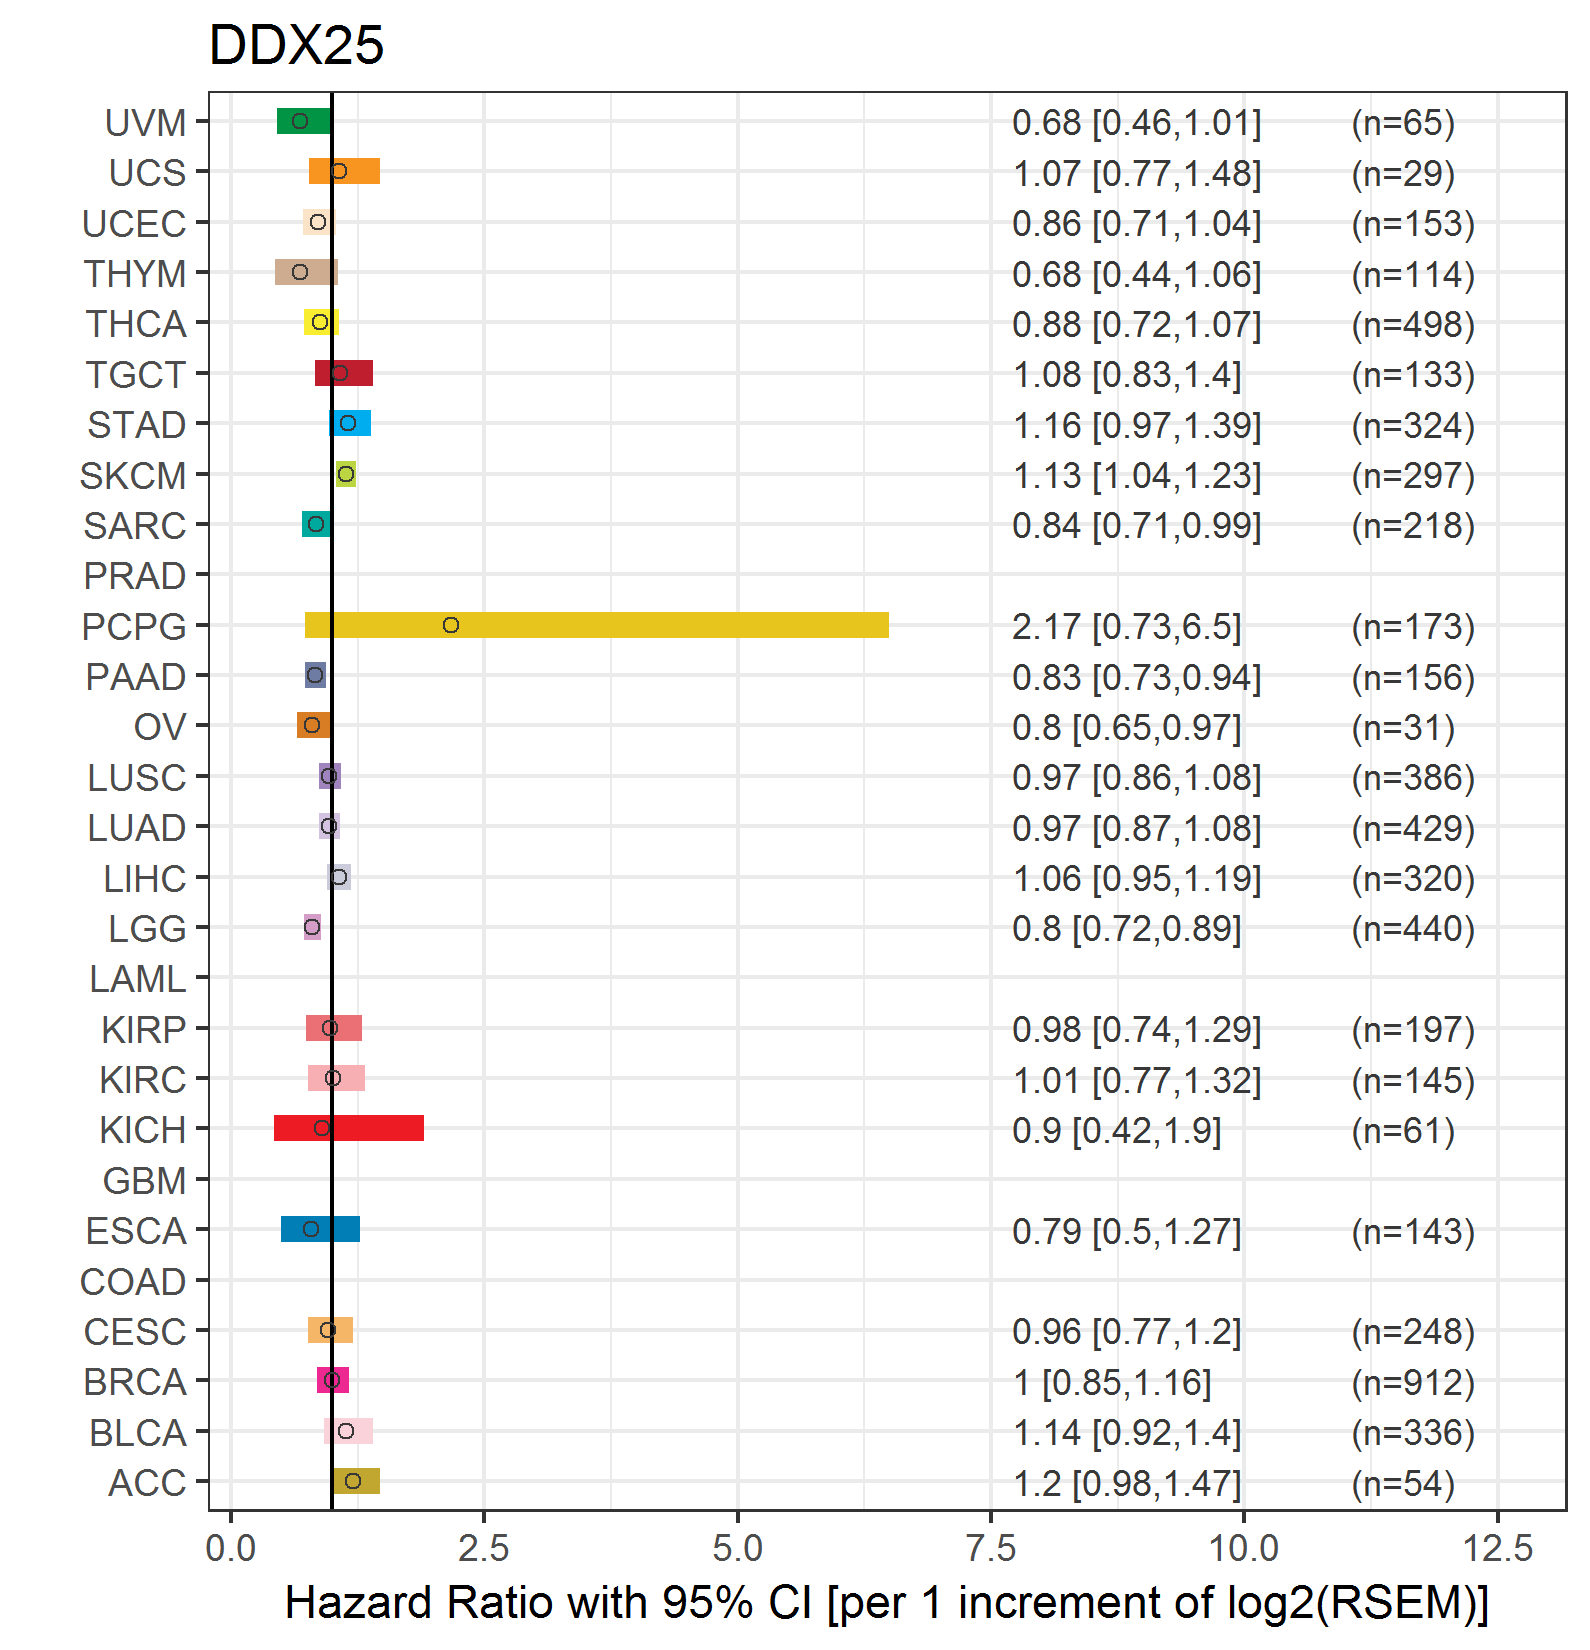
| Forest plot of Cox proportional hazard ratio (HR) and 95% CI of relapse free survival (RFS) using 28 cancer types (TCGA IlluminaHiSeq_RNASeqV2, pan-cancer normalized log2(norm_counts+1) data, version 2016-08-16) (TCGA clinicalMatrix, phenotype data, version 2016-04-27) * Click on the image enlarge it in a new window. |
 |
| Top |
| TissGeneClin for DDX25 |
| TissGeneDrug for DDX25 |
| Drug information targeting TissGene (DrugBank Version 5.0.6, 2017-04-01) |
| DrugBank ID | Drug name | Drug activity | Drug type | Drug status |
| Top |
| TissGeneDisease for DDX25 |
| Disease information associated with TissGene (DisGeNet, 2016-06-01) |
| Disease ID | Disease name | # pubmeds | Source |
| umls:C0021364 | Male infertility | 3 | BeFree |
| umls:C0004509 | Azoospermia | 2 | BeFree,GAD |
| umls:C0028960 | Oligospermia | 2 | BeFree,GAD |
| umls:C0009404 | Colorectal Neoplasms | 1 | GAD |
| umls:C0021359 | Infertility | 1 | GAD |
| umls:C2931104 | Hydrolethalus syndrome | 1 | BeFree |
| umls:C2940786 | Thyroid Hormone Resistance Syndrome | 1 | BeFree |
|
Copyright 2016-Present - The University of Texas Health Science Center at Houston (UTHealth) Web File Viewing | How to Report, Fraud, Waste and Abuse | State of Texas | Statewide Search | Texas Homeland Security | Site Policies |