 |
| |
| |
| |
| |
| |
| |
|

| TissGeneSummary for CCDC36 |
 Gene summary Gene summary |
| Basic gene information | Gene symbol | CCDC36 |
| Gene name | coiled-coil domain containing 36 | |
| Synonyms | CT74 | |
| Cytomap | UCSC genome browser: 3p21.31 | |
| Type of gene | protein-coding | |
| RefGenes | NM_001135197.1, NM_178173.3, | |
| Description | cancer/testis antigen 74coiled-coil domain-containing protein 36 | |
| Modification date | 20141207 | |
| dbXrefs | HGNC : HGNC | |
| Ensembl : ENSG00000173421 | ||
| HPRD : 14172 | ||
| Vega : OTTHUMG00000155920 | ||
| Protein | UniProt: go to UniProt's Cross Reference DB Table | |
| Expression | CleanEX: HS_CCDC36 | |
| BioGPS: 339834 | ||
| Pathway | NCI Pathway Interaction Database: CCDC36 | |
| KEGG: CCDC36 | ||
| REACTOME: CCDC36 | ||
| Pathway Commons: CCDC36 | ||
| Context | iHOP: CCDC36 | |
| ligand binding site mutation search in PubMed: CCDC36 | ||
| UCL Cancer Institute: CCDC36 | ||
| Assigned class in TissGDB* | C | |
| Included tissue-specific gene expression resources | HPA,GTEx | |
| Specific-tissues in normal samples (assigned by TissGDB using HPA, TiGER, and GTEx) | Testis | |
| Cancer types related to the specific-tissues in cancer samples (assigned by TissGDB using TCGA) | TGCT | |
| Reference showing the relevant tissue of CCDC36 | ||
| Description by TissGene annotations | ||
| * Class A consists of genes with literature evidence and is part of the cTissGenes. Class B consists of only cTissGenes without additional evidence. The remaining genes belong to Class C. |
| Gene ontology having evidence of Inferred from Direct Assay (IDA) from Entrez |
| GO ID | GO term | PubMed ID |
| Top |
| TissGeneExp for CCDC36 |
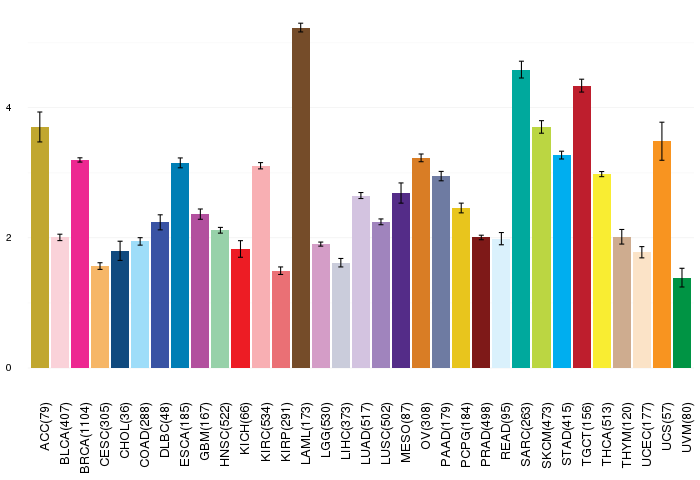
| Gene expressions across 28 cancer types (X-axis: cancer type and Y-axis: log2(norm_counts+1)) (TCGA IlluminaHiSeq_RNASeqV2, pan-cancer normalized log2(norm_counts+1) data, version 2016-08-16) |
 |
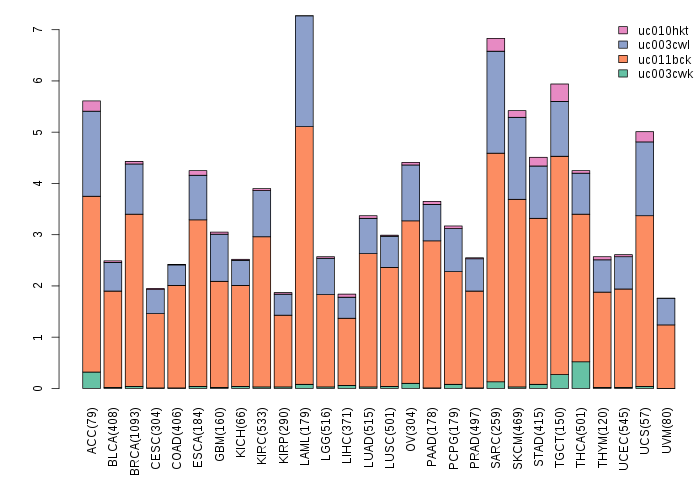
| Gene isoform expressions across 28 cancer types (X-axis: cancer type and Y-axis: log2(norm_counts+1)) (TCGA pan-cancer tcga_rsem_isoform_tpm, version 2016-09-01) |
 |
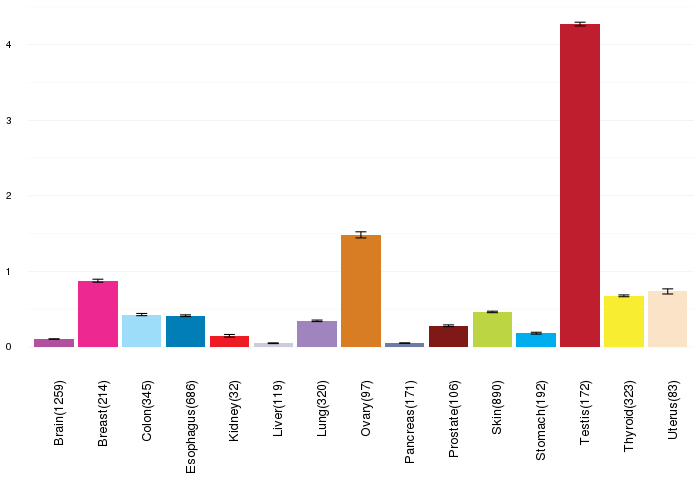
| Gene expressions across normal tissues of GTEx data (GTEx GTEx_Analysis_v6_RNA-seq_RNA-SeQCv1.1.8_gene_rpkm.gct) - Here, we shows the matched tissue types only among our 28 cancer types. |
 |
| Different expressions across 14 cancer types with more than 10 samples between matched tumors and normals (X-axis: cancer type and Y-axis: log2(norm_counts+1)) (TCGA IlluminaHiSeq_RNASeqV2, pan-cancer normalized log2(norm_counts+1) data, version 2016-08-16) |
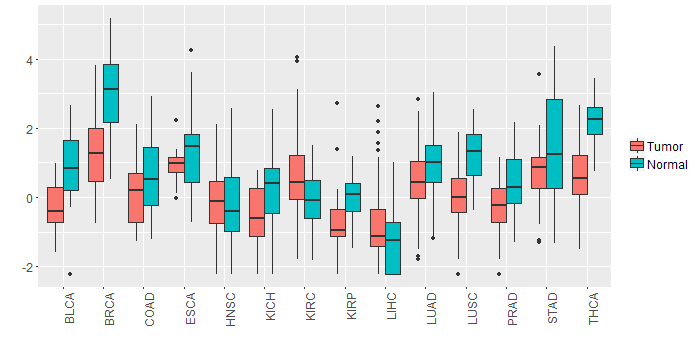 |
| - Significantly differentially expressed cancer types and information. (|Fold change|>1 and FDR<0.05) |
| Cancer type | Mean(exp) in tumor | Mean(exp) in matched normal | Log2FC | P-val. | FDR |
| BRCA | 1.269745433 | 3.04925245 | -1.779507018 | 8.17E-27 | 8.81E-26 |
| LUSC | -0.013097962 | 1.20515694 | -1.218254902 | 1.36E-10 | 5.05E-10 |
| THCA | 0.625576016 | 2.185770931 | -1.560194915 | 6.19E-20 | 2.40E-18 |
| BLCA | -0.306801058 | 0.874919994 | -1.181721053 | 0.000916 | 0.006550431 |
| Top |
| TissGene-miRNA for CCDC36 |
| Significantly anti-correlated miRNAs of TissGene across 28 cancer types (Gene-miRNA relations from TargetScanHuman Relsease 7.1, Conserved_Site_Context_Scores.txt.zip, 06.01.2016) (TCGA IlluminaHiSeq_miRNASeq, log2(RPM+1) data, version 2016-11-21) (TCGA IlluminaHiSeq_RNASeqV2, log2(normalized_count+1) data, version 2016-08-16) (Spearman’s Rank Correlation (p-value<0.05 and coefficient<-0.25)) |
| Cancer type | miRNA id | miRNA accession | P-val. | Coeff. | # samples |
| Top |
| TissGeneMut for CCDC36 |
| TissGeneSNV for CCDC36 |
| nsSNV counts per each loci. Different colors of circles represent different cancer types. Circle size denotes number of samples. (TCGA somatic mutation (SNPs and small INDELs) data, version 2016-04-25) * Click on the image to enlarge it in a new window. |
 |
 |
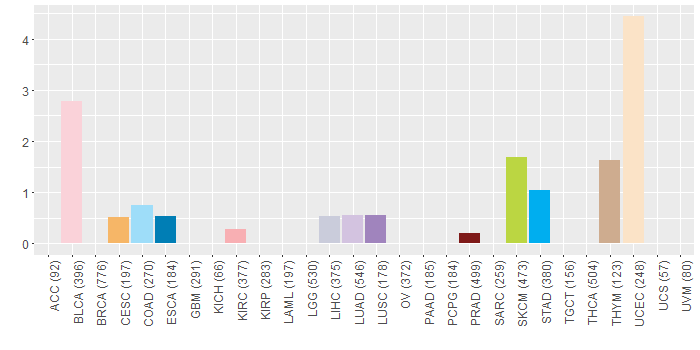
| Somatic nucleotide variants of TissGene across 28 cancer types (X-axis: cancer type and Y-axis: % of mutated samples) The numbers in parentheses are numbers of samples with mutation (nsSNVs). (TCGA somatic mutation (SNPs and small INDELs) data, version 2016-04-25) |
 |
| - nsSNVs sorted by frequency. |
| AAchange | Cancer type | # samples |
| p.R209I | UCEC | 3 |
| p.D591H | BLCA | 1 |
| p.A325S | UCEC | 1 |
| p.E435X | THYM | 1 |
| p.K9* | BLCA | 1 |
| p.R532I | UCEC | 1 |
| p.A334S | THYM | 1 |
| p.V374I | COAD | 1 |
| p.K470T | UCEC | 1 |
| p.D187N | SKCM | 1 |
| p.K578E | STAD | 1 |
| p.W26* | SKCM | 1 |
| p.P105S | HNSC | 1 |
| p.R259K | HNSC | 1 |
| p.P522H | UCEC | 1 |
| p.S170Y | UCEC | 1 |
| p.P465T | SKCM | 1 |
| p.K574N | SKCM | 1 |
| p.W26X | SKCM | 1 |
| p.F471L | UCEC | 1 |
| p.D60N | UCEC | 1 |
| p.T84K | ESCA | 1 |
| p.P465L | SKCM | 1 |
| p.W306R | LIHC | 1 |
| p.K293E | BLCA | 1 |
| p.D587H | HNSC | 1 |
| p.L160V | BLCA | 1 |
| p.S548P | PRAD | 1 |
| p.L281F | SKCM | 1 |
| p.D583N | BLCA | 1 |
| p.W6C | BLCA | 1 |
| p.N223D | HNSC | 1 |
| p.E205D | BLCA | 1 |
| p.S163I | LUAD | 1 |
| p.E332Q | HNSC | 1 |
| p.D431N | SKCM | 1 |
| p.Q234H | CESC | 1 |
| p.M416I | LIHC | 1 |
| p.R209I | STAD | 1 |
| p.L502M | COAD | 1 |
| p.R135H | UCEC | 1 |
| p.Q247P | KIRC | 1 |
| p.S170Y | READ | 1 |
| p.A299D | LUSC | 1 |
| p.E317* | UCEC | 1 |
| p.E120K | SKCM | 1 |
| p.S540Y | LUAD | 1 |
| p.Q476* | BLCA | 1 |
| p.S18F | BLCA | 1 |
| p.F318C | BLCA | 1 |
| p.S271F | BLCA | 1 |
| p.Q234P | STAD | 1 |
| p.E317* | LUAD | 1 |
| p.R437Q | STAD | 1 |
| p.A184T | SKCM | 1 |
| p.C357Y | UCEC | 1 |
| p.S16* | BLCA | 1 |
| Top |
| TissGeneCNV for CCDC36 |
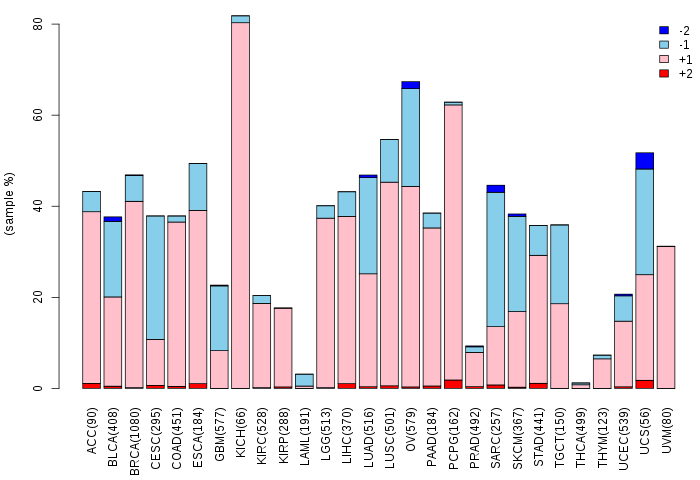
| Copy number variations of TissGene across 28 cancer types (X-axis: cancer type and Y-axis: % of CNV samples) (TCGA Gistic2_CopyNumber_Gistic2_all_data_by_genes, Gistic2 copy number data, version 2016-08-16) |
 |
| Top |
| TissGeneFusions for CCDC36 |
| Fusion genes including TissGene (ChimerDB 3.0, 2016-12-01 and TCGA fusion Portal 2015-12-01) |
| Database | Src | Cancer type | Sample | Fusion gene | ORF | 5'-gene BP | 3'-gene BP |
| Chimerdb3.0 | ChiTaRs | NA | BU727928 | CCDC36-PRELP | chr3:49283627 | chr1:203452298 | |
| Chimerdb3.0 | ChiTaRs | NA | BF576138 | CCDC36-NMNAT3 | chr3:49237006 | chr3:139279664 | |
| Chimerdb3.0 | ChiTaRs | NA | BM686368 | PRELP-CCDC36 | chr1:203452459 | chr3:49282867 | |
| Chimerdb3.0 | ChiTaRs | NA | AA913200 | NFE2L1-CCDC36 | chr17:46134833 | chr3:49280534 |
| Top |
| TissGeneNet for CCDC36 |
| Co-expressed gene networks based on protein-protein interaction data (CePIN) (TCGA IlluminaHiSeq_RNASeqV2, pan-cancer normalized log2(norm_counts+1) data, version 2016-08-16) (PINA2 ppi data) |
| Top |
| TissGeneProg for CCDC36 |
| Kaplan-Meier plots with logrank tests of overall survival (OS) using 28 cancer types (TCGA IlluminaHiSeq_RNASeqV2, pan-cancer normalized log2(norm_counts+1) data, version 2016-08-16) (TCGA clinicalMatrix, phenotype data, version 2016-04-27) * Click on the image to enlarge it in a new window. |
 |
| Kaplan-Meier plots with logrank test of relapse free survival (RFS) using 28 cancer types (TCGA IlluminaHiSeq_RNASeqV2, pan-cancer normalized log2(norm_counts+1) data, version 2016-08-16) (TCGA clinicalMatrix, phenotype data, version 2016-04-27) * Click on the image enlarge it in a new window. |
 |
| Forest plot of Cox proportional hazard ratio (HR) and 95% CI of overall survival (OS) using 28 cancer types (TCGA IlluminaHiSeq_RNASeqV2, pan-cancer normalized log2(norm_counts+1) data, version 2016-08-16) (TCGA clinicalMatrix, phenotype data, version 2016-04-27) * Click on the image enlarge it in a new window. |
 |
| Forest plot of Cox proportional hazard ratio (HR) and 95% CI of relapse free survival (RFS) using 28 cancer types (TCGA IlluminaHiSeq_RNASeqV2, pan-cancer normalized log2(norm_counts+1) data, version 2016-08-16) (TCGA clinicalMatrix, phenotype data, version 2016-04-27) * Click on the image enlarge it in a new window. |
 |
| Top |
| TissGeneClin for CCDC36 |
| TissGeneDrug for CCDC36 |
| Drug information targeting TissGene (DrugBank Version 5.0.6, 2017-04-01) |
| DrugBank ID | Drug name | Drug activity | Drug type | Drug status |
| Top |
| TissGeneDisease for CCDC36 |
| Disease information associated with TissGene (DisGeNet, 2016-06-01) |
| Disease ID | Disease name | # pubmeds | Source |
|
Copyright 2016-Present - The University of Texas Health Science Center at Houston (UTHealth) Web File Viewing | How to Report, Fraud, Waste and Abuse | State of Texas | Statewide Search | Texas Homeland Security | Site Policies |