 |
| |
| |
| |
| |
| |
| |
|

| TissGeneSummary for ITIH1 |
 Gene summary Gene summary |
| Basic gene information | Gene symbol | ITIH1 |
| Gene name | inter-alpha-trypsin inhibitor heavy chain 1 | |
| Synonyms | H1P|IATIH|IGHEP1|ITI-HC1|ITIH|SHAP | |
| Cytomap | UCSC genome browser: 3p21.1 | |
| Type of gene | protein-coding | |
| RefGenes | NM_001166434.2, NM_001166435.2,NM_001166436.2,NM_002215.3, | |
| Description | ITI heavy chain H1inter-alpha (globulin) inhibitor H1inter-alpha (globulin) inhibitor, H1 polypeptideinter-alpha-inhibitor heavy chain 1inter-alpha-trypsin inhibitor complex component IIIinter-alpha-trypsin inhibitor heavy chain H1serum-derived hyal | |
| Modification date | 20141207 | |
| dbXrefs | MIM : 147270 | |
| HGNC : HGNC | ||
| Ensembl : ENSG00000055957 | ||
| HPRD : 00927 | ||
| Vega : OTTHUMG00000150312 | ||
| Protein | UniProt: go to UniProt's Cross Reference DB Table | |
| Expression | CleanEX: HS_ITIH1 | |
| BioGPS: 3697 | ||
| Pathway | NCI Pathway Interaction Database: ITIH1 | |
| KEGG: ITIH1 | ||
| REACTOME: ITIH1 | ||
| Pathway Commons: ITIH1 | ||
| Context | iHOP: ITIH1 | |
| ligand binding site mutation search in PubMed: ITIH1 | ||
| UCL Cancer Institute: ITIH1 | ||
| Assigned class in TissGDB* | B | |
| Included tissue-specific gene expression resources | HPA,TiGER,GTEx | |
| Specific-tissues in normal samples (assigned by TissGDB using HPA, TiGER, and GTEx) | Liver | |
| Cancer types related to the specific-tissues in cancer samples (assigned by TissGDB using TCGA) | LIHC | |
| Reference showing the relevant tissue of ITIH1 | ||
| Description by TissGene annotations | Cancer gene TissgsKTS | |
| * Class A consists of genes with literature evidence and is part of the cTissGenes. Class B consists of only cTissGenes without additional evidence. The remaining genes belong to Class C. |
| Gene ontology having evidence of Inferred from Direct Assay (IDA) from Entrez |
| GO ID | GO term | PubMed ID |
| Top |
| TissGeneExp for ITIH1 |
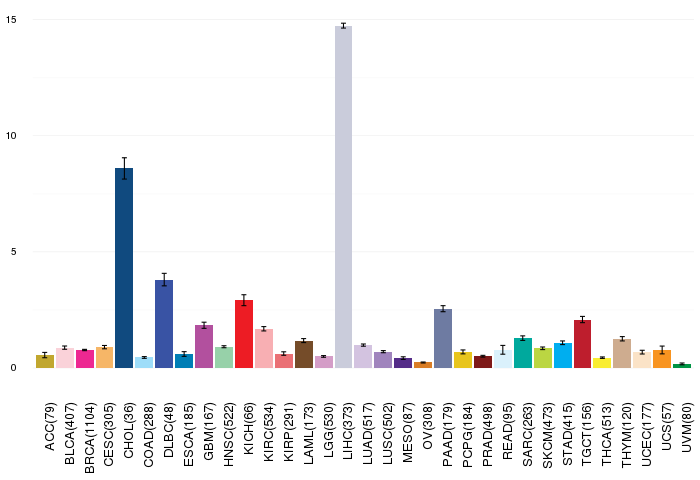
| Gene expressions across 28 cancer types (X-axis: cancer type and Y-axis: log2(norm_counts+1)) (TCGA IlluminaHiSeq_RNASeqV2, pan-cancer normalized log2(norm_counts+1) data, version 2016-08-16) |
 |
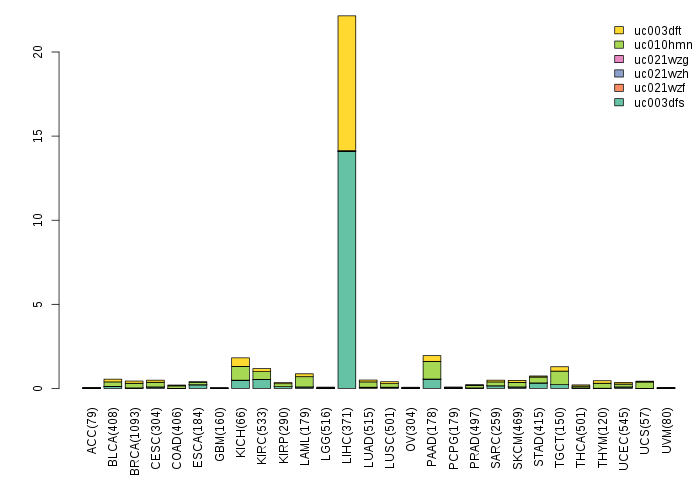
| Gene isoform expressions across 28 cancer types (X-axis: cancer type and Y-axis: log2(norm_counts+1)) (TCGA pan-cancer tcga_rsem_isoform_tpm, version 2016-09-01) |
 |
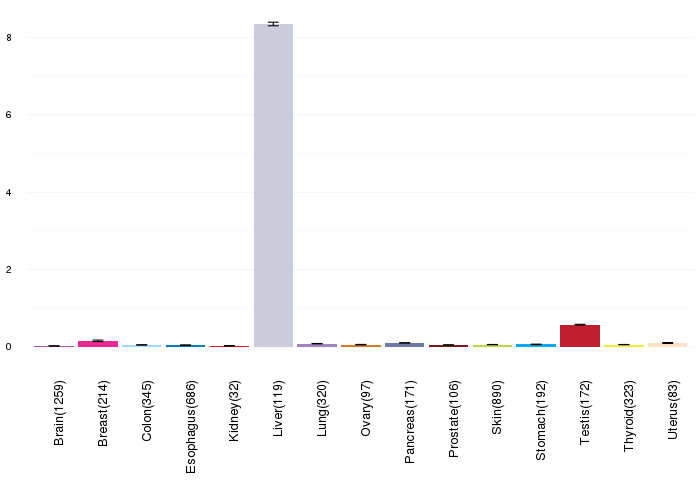
| Gene expressions across normal tissues of GTEx data (GTEx GTEx_Analysis_v6_RNA-seq_RNA-SeQCv1.1.8_gene_rpkm.gct) - Here, we shows the matched tissue types only among our 28 cancer types. |
 |
| Different expressions across 14 cancer types with more than 10 samples between matched tumors and normals (X-axis: cancer type and Y-axis: log2(norm_counts+1)) (TCGA IlluminaHiSeq_RNASeqV2, pan-cancer normalized log2(norm_counts+1) data, version 2016-08-16) |
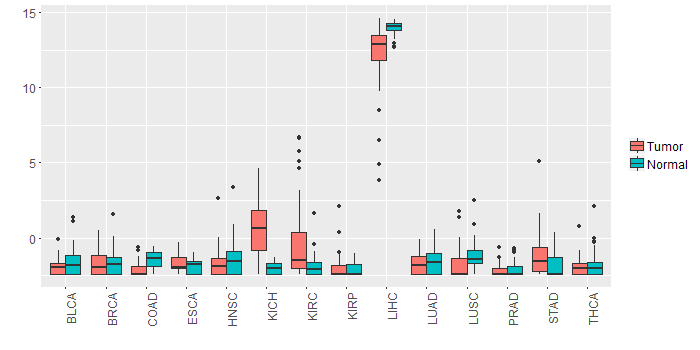 |
| - Significantly differentially expressed cancer types and information. (|Fold change|>1 and FDR<0.05) |
| Cancer type | Mean(exp) in tumor | Mean(exp) in matched normal | Log2FC | P-val. | FDR |
| KIRC | -0.489430304 | -1.914451137 | 1.425020833 | 3.77E-06 | 9.16E-06 |
| LIHC | 12.16220325 | 13.96388725 | -1.801684 | 6.25E-07 | 3.51E-06 |
| KICH | 0.481325252 | -1.994906748 | 2.476232 | 3.47E-07 | 1.42E-06 |
| Top |
| TissGene-miRNA for ITIH1 |
| Significantly anti-correlated miRNAs of TissGene across 28 cancer types (Gene-miRNA relations from TargetScanHuman Relsease 7.1, Conserved_Site_Context_Scores.txt.zip, 06.01.2016) (TCGA IlluminaHiSeq_miRNASeq, log2(RPM+1) data, version 2016-11-21) (TCGA IlluminaHiSeq_RNASeqV2, log2(normalized_count+1) data, version 2016-08-16) (Spearman’s Rank Correlation (p-value<0.05 and coefficient<-0.25)) |
| Cancer type | miRNA id | miRNA accession | P-val. | Coeff. | # samples |
| Top |
| TissGeneMut for ITIH1 |
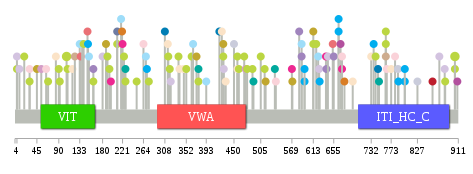
| TissGeneSNV for ITIH1 |
| nsSNV counts per each loci. Different colors of circles represent different cancer types. Circle size denotes number of samples. (TCGA somatic mutation (SNPs and small INDELs) data, version 2016-04-25) * Click on the image to enlarge it in a new window. |
 |
 |
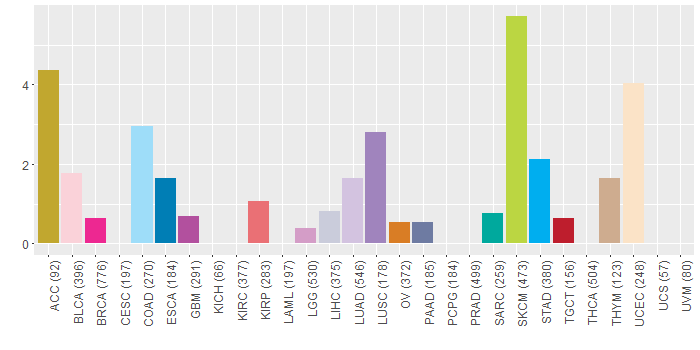
| Somatic nucleotide variants of TissGene across 28 cancer types (X-axis: cancer type and Y-axis: % of mutated samples) The numbers in parentheses are numbers of samples with mutation (nsSNVs). (TCGA somatic mutation (SNPs and small INDELs) data, version 2016-04-25) |
 |
| - nsSNVs sorted by frequency. |
| AAchange | Cancer type | # samples |
| p.G106R | SKCM | 2 |
| p.D904N | SKCM | 2 |
| p.E84K | UCEC | 1 |
| p.V420I | ESCA | 1 |
| p.A314T | UCEC | 1 |
| p.P694S | UCEC | 1 |
| p.N275T | SKCM | 1 |
| p.Q474E | LGG | 1 |
| p.Q161* | SKCM | 1 |
| p.Q338H | UCEC | 1 |
| p.R65C | READ | 1 |
| p.F536L | BLCA | 1 |
| p.Q242L | MESO | 1 |
| p.K180E | LUAD | 1 |
| p.E505K | SKCM | 1 |
| p.I373T | ACC | 1 |
| p.H68Y | SKCM | 1 |
| p.D672H | BLCA | 1 |
| p.S30L | SKCM | 1 |
| p.A131T | READ | 1 |
| p.G320V | LUAD | 1 |
| p.N737S | STAD | 1 |
| p.P429T | LUAD | 1 |
| p.T269M | COAD | 1 |
| p.G227E | SARC | 1 |
| p.D909N | GBM | 1 |
| p.E460K | SKCM | 1 |
| p.T220S | OV | 1 |
| p.G471S | SKCM | 1 |
| p.T570I | ACC | 1 |
| p.G377E | SKCM | 1 |
| p.E318K | SKCM | 1 |
| p.R271H | READ | 1 |
| p.R665X | STAD | 1 |
| p.W764* | BLCA | 1 |
| p.K781N | BLCA | 1 |
| p.L271M | STAD | 1 |
| p.T118I | UCEC | 1 |
| p.S210A | PAAD | 1 |
| p.G613V | ACC | 1 |
| p.E584K | LUSC | 1 |
| p.F762V | THYM | 1 |
| p.P4S | SKCM | 1 |
| p.Q772L | DLBC | 1 |
| p.G619S | SKCM | 1 |
| p.Q19X | SKCM | 1 |
| p.G613S | SKCM | 1 |
| p.F190I | SKCM | 1 |
| p.T428I | ACC | 1 |
| p.R425W | UCEC | 1 |
| p.V187L | ACC | 1 |
| p.S30L | BLCA | 1 |
| p.R665* | STAD | 1 |
| p.S655T | LUSC | 1 |
| p.S108F | SKCM | 1 |
| p.D904E | SKCM | 1 |
| p.D488N | SKCM | 1 |
| p.L150I | STAD | 1 |
| p.P606H | READ | 1 |
| p.R54Q | LGG | 1 |
| p.G377R | SARC | 1 |
| p.K57T | CHOL | 1 |
| p.K626N | STAD | 1 |
| p.R218Q | COAD | 1 |
| p.R457K | SKCM | 1 |
| p.I677T | OV | 1 |
| p.V669_splice | GBM | 1 |
| p.A883S | LUAD | 1 |
| p.R801X | STAD | 1 |
| p.Q161H | LUSC | 1 |
| p.E366D | COAD | 1 |
| p.R623M | COAD | 1 |
| p.V746L | ESCA | 1 |
| p.G227E | SKCM | 1 |
| p.L433M | UCEC | 1 |
| p.R422C | READ | 1 |
| p.G589R | COAD | 1 |
| p.R659Q | READ | 1 |
| p.E884K | SKCM | 1 |
| p.A4S | LUAD | 1 |
| p.F643L | LUAD | 1 |
| p.L135I | KIRP | 1 |
| p.L589M | LUSC | 1 |
| p.L352P | SKCM | 1 |
| p.R315K | SKCM | 1 |
| p.V45L | ACC | 1 |
| p.S64F | BLCA | 1 |
| p.P748L | SARC | 1 |
| p.R457I | UCEC | 1 |
| p.E450G | LIHC | 1 |
| p.L210P | SKCM | 1 |
| p.Q534* | SARC | 1 |
| p.D672E | BRCA | 1 |
| p.L381F | DLBC | 1 |
| p.D762E | SKCM | 1 |
| p.S250F | SKCM | 1 |
| p.E363K | SKCM | 1 |
| p.M858I | TGCT | 1 |
| p.R141K | SKCM | 1 |
| p.H149R | KIRP | 1 |
| p.F428C | SKCM | 1 |
| p.T653N | KIRP | 1 |
| p.G513R | SKCM | 1 |
| p.R732W | UCEC | 1 |
| p.V787A | LIHC | 1 |
| p.R264P | BLCA | 1 |
| p.G477S | SKCM | 1 |
| p.E90K | SKCM | 1 |
| p.T827A | LIHC | 1 |
| p.D625N | LUAD | 1 |
| p.G9R | LUAD | 1 |
| p.R801* | STAD | 1 |
| p.Q595X | STAD | 1 |
| p.D490N | SARC | 1 |
| p.F138I | COAD | 1 |
| p.D741N | SKCM | 1 |
| p.V308M | ESCA | 1 |
| p.Y123C | THYM | 1 |
| p.S788F | STAD | 1 |
| p.D762N | SKCM | 1 |
| p.P639H | BRCA | 1 |
| p.D773Y | UCEC | 1 |
| p.I515T | ACC | 1 |
| p.R801Q | HNSC | 1 |
| p.E393X | COAD | 1 |
| p.A347S | UCEC | 1 |
| p.P92S | SKCM | 1 |
| p.S224F | SKCM | 1 |
| p.R194X | SKCM | 1 |
| p.L569V | BRCA | 1 |
| p.A133V | COAD | 1 |
| p.I221M | BRCA | 1 |
| p.R336* | SKCM | 1 |
| p.Q872* | LUAD | 1 |
| p.V152F | COAD | 1 |
| p.R197Q | BRCA | 1 |
| p.Q595* | STAD | 1 |
| p.R514H | HNSC | 1 |
| p.R640T | LUSC | 1 |
| p.F138L | READ | 1 |
| Top |
| TissGeneCNV for ITIH1 |
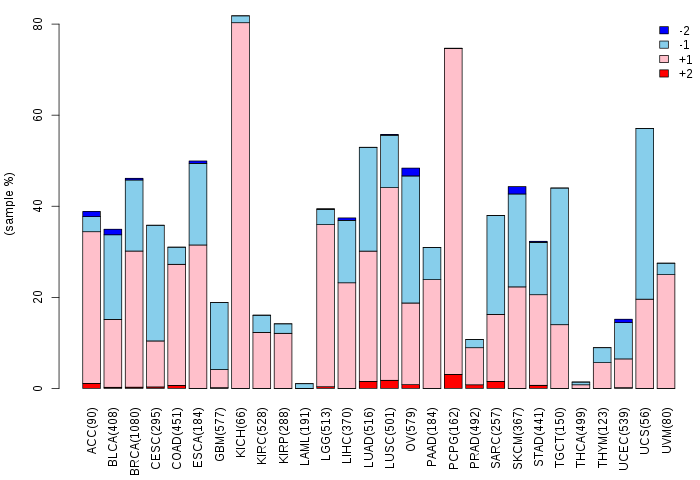
| Copy number variations of TissGene across 28 cancer types (X-axis: cancer type and Y-axis: % of CNV samples) (TCGA Gistic2_CopyNumber_Gistic2_all_data_by_genes, Gistic2 copy number data, version 2016-08-16) |
 |
| Top |
| TissGeneFusions for ITIH1 |
| Fusion genes including TissGene (ChimerDB 3.0, 2016-12-01 and TCGA fusion Portal 2015-12-01) |
| Database | Src | Cancer type | Sample | Fusion gene | ORF | 5'-gene BP | 3'-gene BP |
| Top |
| TissGeneNet for ITIH1 |
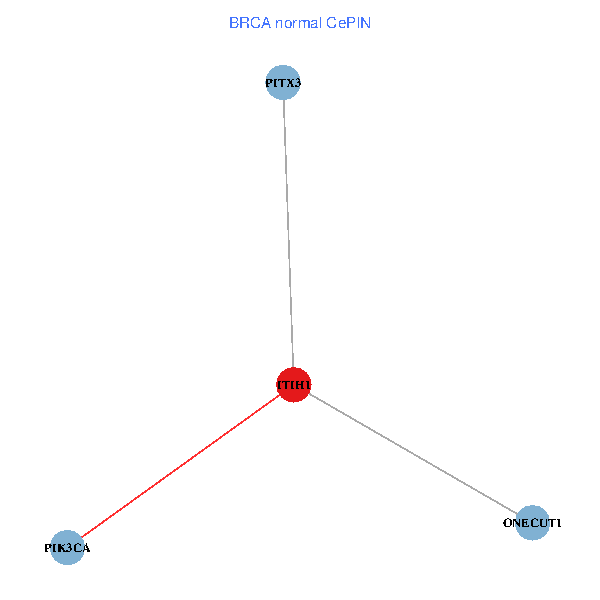
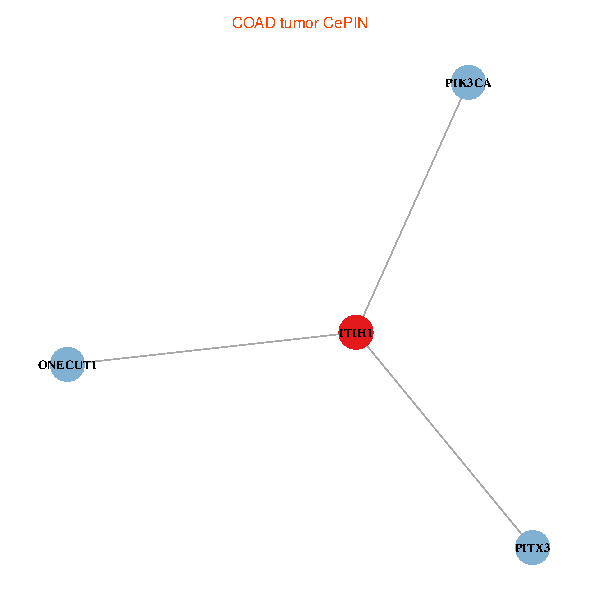
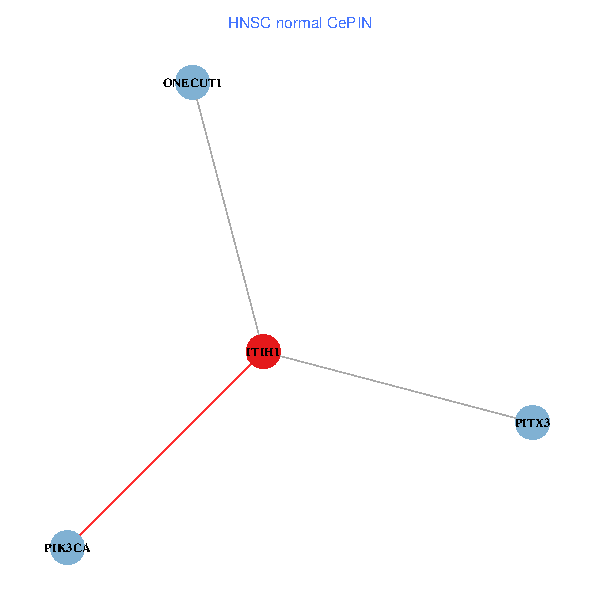
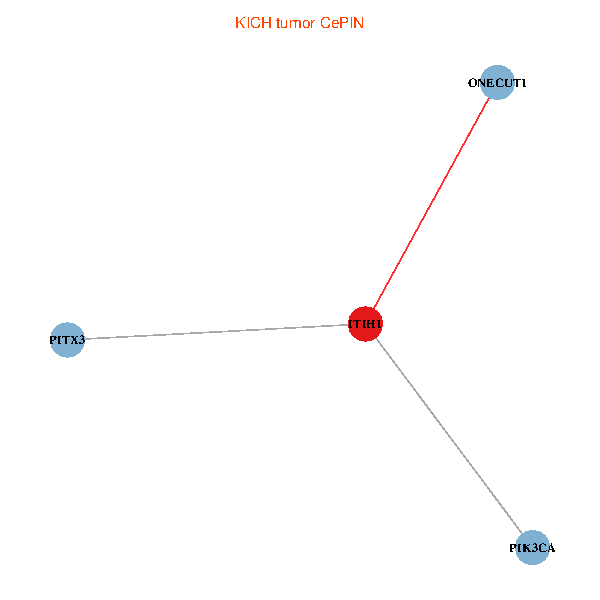
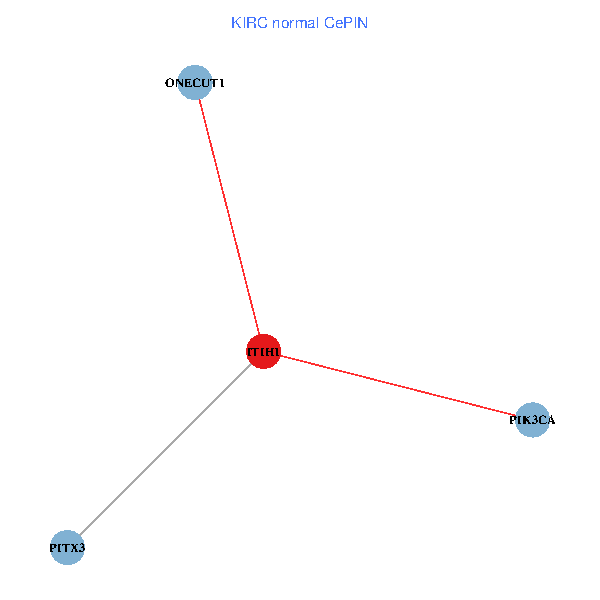
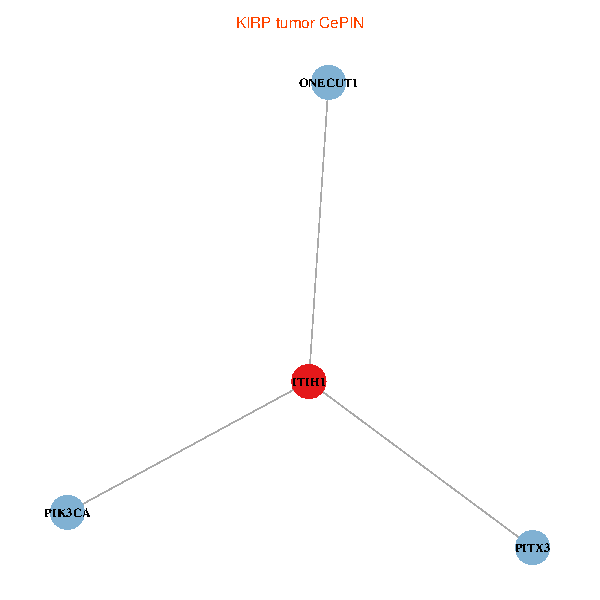
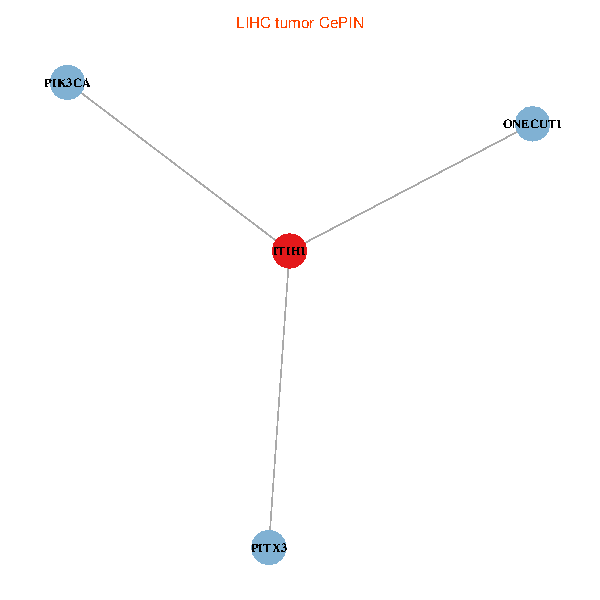
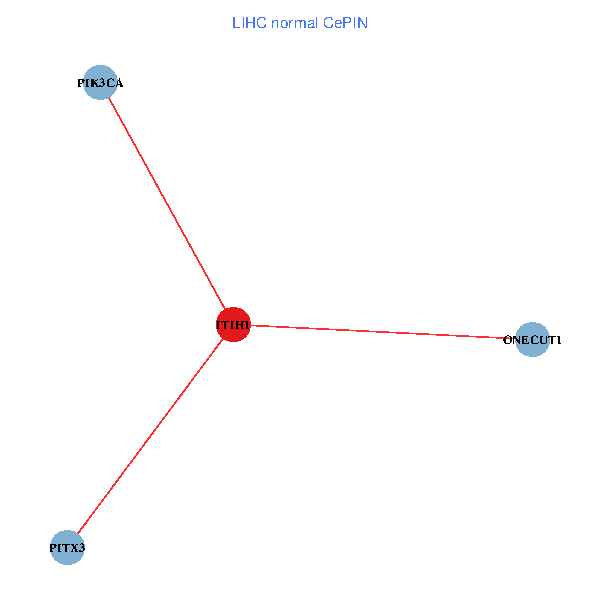
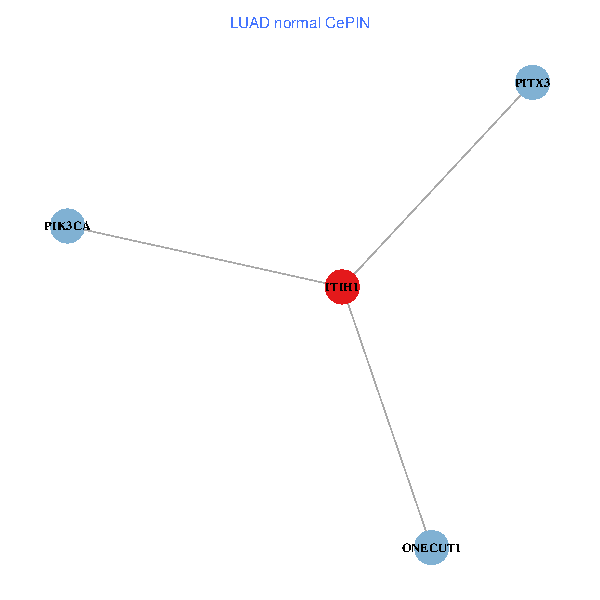
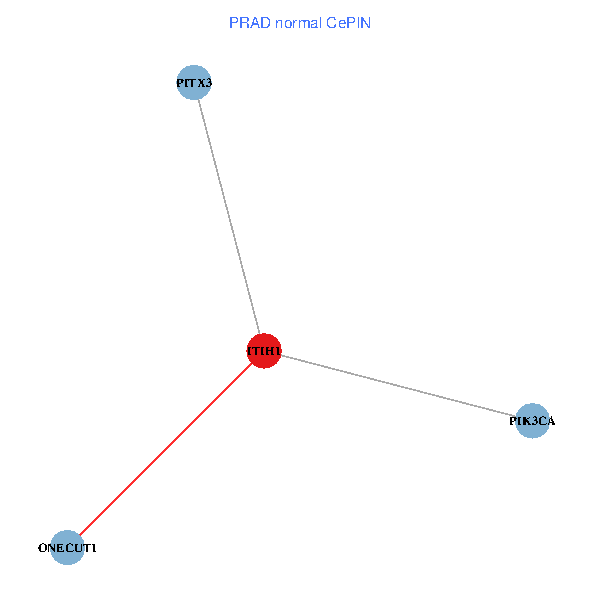
| Co-expressed gene networks based on protein-protein interaction data (CePIN) (TCGA IlluminaHiSeq_RNASeqV2, pan-cancer normalized log2(norm_counts+1) data, version 2016-08-16) (PINA2 ppi data) |
| BRCA (tumor) | BRCA (normal) |
| ITIH1, ONECUT1, PITX3, PIK3CA (tumor) | ITIH1, ONECUT1, PITX3, PIK3CA (normal) |
 |  |
| COAD (tumor) | COAD (normal) |
| ITIH1, ONECUT1, PITX3, PIK3CA (tumor) | ITIH1, ONECUT1, PITX3, PIK3CA (normal) |
 |  |
| HNSC (tumor) | HNSC (normal) |
| ITIH1, ONECUT1, PITX3, PIK3CA (tumor) | ITIH1, ONECUT1, PITX3, PIK3CA (normal) |
 |  |
| KICH (tumor) | KICH (normal) |
| ITIH1, ONECUT1, PITX3, PIK3CA (tumor) | ITIH1, ONECUT1, PITX3, PIK3CA (normal) |
 |  |
| KIRC (tumor) | KIRC (normal) |
| ITIH1, ONECUT1, PITX3, PIK3CA (tumor) | ITIH1, ONECUT1, PITX3, PIK3CA (normal) |
 |  |
| KIRP (tumor) | KIRP (normal) |
| ITIH1, ONECUT1, PITX3, PIK3CA (tumor) | ITIH1, ONECUT1, PITX3, PIK3CA (normal) |
 |  |
| LIHC (tumor) | LIHC (normal) |
| ITIH1, ONECUT1, PITX3, PIK3CA (tumor) | ITIH1, ONECUT1, PITX3, PIK3CA (normal) |
 |  |
| LUAD (tumor) | LUAD (normal) |
| ITIH1, ONECUT1, PITX3, PIK3CA (tumor) | ITIH1, ONECUT1, PITX3, PIK3CA (normal) |
 |  |
| LUSC (tumor) | LUSC (normal) |
| ITIH1, ONECUT1, PITX3, PIK3CA (tumor) | ITIH1, ONECUT1, PITX3, PIK3CA (normal) |
 |  |
| PRAD (tumor) | PRAD (normal) |
| ITIH1, ONECUT1, PITX3, PIK3CA (tumor) | ITIH1, ONECUT1, PITX3, PIK3CA (normal) |
 |  |
| STAD (tumor) | STAD (normal) |
| ITIH1, ONECUT1, PITX3, PIK3CA (tumor) | ITIH1, ONECUT1, PITX3, PIK3CA (normal) |
 |  |
| THCA (tumor) | THCA (normal) |
| ITIH1, ONECUT1, PITX3, PIK3CA (tumor) | ITIH1, ONECUT1, PITX3, PIK3CA (normal) |
 |  |
| Top |
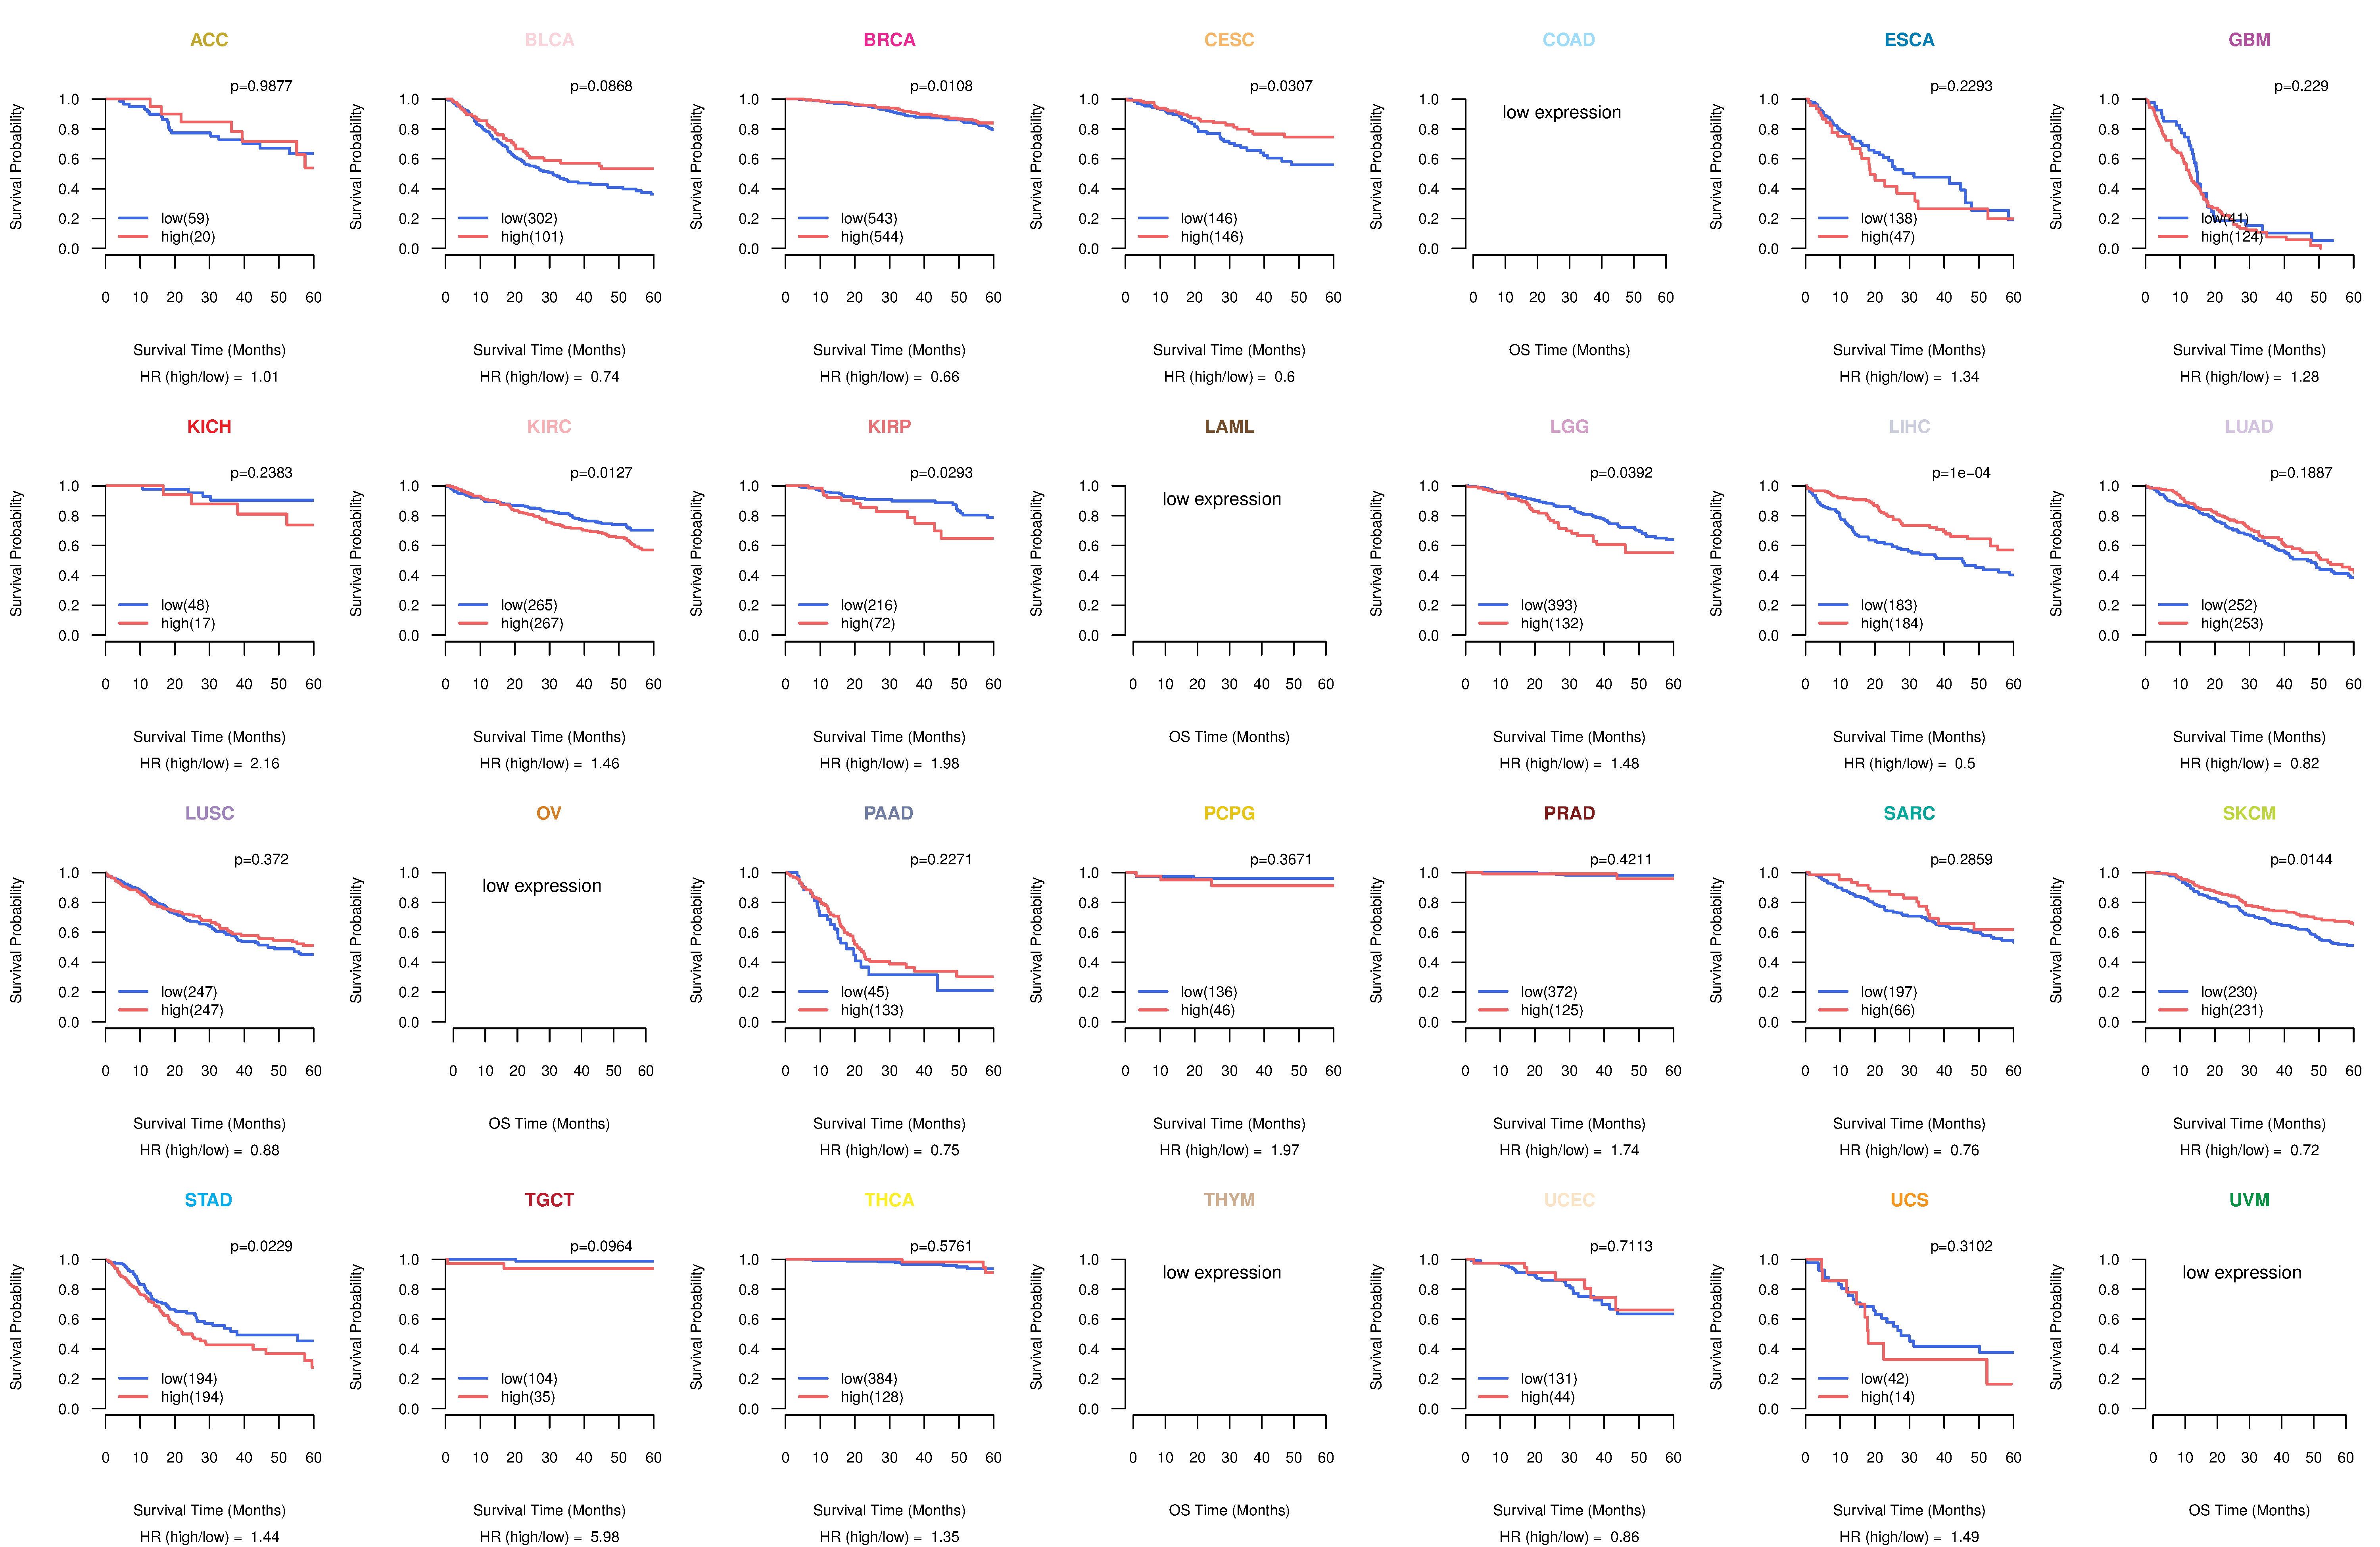
| TissGeneProg for ITIH1 |
| Kaplan-Meier plots with logrank tests of overall survival (OS) using 28 cancer types (TCGA IlluminaHiSeq_RNASeqV2, pan-cancer normalized log2(norm_counts+1) data, version 2016-08-16) (TCGA clinicalMatrix, phenotype data, version 2016-04-27) * Click on the image to enlarge it in a new window. |
 |
| Kaplan-Meier plots with logrank test of relapse free survival (RFS) using 28 cancer types (TCGA IlluminaHiSeq_RNASeqV2, pan-cancer normalized log2(norm_counts+1) data, version 2016-08-16) (TCGA clinicalMatrix, phenotype data, version 2016-04-27) * Click on the image enlarge it in a new window. |
 |
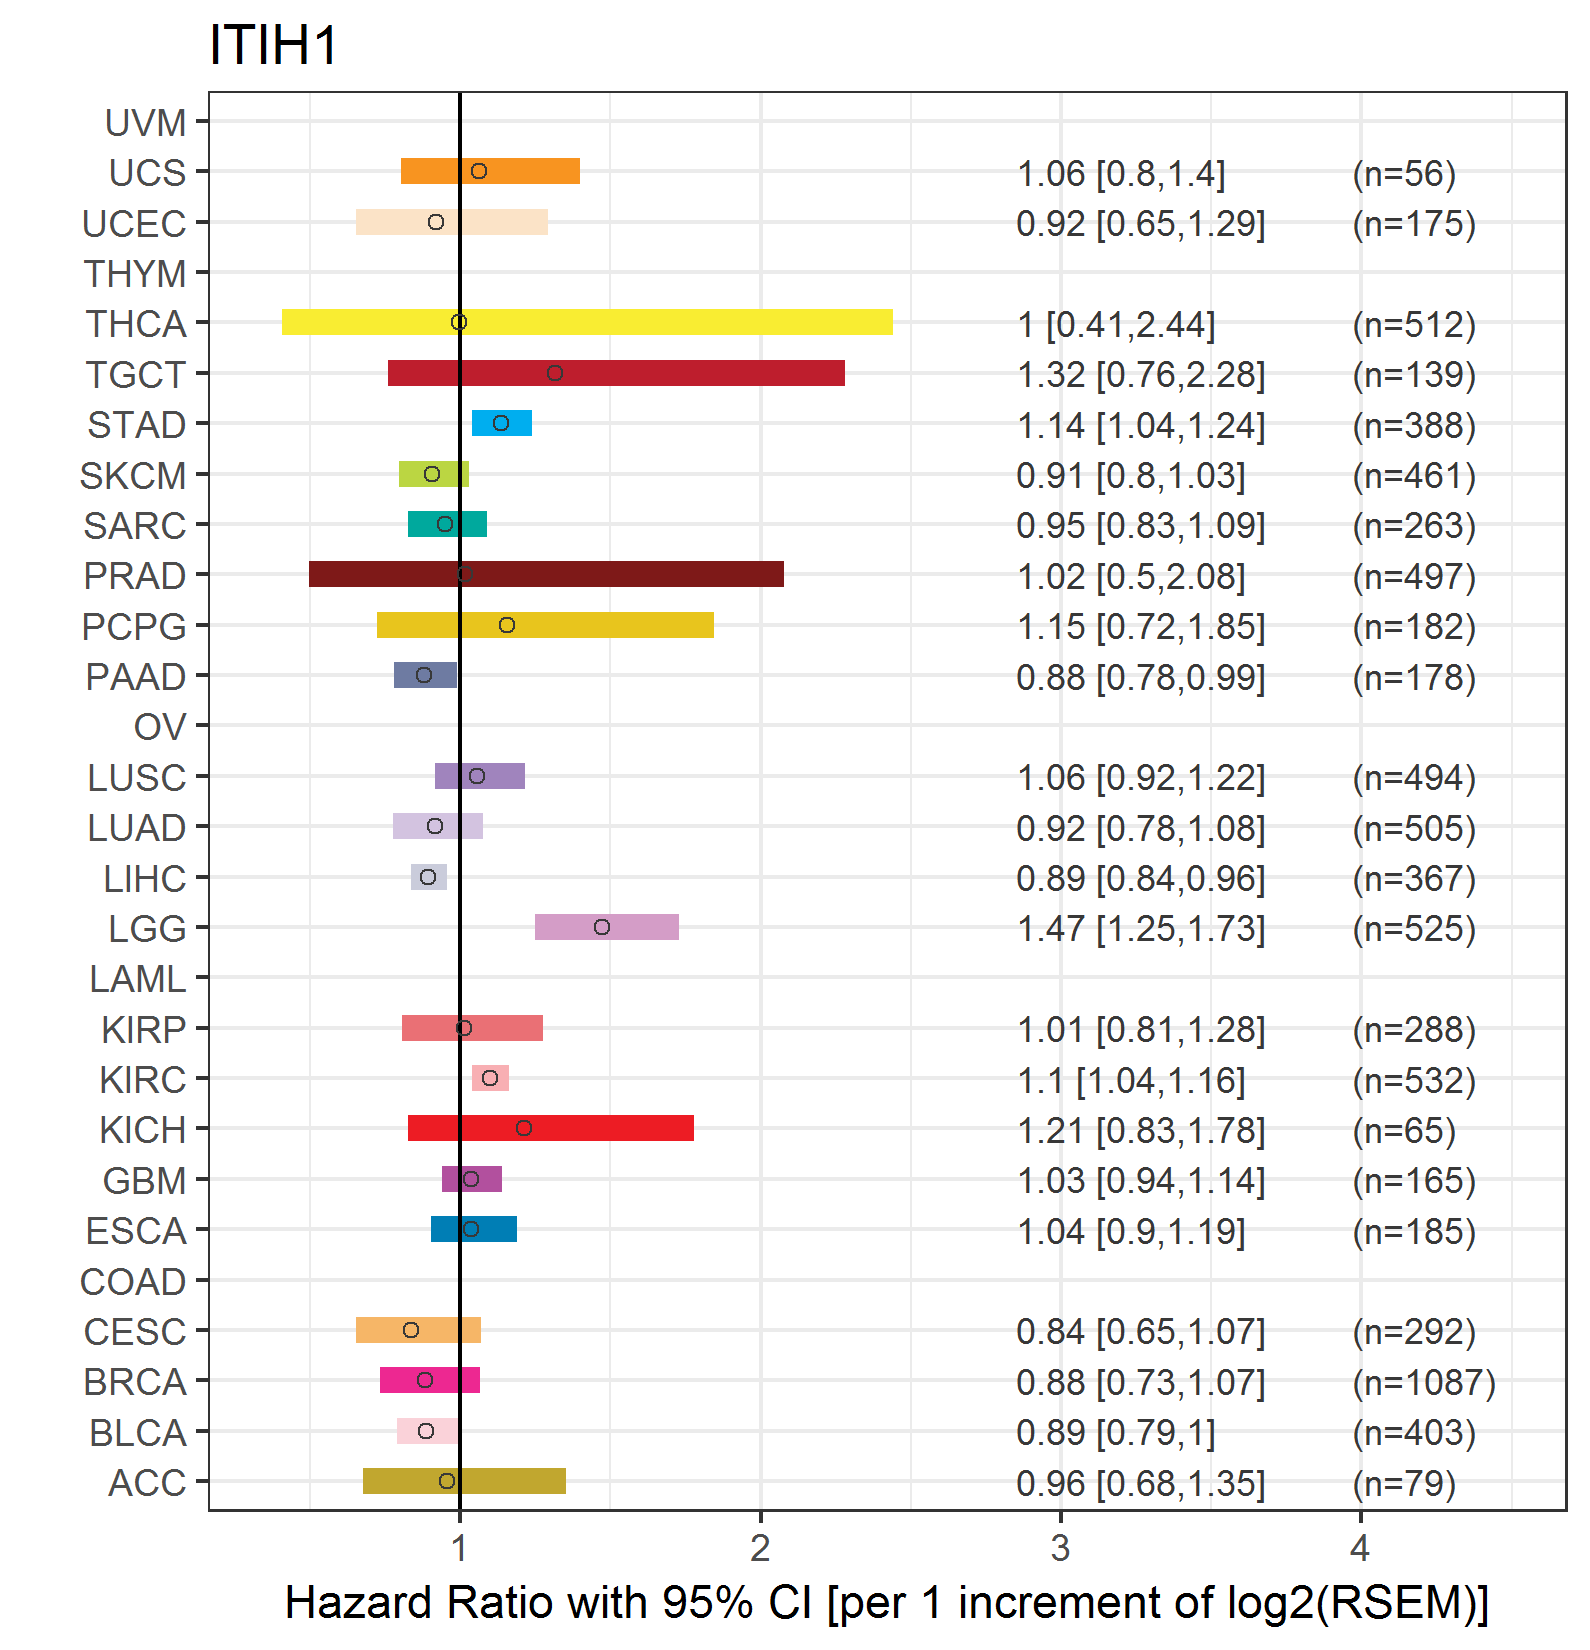
| Forest plot of Cox proportional hazard ratio (HR) and 95% CI of overall survival (OS) using 28 cancer types (TCGA IlluminaHiSeq_RNASeqV2, pan-cancer normalized log2(norm_counts+1) data, version 2016-08-16) (TCGA clinicalMatrix, phenotype data, version 2016-04-27) * Click on the image enlarge it in a new window. |
 |
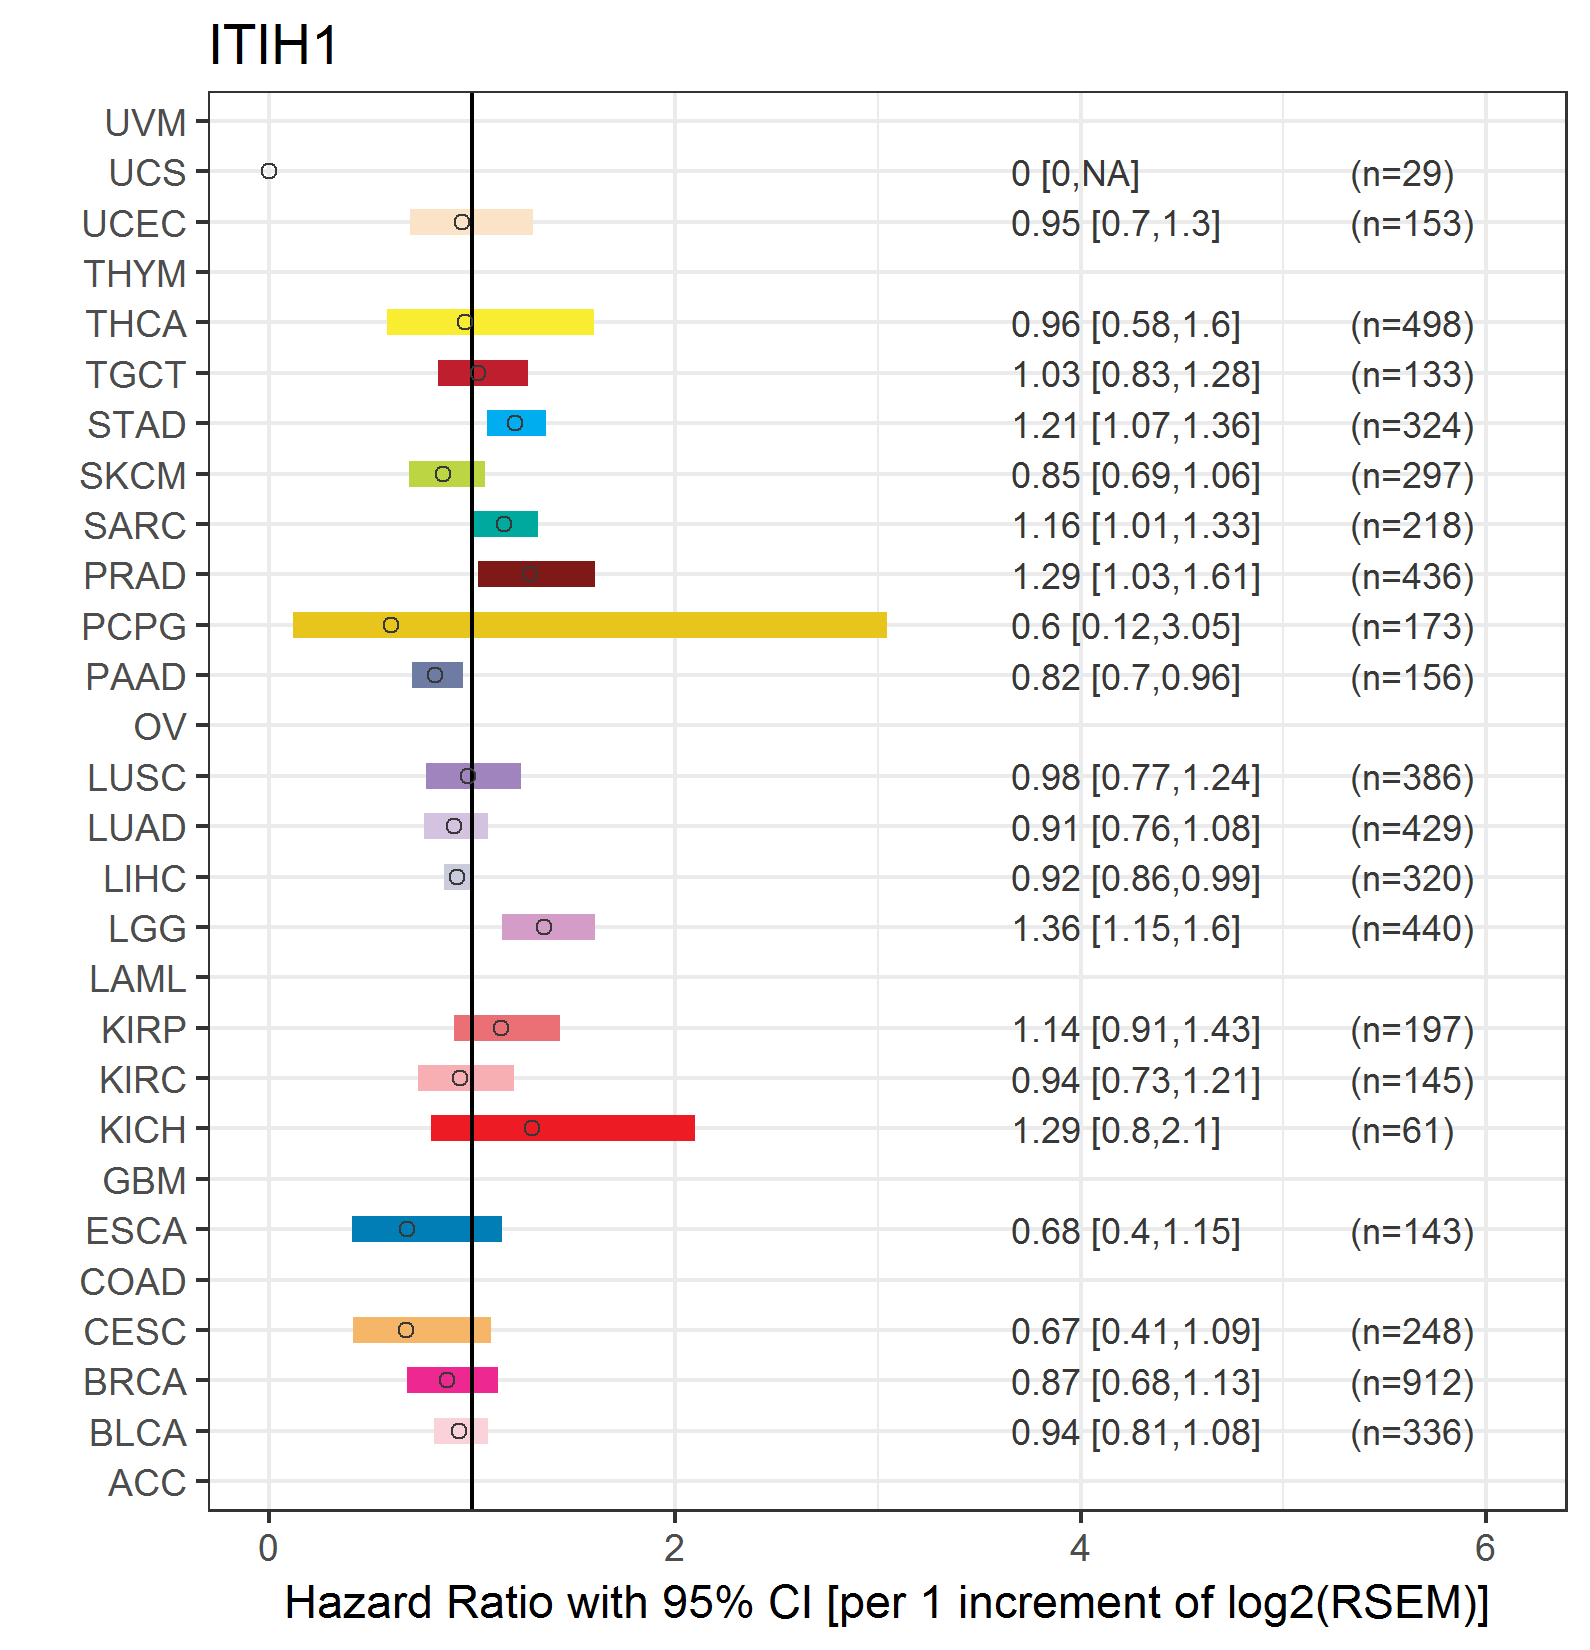
| Forest plot of Cox proportional hazard ratio (HR) and 95% CI of relapse free survival (RFS) using 28 cancer types (TCGA IlluminaHiSeq_RNASeqV2, pan-cancer normalized log2(norm_counts+1) data, version 2016-08-16) (TCGA clinicalMatrix, phenotype data, version 2016-04-27) * Click on the image enlarge it in a new window. |
 |
| Top |
| TissGeneClin for ITIH1 |
| TissGeneDrug for ITIH1 |
| Drug information targeting TissGene (DrugBank Version 5.0.6, 2017-04-01) |
| DrugBank ID | Drug name | Drug activity | Drug type | Drug status |
| Top |
| TissGeneDisease for ITIH1 |
| Disease information associated with TissGene (DisGeNet, 2016-06-01) |
| Disease ID | Disease name | # pubmeds | Source |
| umls:C0005586 | Bipolar Disorder | 2 | BeFree,GAD,GWASCAT |
| umls:C0036341 | Schizophrenia | 2 | BeFree,GAD |
| umls:C0023903 | Liver neoplasms | 1 | CTD_human |
| umls:C0027627 | Neoplasm Metastasis | 1 | LHGDN |
| umls:C0041696 | Unipolar Depression | 1 | BeFree |
| umls:C0042974 | von Willebrand Disease | 1 | BeFree |
| umls:C0242379 | Malignant neoplasm of lung | 1 | BeFree |
| umls:C0280100 | Solid tumour | 1 | BeFree |
| umls:C0684249 | Carcinoma of lung | 1 | BeFree |
| umls:C1269683 | Major Depressive Disorder | 1 | BeFree |
| umls:C1458155 | Mammary Neoplasms | 1 | BeFree |
|
Copyright 2016-Present - The University of Texas Health Science Center at Houston (UTHealth) Web File Viewing | How to Report, Fraud, Waste and Abuse | State of Texas | Statewide Search | Texas Homeland Security | Site Policies |