 |
| |
| |
| |
| |
| |
| |
|

| TissGeneSummary for PTCHD3 |
 Gene summary Gene summary |
| Basic gene information | Gene symbol | PTCHD3 |
| Gene name | patched domain containing 3 | |
| Synonyms | PTR | |
| Cytomap | UCSC genome browser: 10p12.1 | |
| Type of gene | protein-coding | |
| RefGenes | NM_001034842.3, | |
| Description | patched domain-containing protein 3patched-related protein | |
| Modification date | 20141207 | |
| dbXrefs | MIM : 611791 | |
| HGNC : HGNC | ||
| Ensembl : ENSG00000182077 | ||
| Vega : OTTHUMG00000017860 | ||
| Protein | UniProt: go to UniProt's Cross Reference DB Table | |
| Expression | CleanEX: HS_PTCHD3 | |
| BioGPS: 374308 | ||
| Pathway | NCI Pathway Interaction Database: PTCHD3 | |
| KEGG: PTCHD3 | ||
| REACTOME: PTCHD3 | ||
| Pathway Commons: PTCHD3 | ||
| Context | iHOP: PTCHD3 | |
| ligand binding site mutation search in PubMed: PTCHD3 | ||
| UCL Cancer Institute: PTCHD3 | ||
| Assigned class in TissGDB* | C | |
| Included tissue-specific gene expression resources | HPA,GTEx | |
| Specific-tissues in normal samples (assigned by TissGDB using HPA, TiGER, and GTEx) | Testis | |
| Cancer types related to the specific-tissues in cancer samples (assigned by TissGDB using TCGA) | TGCT | |
| Reference showing the relevant tissue of PTCHD3 | ||
| Description by TissGene annotations | Cancer gene | |
| * Class A consists of genes with literature evidence and is part of the cTissGenes. Class B consists of only cTissGenes without additional evidence. The remaining genes belong to Class C. |
| Gene ontology having evidence of Inferred from Direct Assay (IDA) from Entrez |
| GO ID | GO term | PubMed ID |
| Top |
| TissGeneExp for PTCHD3 |
| Gene expressions across 28 cancer types (X-axis: cancer type and Y-axis: log2(norm_counts+1)) (TCGA IlluminaHiSeq_RNASeqV2, pan-cancer normalized log2(norm_counts+1) data, version 2016-08-16) |
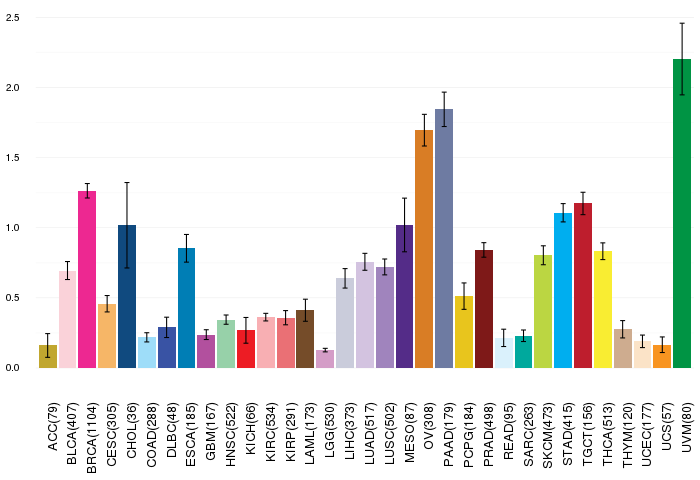 |
| Gene isoform expressions across 28 cancer types (X-axis: cancer type and Y-axis: log2(norm_counts+1)) (TCGA pan-cancer tcga_rsem_isoform_tpm, version 2016-09-01) |
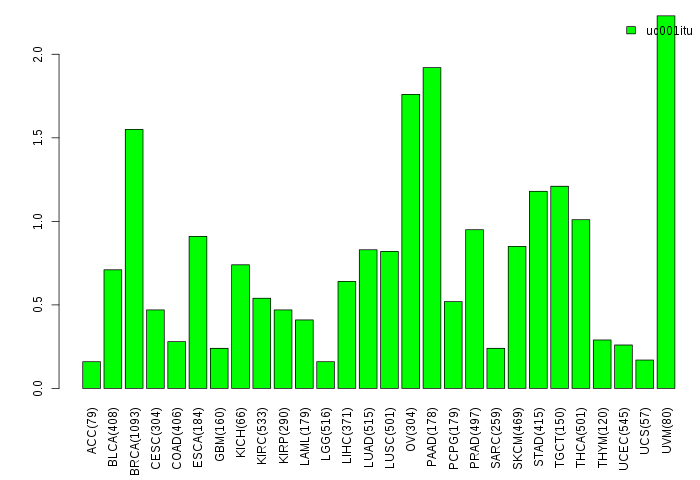 |
| Gene expressions across normal tissues of GTEx data (GTEx GTEx_Analysis_v6_RNA-seq_RNA-SeQCv1.1.8_gene_rpkm.gct) - Here, we shows the matched tissue types only among our 28 cancer types. |
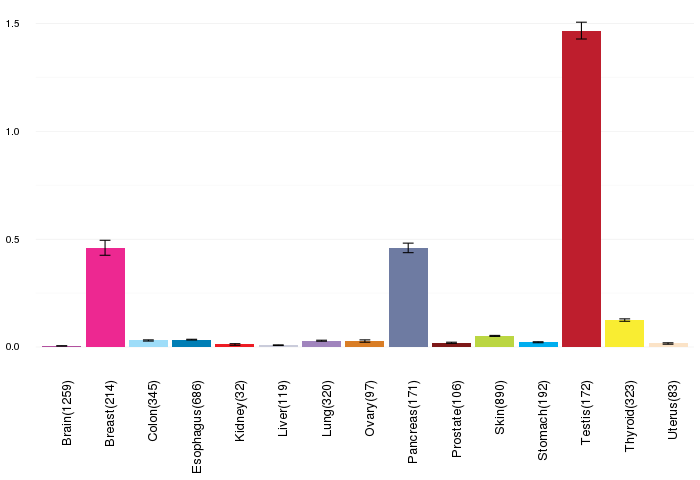 |
| Different expressions across 14 cancer types with more than 10 samples between matched tumors and normals (X-axis: cancer type and Y-axis: log2(norm_counts+1)) (TCGA IlluminaHiSeq_RNASeqV2, pan-cancer normalized log2(norm_counts+1) data, version 2016-08-16) |
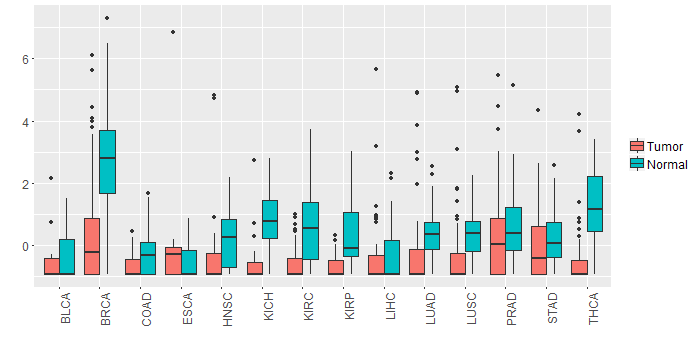 |
| - Significantly differentially expressed cancer types and information. (|Fold change|>1 and FDR<0.05) |
| Cancer type | Mean(exp) in tumor | Mean(exp) in matched normal | Log2FC | P-val. | FDR |
| KIRC | -0.557237665 | 0.634629002 | -1.191866667 | 1.23E-11 | 4.74E-11 |
| THCA | -0.467735005 | 1.280985334 | -1.748720339 | 1.71E-14 | 2.00E-13 |
| BRCA | 0.323801005 | 2.709832584 | -2.386031579 | 1.96E-24 | 1.86E-23 |
| KICH | -0.576803276 | 0.878644724 | -1.455448 | 4.46E-07 | 1.79E-06 |
| Top |
| TissGene-miRNA for PTCHD3 |
| Significantly anti-correlated miRNAs of TissGene across 28 cancer types (Gene-miRNA relations from TargetScanHuman Relsease 7.1, Conserved_Site_Context_Scores.txt.zip, 06.01.2016) (TCGA IlluminaHiSeq_miRNASeq, log2(RPM+1) data, version 2016-11-21) (TCGA IlluminaHiSeq_RNASeqV2, log2(normalized_count+1) data, version 2016-08-16) (Spearman’s Rank Correlation (p-value<0.05 and coefficient<-0.25)) |
| Cancer type | miRNA id | miRNA accession | P-val. | Coeff. | # samples |
| Top |
| TissGeneMut for PTCHD3 |
| TissGeneSNV for PTCHD3 |
| nsSNV counts per each loci. Different colors of circles represent different cancer types. Circle size denotes number of samples. (TCGA somatic mutation (SNPs and small INDELs) data, version 2016-04-25) * Click on the image to enlarge it in a new window. |
 |
 |
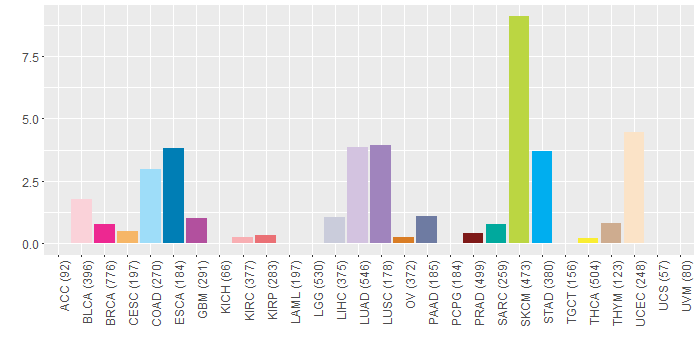
| Somatic nucleotide variants of TissGene across 28 cancer types (X-axis: cancer type and Y-axis: % of mutated samples) The numbers in parentheses are numbers of samples with mutation (nsSNVs). (TCGA somatic mutation (SNPs and small INDELs) data, version 2016-04-25) |
 |
| - nsSNVs sorted by frequency. |
| AAchange | Cancer type | # samples |
| p.G303E | SKCM | 2 |
| p.S747F | SKCM | 2 |
| p.T298N | SARC | 2 |
| p.E163K | SKCM | 2 |
| p.W697L | LIHC | 1 |
| p.W559X | SKCM | 1 |
| p.C548S | LUAD | 1 |
| p.P333T | KIRC | 1 |
| p.S747A | SKCM | 1 |
| p.W559* | SKCM | 1 |
| p.G58R | SKCM | 1 |
| p.V364L | BRCA | 1 |
| p.I744M | BLCA | 1 |
| p.T105M | COAD | 1 |
| p.W668* | SKCM | 1 |
| p.Q34* | HNSC | 1 |
| p.A136V | GBM | 1 |
| p.E244K | SKCM | 1 |
| p.G246R | SKCM | 1 |
| p.E205K | ESCA | 1 |
| p.W668X | SKCM | 1 |
| p.P76S | LUSC | 1 |
| p.I751T | LUAD | 1 |
| p.I392F | LUAD | 1 |
| p.S309N | SKCM | 1 |
| p.S508P | LIHC | 1 |
| p.A199T | HNSC | 1 |
| p.D93N | BLCA | 1 |
| p.G626R | OV | 1 |
| p.G135S | SKCM | 1 |
| p.D575E | LUAD | 1 |
| p.E99K | SKCM | 1 |
| p.A144T | ESCA | 1 |
| p.N266S | COAD | 1 |
| p.I744N | STAD | 1 |
| p.P286S | SKCM | 1 |
| p.S79L | STAD | 1 |
| p.R77Q | STAD | 1 |
| p.V134G | HNSC | 1 |
| p.V241M | BRCA | 1 |
| p.I682M | COAD | 1 |
| p.R109K | LIHC | 1 |
| p.T491S | LUAD | 1 |
| p.E100K | SKCM | 1 |
| p.G520R | SKCM | 1 |
| p.F301L | LUAD | 1 |
| p.R125C | COAD | 1 |
| p.A242V | ESCA | 1 |
| p.D636N | BRCA | 1 |
| p.S53F | SKCM | 1 |
| p.G58E | SKCM | 1 |
| p.E103K | SKCM | 1 |
| p.A74S | LUSC | 1 |
| p.F350S | LIHC | 1 |
| p.D193N | SKCM | 1 |
| p.A415V | STAD | 1 |
| p.A256T | STAD | 1 |
| p.S740P | STAD | 1 |
| p.E625A | LUAD | 1 |
| p.P712S | SKCM | 1 |
| p.A74T | STAD | 1 |
| p.W139* | LUSC | 1 |
| p.G307R | ESCA | 1 |
| p.S62L | UCEC | 1 |
| p.R630Q | SKCM | 1 |
| p.G455E | BLCA | 1 |
| p.L157M | LUAD | 1 |
| p.V606F | THCA | 1 |
| p.P723S | SKCM | 1 |
| p.A136T | BLCA | 1 |
| p.T717A | STAD | 1 |
| p.A151V | COAD | 1 |
| p.E576K | SKCM | 1 |
| p.L693F | SKCM | 1 |
| p.D590N | BLCA | 1 |
| p.H115Y | SKCM | 1 |
| p.D348N | STAD | 1 |
| p.T597K | LUAD | 1 |
| p.R182Q | UCEC | 1 |
| p.G153A | LUAD | 1 |
| p.D218N | ESCA | 1 |
| p.L278I | COAD | 1 |
| p.D636N | SKCM | 1 |
| p.D83N | SKCM | 1 |
| p.D336Y | LUSC | 1 |
| p.V241L | LUAD | 1 |
| p.S217R | SKCM | 1 |
| p.R409Q | SKCM | 1 |
| p.S758Y | LUSC | 1 |
| p.E37Q | BRCA | 1 |
| p.P655S | SKCM | 1 |
| p.E168K | UCEC | 1 |
| p.Y327C | BLCA | 1 |
| p.R323W | BLCA | 1 |
| p.P177L | UCEC | 1 |
| p.A178T | GBM | 1 |
| p.P267T | LUAD | 1 |
| p.P44T | THYM | 1 |
| p.V610A | STAD | 1 |
| p.D72N | SKCM | 1 |
| p.R77G | ESCA | 1 |
| p.V241M | UCEC | 1 |
| p.Q237* | HNSC | 1 |
| p.P583L | SKCM | 1 |
| p.R111W | ESCA | 1 |
| p.E70K | SKCM | 1 |
| p.E103K | UCEC | 1 |
| p.P569S | UCEC | 1 |
| p.E677K | SKCM | 1 |
| p.N742D | ESCA | 1 |
| p.I408V | STAD | 1 |
| p.R243W | PAAD | 1 |
| p.P50L | STAD | 1 |
| p.S421Y | UCEC | 1 |
| p.E98* | LUSC | 1 |
| p.P78L | COAD | 1 |
| p.F405C | PAAD | 1 |
| p.G626D | SKCM | 1 |
| p.I495T | PRAD | 1 |
| p.P145H | LUAD | 1 |
| p.L261I | LUSC | 1 |
| p.D652N | READ | 1 |
| p.A487V | STAD | 1 |
| p.S572F | SKCM | 1 |
| p.L212M | UCEC | 1 |
| p.E743K | SKCM | 1 |
| p.G504E | SKCM | 1 |
| p.V209I | BRCA | 1 |
| p.L68V | LUAD | 1 |
| p.P2L | SKCM | 1 |
| p.E545K | HNSC | 1 |
| p.R292K | SKCM | 1 |
| p.D666G | UCEC | 1 |
| p.T191I | LUAD | 1 |
| p.L325Q | LUAD | 1 |
| p.F607L | KIRP | 1 |
| p.M312I | LUAD | 1 |
| p.E63K | SKCM | 1 |
| p.V645I | UCEC | 1 |
| p.C402* | UCEC | 1 |
| p.R589K | BLCA | 1 |
| p.L693I | UCEC | 1 |
| p.D580N | SKCM | 1 |
| p.A199T | STAD | 1 |
| p.T277M | STAD | 1 |
| p.R544T | BLCA | 1 |
| p.P730S | SKCM | 1 |
| p.T277M | CESC | 1 |
| p.P76S | SKCM | 1 |
| p.Q273K | LUAD | 1 |
| p.W697L | DLBC | 1 |
| p.L611F | LUAD | 1 |
| p.P54S | SKCM | 1 |
| p.G131W | LUAD | 1 |
| p.C567G | BRCA | 1 |
| p.P16H | LUAD | 1 |
| p.G429S | PRAD | 1 |
| p.R196S | SKCM | 1 |
| p.R630X | ESCA | 1 |
| p.S741X | STAD | 1 |
| p.M479K | GBM | 1 |
| p.P294S | SKCM | 1 |
| p.S741* | STAD | 1 |
| p.K354R | SKCM | 1 |
| p.H622Y | SKCM | 1 |
| p.D724N | SKCM | 1 |
| p.R409Q | UCEC | 1 |
| p.F725V | COAD | 1 |
| Top |
| TissGeneCNV for PTCHD3 |
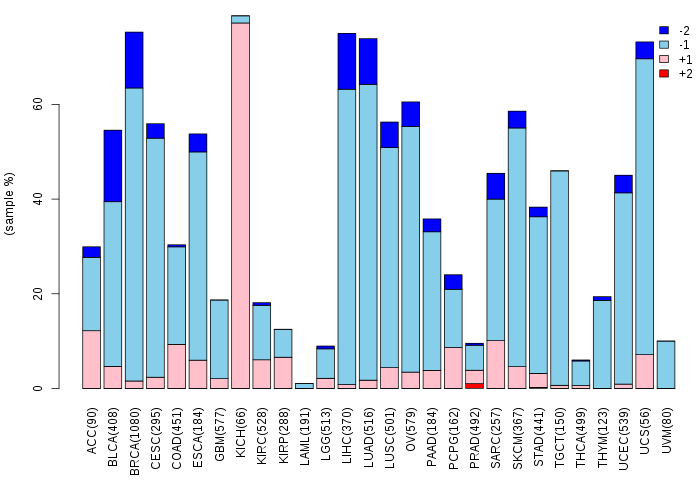
| Copy number variations of TissGene across 28 cancer types (X-axis: cancer type and Y-axis: % of CNV samples) (TCGA Gistic2_CopyNumber_Gistic2_all_data_by_genes, Gistic2 copy number data, version 2016-08-16) |
 |
| Top |
| TissGeneFusions for PTCHD3 |
| Fusion genes including TissGene (ChimerDB 3.0, 2016-12-01 and TCGA fusion Portal 2015-12-01) |
| Database | Src | Cancer type | Sample | Fusion gene | ORF | 5'-gene BP | 3'-gene BP |
| Top |
| TissGeneNet for PTCHD3 |
| Co-expressed gene networks based on protein-protein interaction data (CePIN) (TCGA IlluminaHiSeq_RNASeqV2, pan-cancer normalized log2(norm_counts+1) data, version 2016-08-16) (PINA2 ppi data) |
| Top |
| TissGeneProg for PTCHD3 |
| Kaplan-Meier plots with logrank tests of overall survival (OS) using 28 cancer types (TCGA IlluminaHiSeq_RNASeqV2, pan-cancer normalized log2(norm_counts+1) data, version 2016-08-16) (TCGA clinicalMatrix, phenotype data, version 2016-04-27) * Click on the image to enlarge it in a new window. |
 |
| Kaplan-Meier plots with logrank test of relapse free survival (RFS) using 28 cancer types (TCGA IlluminaHiSeq_RNASeqV2, pan-cancer normalized log2(norm_counts+1) data, version 2016-08-16) (TCGA clinicalMatrix, phenotype data, version 2016-04-27) * Click on the image enlarge it in a new window. |
 |
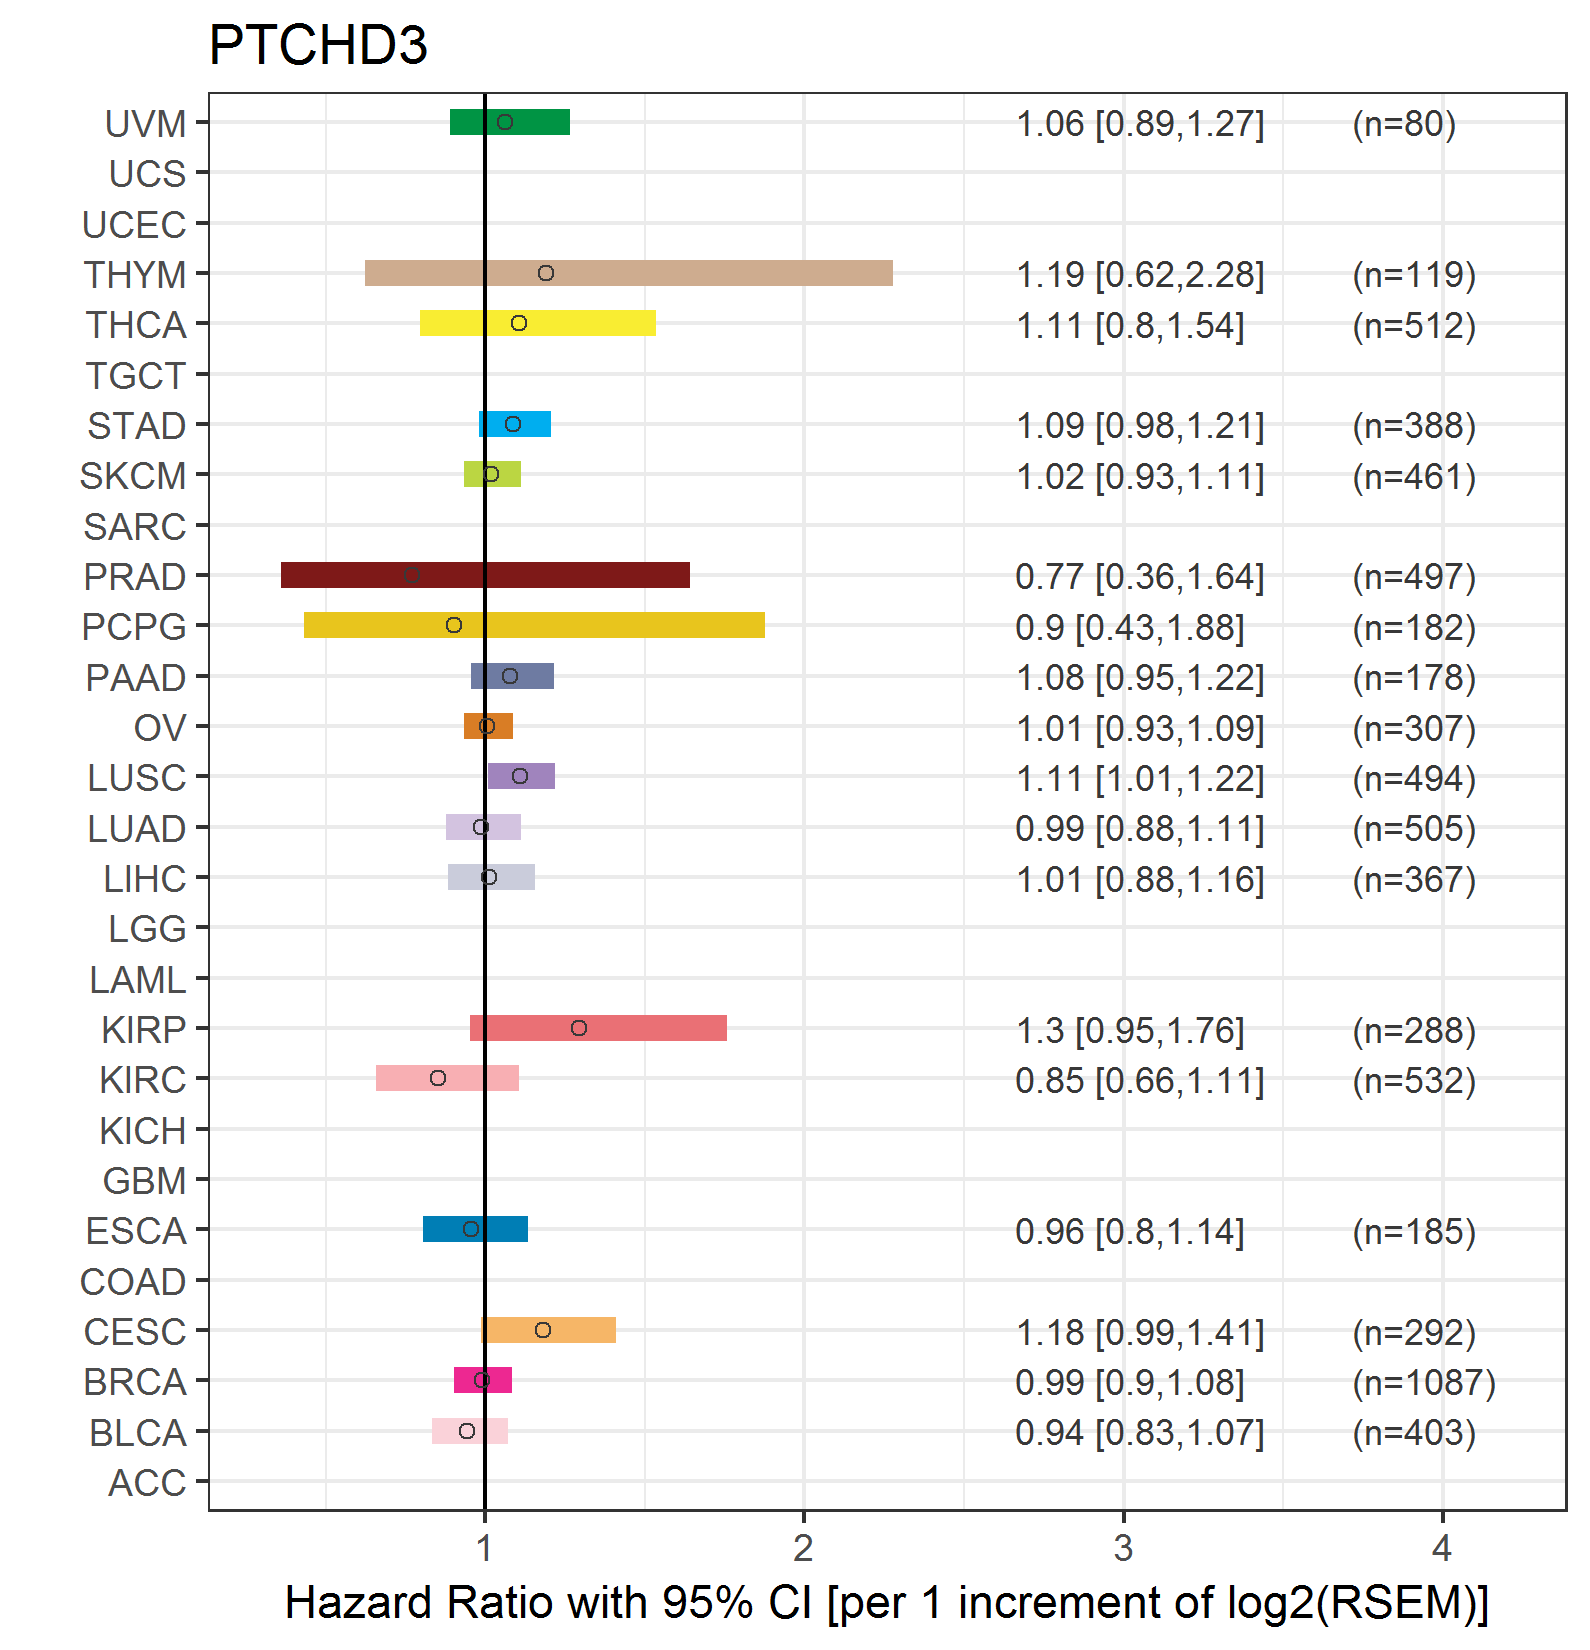
| Forest plot of Cox proportional hazard ratio (HR) and 95% CI of overall survival (OS) using 28 cancer types (TCGA IlluminaHiSeq_RNASeqV2, pan-cancer normalized log2(norm_counts+1) data, version 2016-08-16) (TCGA clinicalMatrix, phenotype data, version 2016-04-27) * Click on the image enlarge it in a new window. |
 |
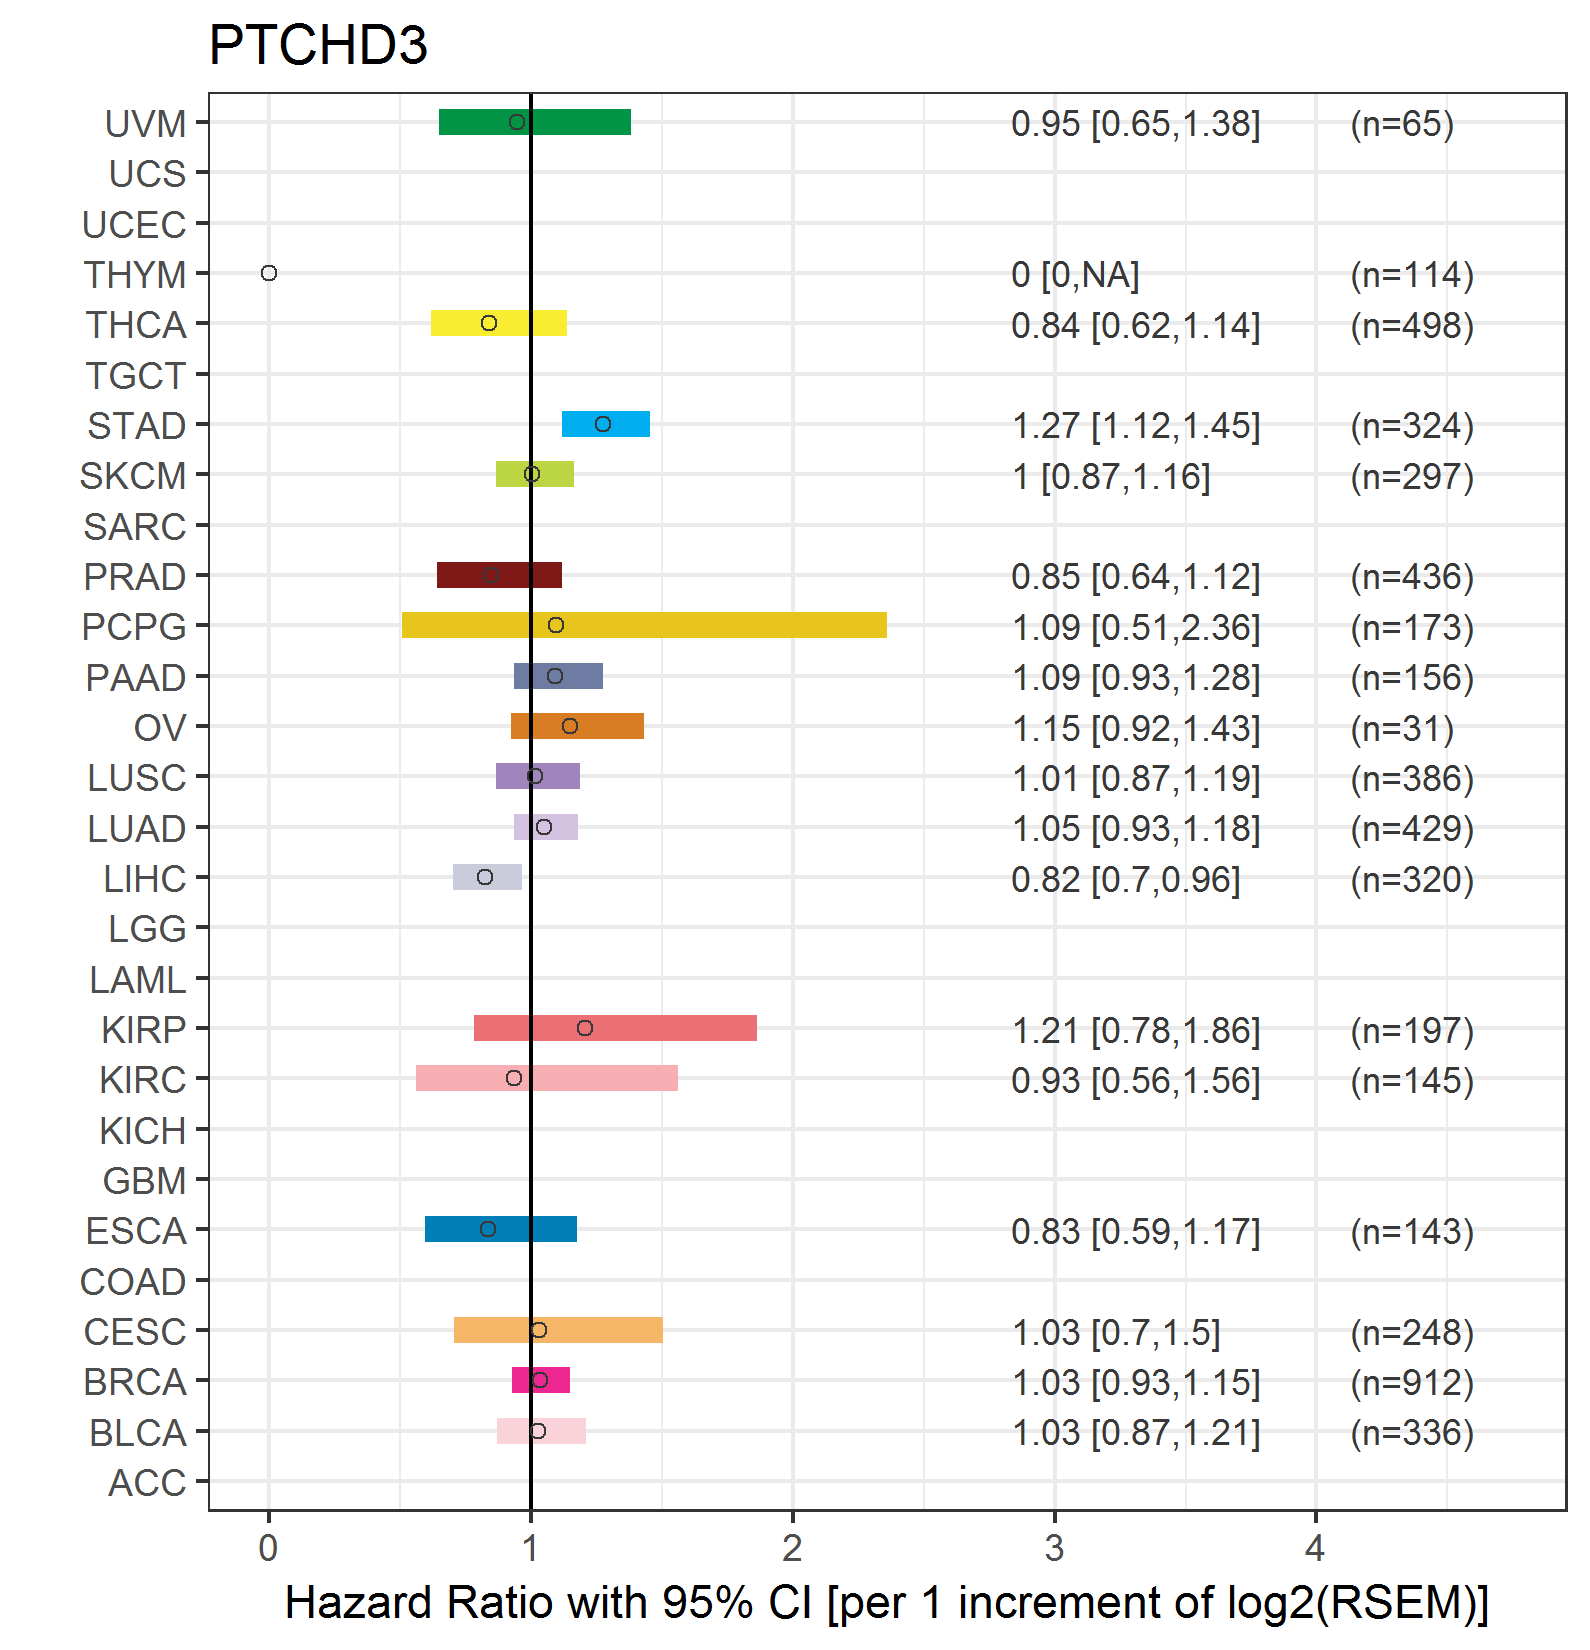
| Forest plot of Cox proportional hazard ratio (HR) and 95% CI of relapse free survival (RFS) using 28 cancer types (TCGA IlluminaHiSeq_RNASeqV2, pan-cancer normalized log2(norm_counts+1) data, version 2016-08-16) (TCGA clinicalMatrix, phenotype data, version 2016-04-27) * Click on the image enlarge it in a new window. |
 |
| Top |
| TissGeneClin for PTCHD3 |
| TissGeneDrug for PTCHD3 |
| Drug information targeting TissGene (DrugBank Version 5.0.6, 2017-04-01) |
| DrugBank ID | Drug name | Drug activity | Drug type | Drug status |
| Top |
| TissGeneDisease for PTCHD3 |
| Disease information associated with TissGene (DisGeNet, 2016-06-01) |
| Disease ID | Disease name | # pubmeds | Source |
|
Copyright 2016-Present - The University of Texas Health Science Center at Houston (UTHealth) Web File Viewing | How to Report, Fraud, Waste and Abuse | State of Texas | Statewide Search | Texas Homeland Security | Site Policies |