 |
| |
| |
| |
| |
| |
| |
|

| TissGeneSummary for DNAJB13 |
 Gene summary Gene summary |
| Basic gene information | Gene symbol | DNAJB13 |
| Gene name | DnaJ (Hsp40) homolog, subfamily B, member 13 | |
| Synonyms | RSPH16A|TSARG5|TSARG6 | |
| Cytomap | UCSC genome browser: 11q13.4 | |
| Type of gene | protein-coding | |
| RefGenes | NM_153614.3, | |
| Description | DnaJ (Hsp40) related, subfamily B, member 13DnaJ-like proteindnaJ homolog subfamily B member 13radial spoke 16 homolog Atestis and spermatogenesis cell-related protein 6testis spermatocyte apoptosis-related gene 6 proteintestis spermatogenesis apopt | |
| Modification date | 20141216 | |
| dbXrefs | MIM : 610263 | |
| HGNC : HGNC | ||
| Ensembl : ENSG00000187726 | ||
| HPRD : 15573 | ||
| Vega : OTTHUMG00000168093 | ||
| Protein | UniProt: go to UniProt's Cross Reference DB Table | |
| Expression | CleanEX: HS_DNAJB13 | |
| BioGPS: 374407 | ||
| Pathway | NCI Pathway Interaction Database: DNAJB13 | |
| KEGG: DNAJB13 | ||
| REACTOME: DNAJB13 | ||
| Pathway Commons: DNAJB13 | ||
| Context | iHOP: DNAJB13 | |
| ligand binding site mutation search in PubMed: DNAJB13 | ||
| UCL Cancer Institute: DNAJB13 | ||
| Assigned class in TissGDB* | C | |
| Included tissue-specific gene expression resources | TiGER,GTEx | |
| Specific-tissues in normal samples (assigned by TissGDB using HPA, TiGER, and GTEx) | Testis | |
| Cancer types related to the specific-tissues in cancer samples (assigned by TissGDB using TCGA) | TGCT | |
| Reference showing the relevant tissue of DNAJB13 | ||
| Description by TissGene annotations | Have significant anti-correlated miRNA | |
| * Class A consists of genes with literature evidence and is part of the cTissGenes. Class B consists of only cTissGenes without additional evidence. The remaining genes belong to Class C. |
| Gene ontology having evidence of Inferred from Direct Assay (IDA) from Entrez |
| GO ID | GO term | PubMed ID |
| Top |
| TissGeneExp for DNAJB13 |
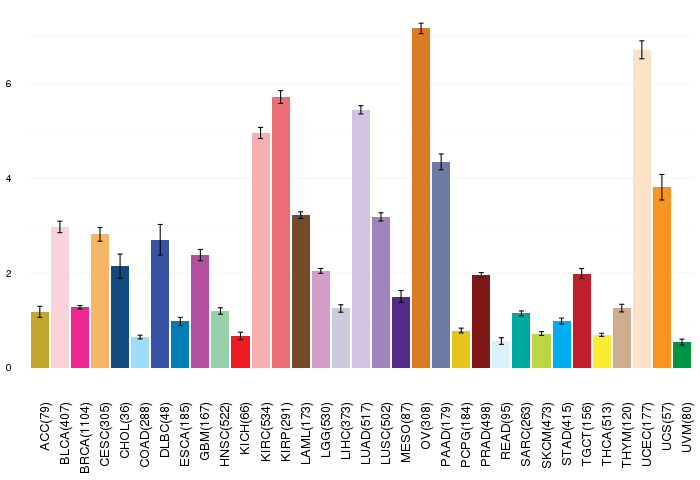
| Gene expressions across 28 cancer types (X-axis: cancer type and Y-axis: log2(norm_counts+1)) (TCGA IlluminaHiSeq_RNASeqV2, pan-cancer normalized log2(norm_counts+1) data, version 2016-08-16) |
 |
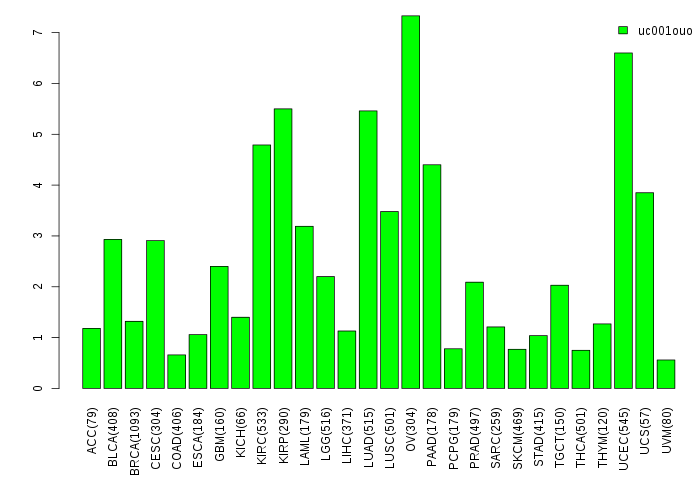
| Gene isoform expressions across 28 cancer types (X-axis: cancer type and Y-axis: log2(norm_counts+1)) (TCGA pan-cancer tcga_rsem_isoform_tpm, version 2016-09-01) |
 |
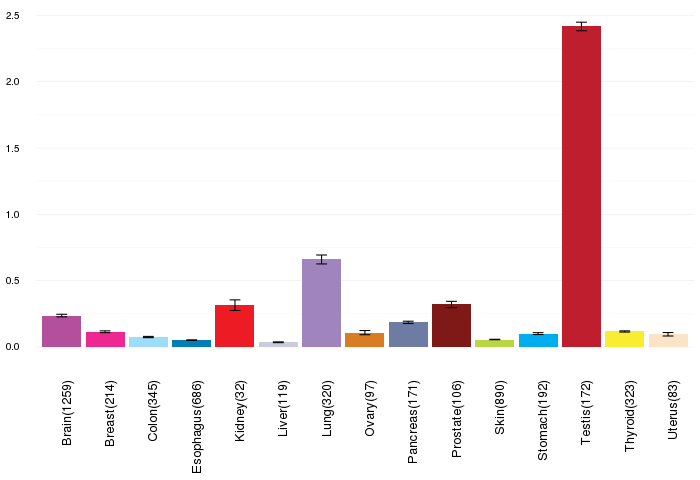
| Gene expressions across normal tissues of GTEx data (GTEx GTEx_Analysis_v6_RNA-seq_RNA-SeQCv1.1.8_gene_rpkm.gct) - Here, we shows the matched tissue types only among our 28 cancer types. |
 |
| Different expressions across 14 cancer types with more than 10 samples between matched tumors and normals (X-axis: cancer type and Y-axis: log2(norm_counts+1)) (TCGA IlluminaHiSeq_RNASeqV2, pan-cancer normalized log2(norm_counts+1) data, version 2016-08-16) |
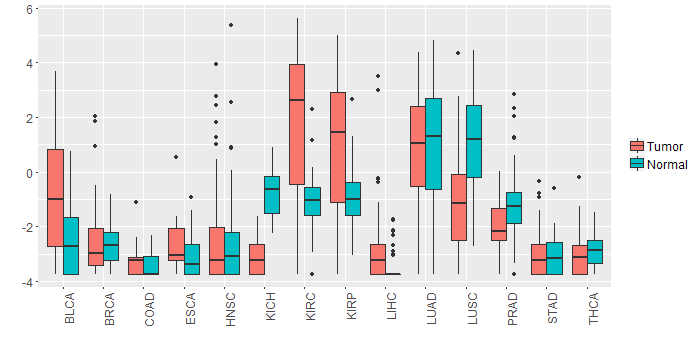 |
| - Significantly differentially expressed cancer types and information. (|Fold change|>1 and FDR<0.05) |
| Cancer type | Mean(exp) in tumor | Mean(exp) in matched normal | Log2FC | P-val. | FDR |
| KIRC | 1.883487002 | -1.110542165 | 2.994029167 | 7.86E-15 | 3.90E-14 |
| LUSC | -1.061638733 | 1.080565188 | -2.142203922 | 1.35E-07 | 3.75E-07 |
| KICH | -3.054947831 | -0.759823831 | -2.295124 | 1.03E-13 | 1.47E-12 |
| BLCA | -0.697878568 | -2.418110147 | 1.720231579 | 0.00765 | 0.036588387 |
| KIRP | 0.904800544 | -0.842561956 | 1.7473625 | 0.00158 | 0.004114239 |
| Top |
| TissGene-miRNA for DNAJB13 |
| Significantly anti-correlated miRNAs of TissGene across 28 cancer types (Gene-miRNA relations from TargetScanHuman Relsease 7.1, Conserved_Site_Context_Scores.txt.zip, 06.01.2016) (TCGA IlluminaHiSeq_miRNASeq, log2(RPM+1) data, version 2016-11-21) (TCGA IlluminaHiSeq_RNASeqV2, log2(normalized_count+1) data, version 2016-08-16) (Spearman’s Rank Correlation (p-value<0.05 and coefficient<-0.25)) |
| Cancer type | miRNA id | miRNA accession | P-val. | Coeff. | # samples |
| UCS | hsa-miR-223-3p | MIMAT0000280 | 0.0063 | -0.36 | 56 |
| Top |
| TissGeneMut for DNAJB13 |
| TissGeneSNV for DNAJB13 |
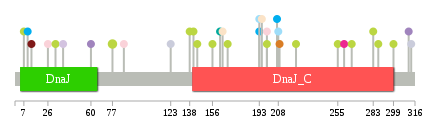
| nsSNV counts per each loci. Different colors of circles represent different cancer types. Circle size denotes number of samples. (TCGA somatic mutation (SNPs and small INDELs) data, version 2016-04-25) * Click on the image to enlarge it in a new window. |
 |
 |
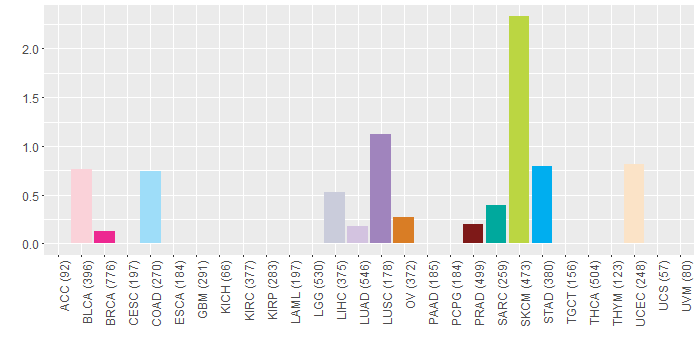
| Somatic nucleotide variants of TissGene across 28 cancer types (X-axis: cancer type and Y-axis: % of mutated samples) The numbers in parentheses are numbers of samples with mutation (nsSNVs). (TCGA somatic mutation (SNPs and small INDELs) data, version 2016-04-25) |
 |
| - nsSNVs sorted by frequency. |
| AAchange | Cancer type | # samples |
| p.P77S | SKCM | 2 |
| p.R131P | HNSC | 1 |
| p.R311L | LUSC | 1 |
| p.H32Y | SKCM | 1 |
| p.G275E | HNSC | 1 |
| p.P299S | SKCM | 1 |
| p.E141K | SKCM | 1 |
| p.R26K | BLCA | 1 |
| p.A209V | OV | 1 |
| p.R13H | PRAD | 1 |
| p.T156P | SKCM | 1 |
| p.N229K | HNSC | 1 |
| p.R255C | SKCM | 1 |
| p.K287E | SKCM | 1 |
| p.T195A | UCEC | 1 |
| p.P208S | COAD | 1 |
| p.E199K | SKCM | 1 |
| p.K60* | LUSC | 1 |
| p.P260R | BRCA | 1 |
| p.W86C | BLCA | 1 |
| p.S162F | SARC | 1 |
| p.I207T | STAD | 1 |
| p.R193H | STAD | 1 |
| p.P138S | SKCM | 1 |
| p.E38K | LUAD | 1 |
| p.H266Y | SKCM | 1 |
| p.L123X | LIHC | 1 |
| p.D283N | SKCM | 1 |
| p.R193H | COAD | 1 |
| p.E199D | BLCA | 1 |
| p.G10R | STAD | 1 |
| p.E168K | SKCM | 1 |
| p.A313T | LIHC | 1 |
| p.L144F | SKCM | 1 |
| p.S7F | SKCM | 1 |
| p.R164M | UCEC | 1 |
| p.R222C | SKCM | 1 |
| Top |
| TissGeneCNV for DNAJB13 |
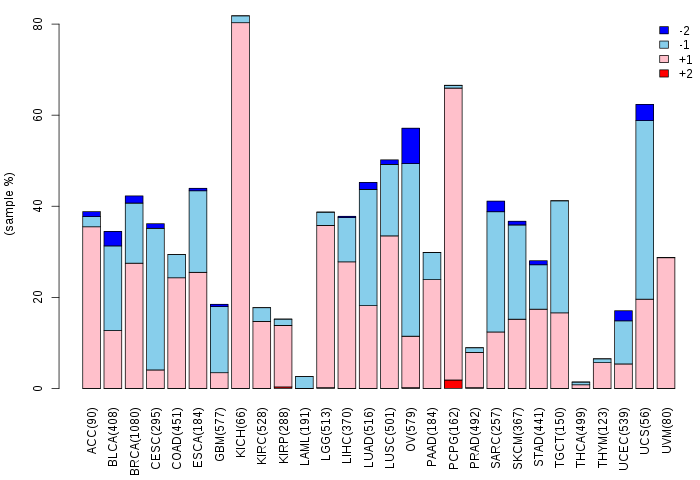
| Copy number variations of TissGene across 28 cancer types (X-axis: cancer type and Y-axis: % of CNV samples) (TCGA Gistic2_CopyNumber_Gistic2_all_data_by_genes, Gistic2 copy number data, version 2016-08-16) |
 |
| Top |
| TissGeneFusions for DNAJB13 |
| Fusion genes including TissGene (ChimerDB 3.0, 2016-12-01 and TCGA fusion Portal 2015-12-01) |
| Database | Src | Cancer type | Sample | Fusion gene | ORF | 5'-gene BP | 3'-gene BP |
| Chimerdb3.0 | FusionScan | BRCA | TCGA-A8-A08I-01A | FAM168A-DNAJB13 | 5'UTR-CDS | chr11:73308967 | chr11:73669361 |
| TCGAfusionPortal | PRADA | BRCA | TCGA-A8-A08I-01A | FAM168A-DNAJB13 | 5UTR-CDS | Chr11:73308968 | Chr11:73669362 |
| Top |
| TissGeneNet for DNAJB13 |
| Co-expressed gene networks based on protein-protein interaction data (CePIN) (TCGA IlluminaHiSeq_RNASeqV2, pan-cancer normalized log2(norm_counts+1) data, version 2016-08-16) (PINA2 ppi data) |
| Top |
| TissGeneProg for DNAJB13 |
| Kaplan-Meier plots with logrank tests of overall survival (OS) using 28 cancer types (TCGA IlluminaHiSeq_RNASeqV2, pan-cancer normalized log2(norm_counts+1) data, version 2016-08-16) (TCGA clinicalMatrix, phenotype data, version 2016-04-27) * Click on the image to enlarge it in a new window. |
 |
| Kaplan-Meier plots with logrank test of relapse free survival (RFS) using 28 cancer types (TCGA IlluminaHiSeq_RNASeqV2, pan-cancer normalized log2(norm_counts+1) data, version 2016-08-16) (TCGA clinicalMatrix, phenotype data, version 2016-04-27) * Click on the image enlarge it in a new window. |
 |
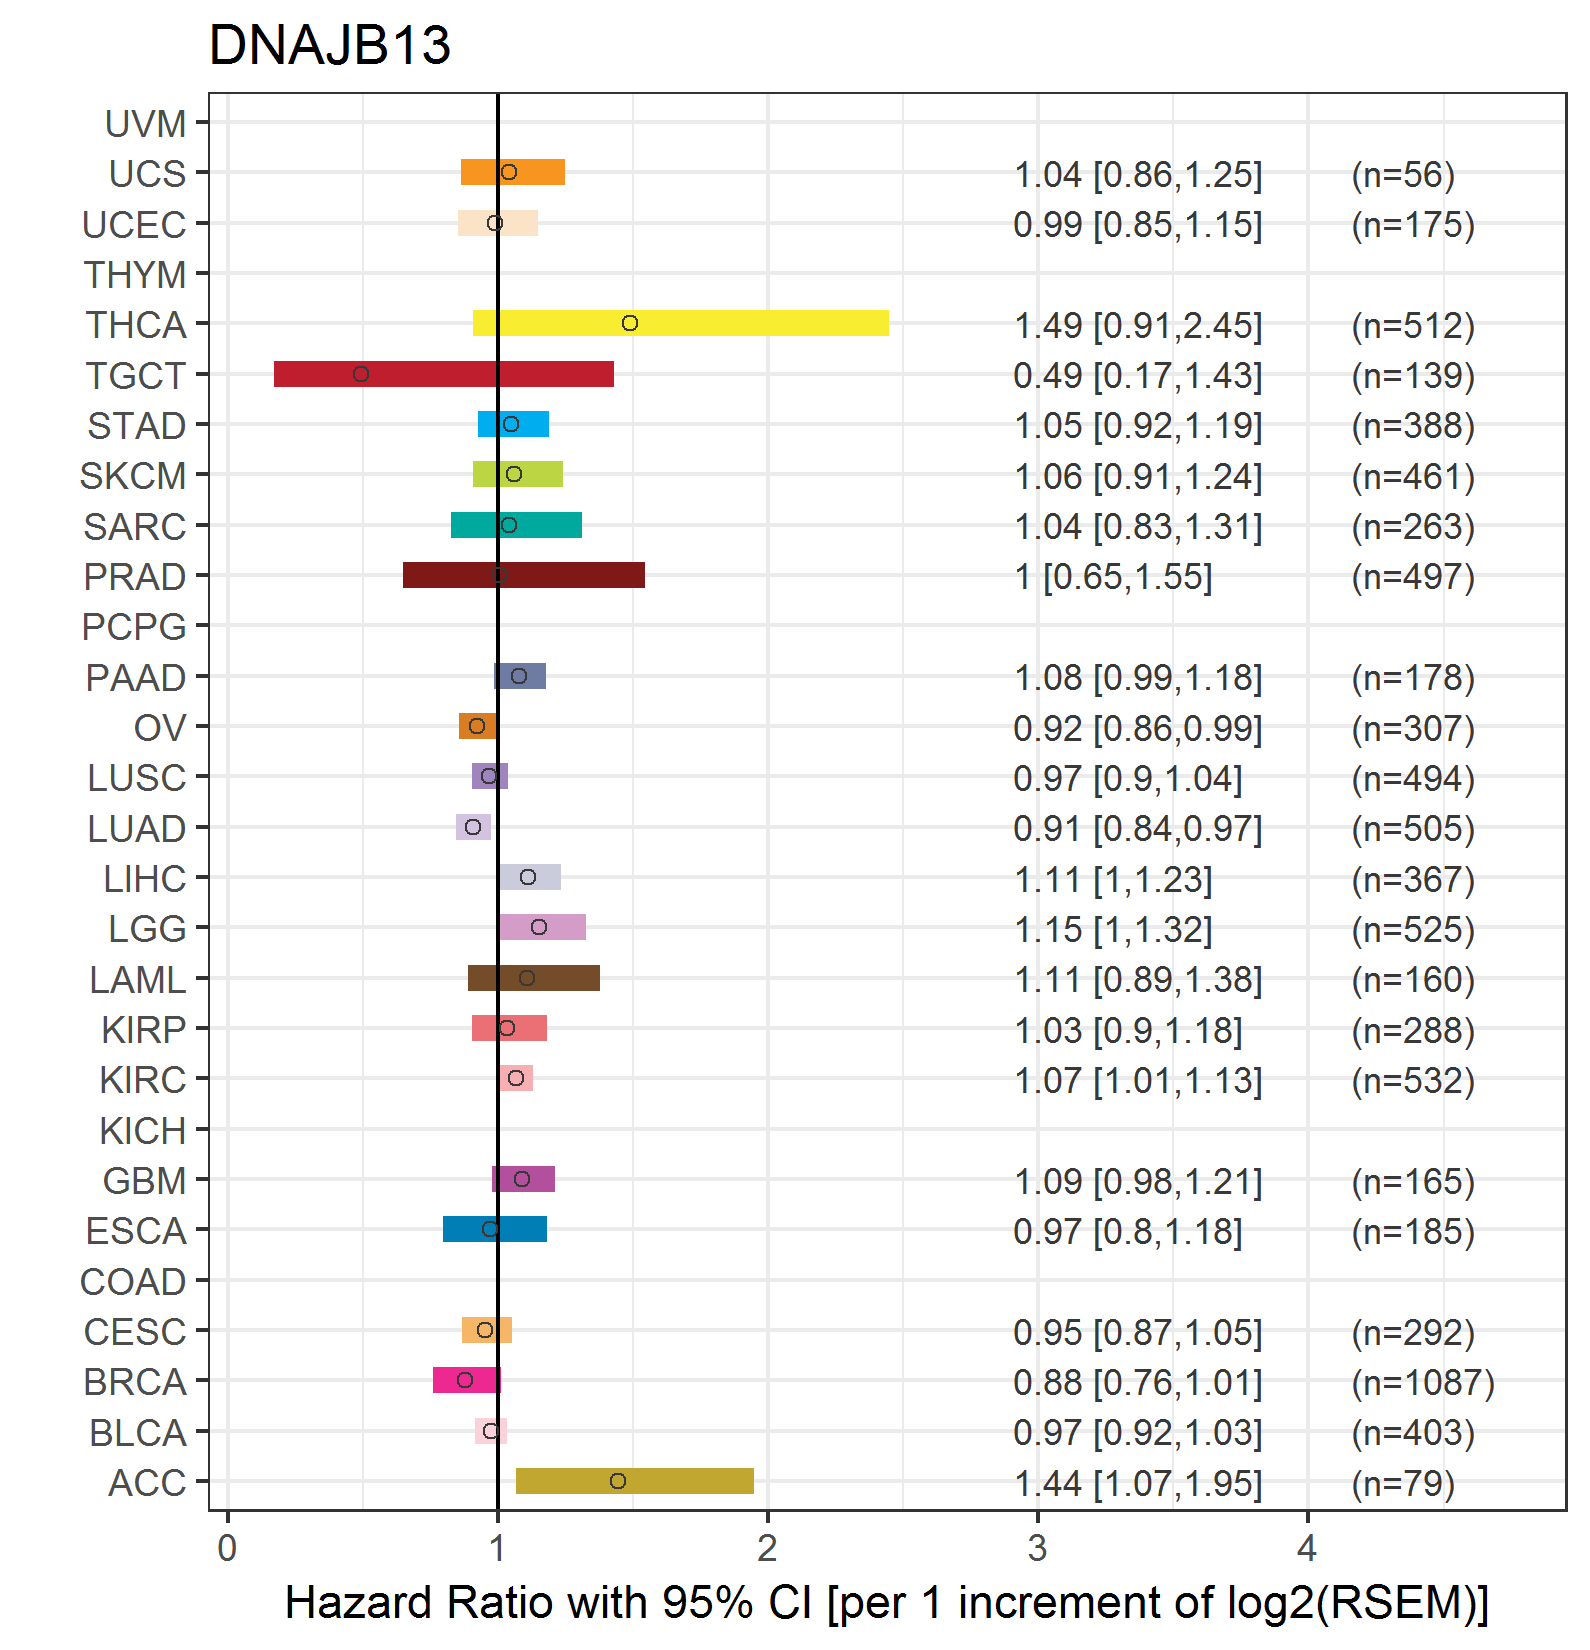
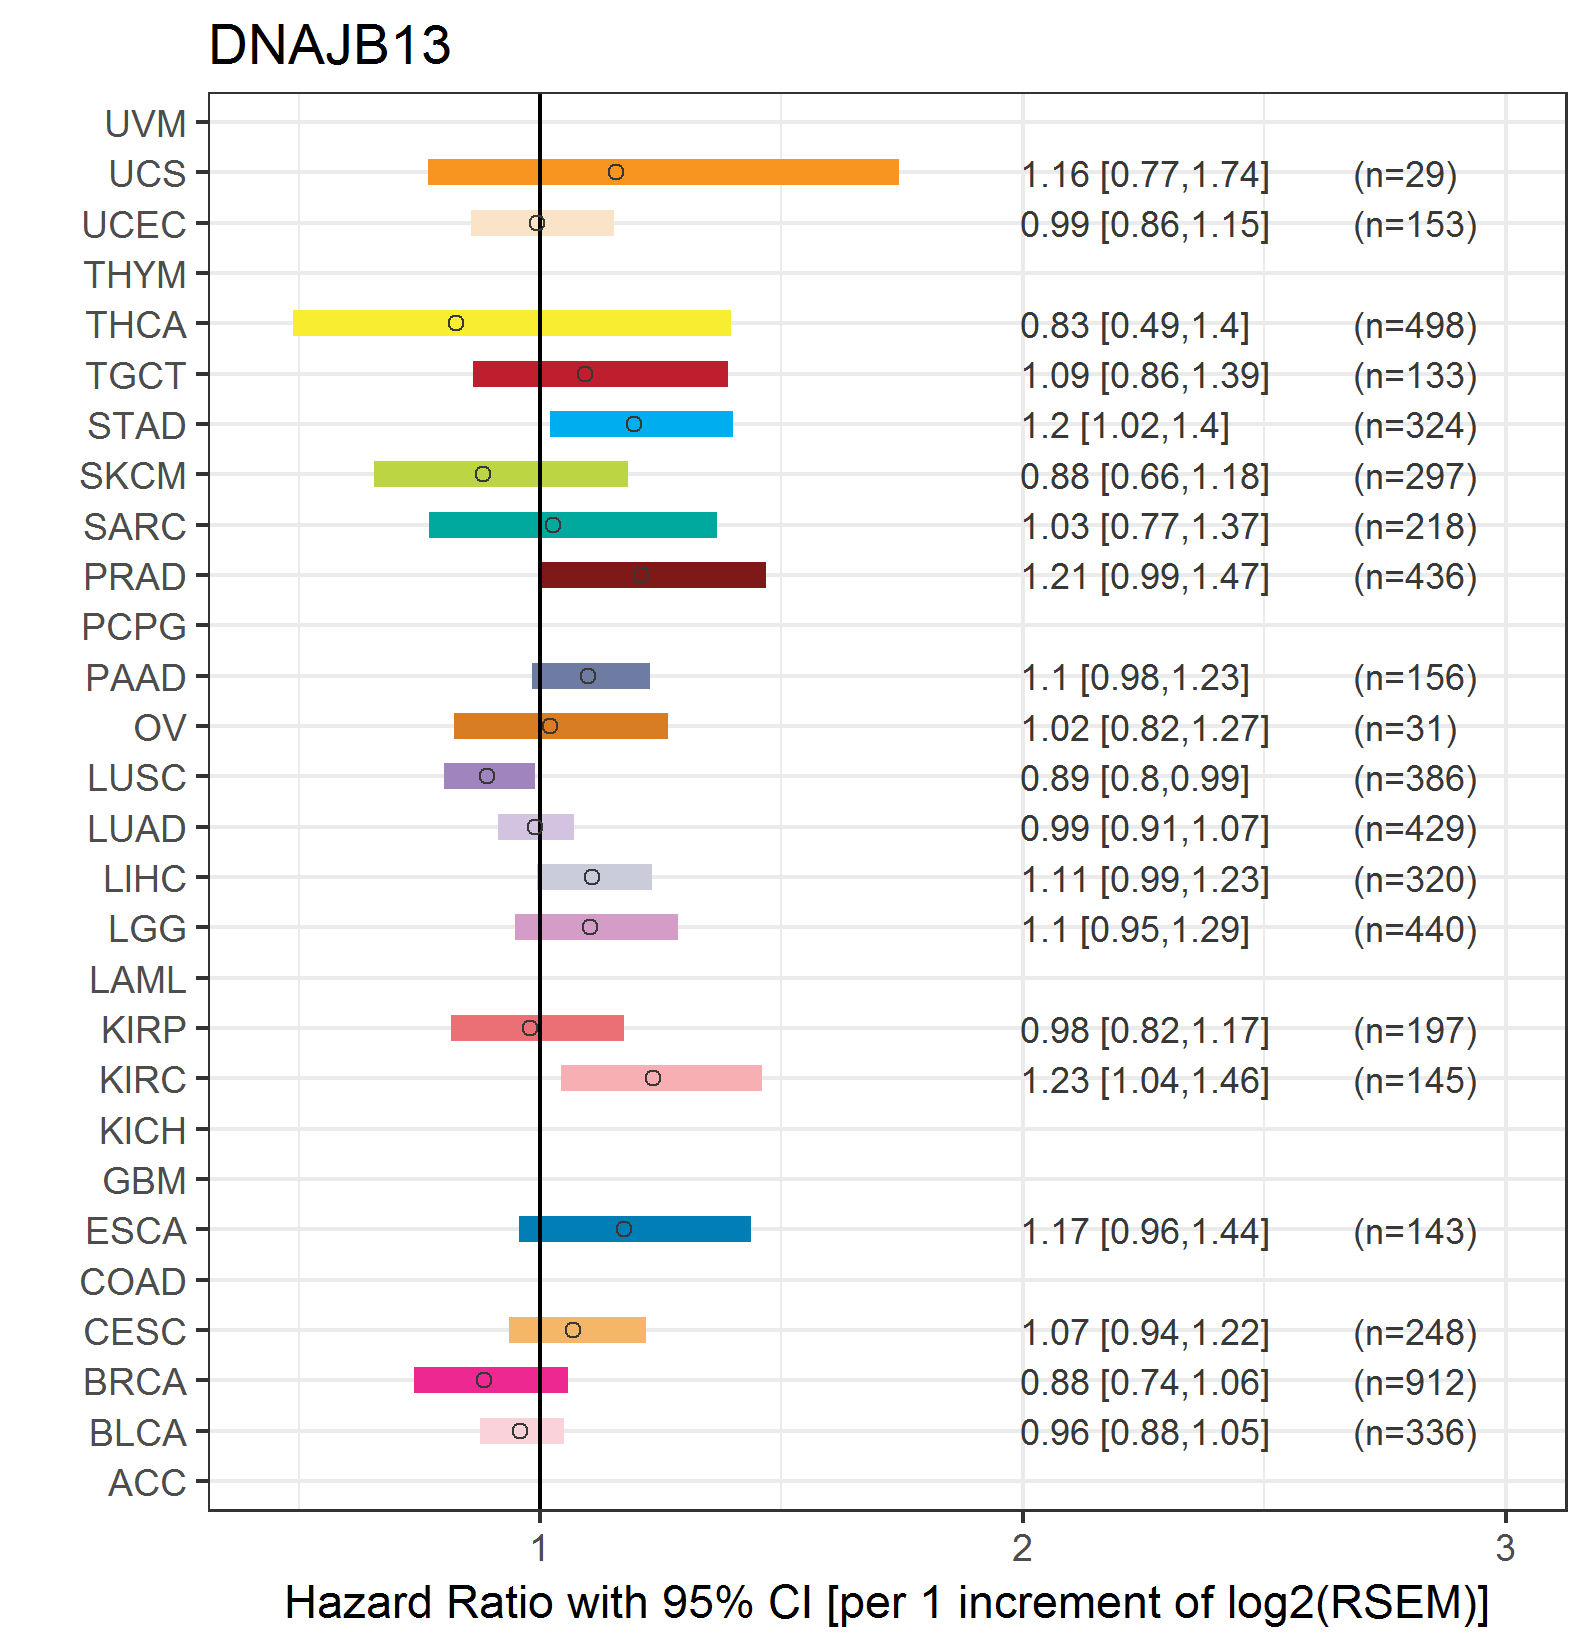
| Forest plot of Cox proportional hazard ratio (HR) and 95% CI of overall survival (OS) using 28 cancer types (TCGA IlluminaHiSeq_RNASeqV2, pan-cancer normalized log2(norm_counts+1) data, version 2016-08-16) (TCGA clinicalMatrix, phenotype data, version 2016-04-27) * Click on the image enlarge it in a new window. |
 |
| Forest plot of Cox proportional hazard ratio (HR) and 95% CI of relapse free survival (RFS) using 28 cancer types (TCGA IlluminaHiSeq_RNASeqV2, pan-cancer normalized log2(norm_counts+1) data, version 2016-08-16) (TCGA clinicalMatrix, phenotype data, version 2016-04-27) * Click on the image enlarge it in a new window. |
 |
| Top |
| TissGeneClin for DNAJB13 |
| TissGeneDrug for DNAJB13 |
| Drug information targeting TissGene (DrugBank Version 5.0.6, 2017-04-01) |
| DrugBank ID | Drug name | Drug activity | Drug type | Drug status |
| Top |
| TissGeneDisease for DNAJB13 |
| Disease information associated with TissGene (DisGeNet, 2016-06-01) |
| Disease ID | Disease name | # pubmeds | Source |
| umls:C0027404 | Narcolepsy | 1 | GAD |
|
Copyright 2016-Present - The University of Texas Health Science Center at Houston (UTHealth) Web File Viewing | How to Report, Fraud, Waste and Abuse | State of Texas | Statewide Search | Texas Homeland Security | Site Policies |