 |
| |
| |
| |
| |
| |
| |
|

| TissGeneSummary for C2CD4B |
 Gene summary Gene summary |
| Basic gene information | Gene symbol | C2CD4B |
| Gene name | C2 calcium-dependent domain containing 4B | |
| Synonyms | FAM148B|NLF2 | |
| Cytomap | UCSC genome browser: 15q22.2 | |
| Type of gene | protein-coding | |
| RefGenes | NM_001007595.2, | |
| Description | C2 calcium-dependent domain-containing protein 4Bfamily with sequence similarity 148, member Bnuclear localized factor 2nuclear-localized factor 2 | |
| Modification date | 20141207 | |
| dbXrefs | MIM : 610344 | |
| HGNC : HGNC | ||
| Ensembl : ENSG00000205502 | ||
| HPRD : 17636 | ||
| Vega : OTTHUMG00000171959 | ||
| Protein | UniProt: go to UniProt's Cross Reference DB Table | |
| Expression | CleanEX: HS_C2CD4B | |
| BioGPS: 388125 | ||
| Pathway | NCI Pathway Interaction Database: C2CD4B | |
| KEGG: C2CD4B | ||
| REACTOME: C2CD4B | ||
| Pathway Commons: C2CD4B | ||
| Context | iHOP: C2CD4B | |
| ligand binding site mutation search in PubMed: C2CD4B | ||
| UCL Cancer Institute: C2CD4B | ||
| Assigned class in TissGDB* | C | |
| Included tissue-specific gene expression resources | TiGER,GTEx | |
| Specific-tissues in normal samples (assigned by TissGDB using HPA, TiGER, and GTEx) | Pancreas | |
| Cancer types related to the specific-tissues in cancer samples (assigned by TissGDB using TCGA) | PAAD | |
| Reference showing the relevant tissue of C2CD4B | ||
| Description by TissGene annotations | ||
| * Class A consists of genes with literature evidence and is part of the cTissGenes. Class B consists of only cTissGenes without additional evidence. The remaining genes belong to Class C. |
| Gene ontology having evidence of Inferred from Direct Assay (IDA) from Entrez |
| GO ID | GO term | PubMed ID |
| Top |
| TissGeneExp for C2CD4B |
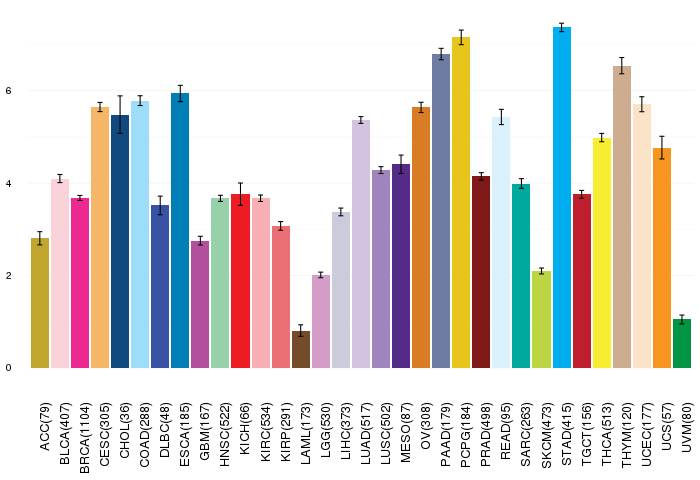
| Gene expressions across 28 cancer types (X-axis: cancer type and Y-axis: log2(norm_counts+1)) (TCGA IlluminaHiSeq_RNASeqV2, pan-cancer normalized log2(norm_counts+1) data, version 2016-08-16) |
 |
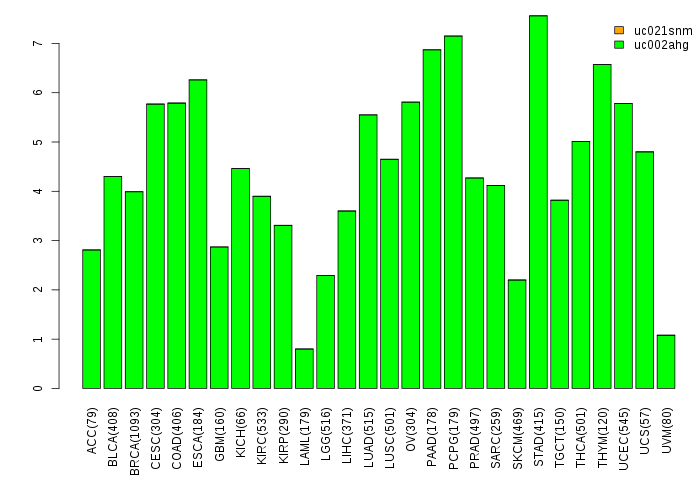
| Gene isoform expressions across 28 cancer types (X-axis: cancer type and Y-axis: log2(norm_counts+1)) (TCGA pan-cancer tcga_rsem_isoform_tpm, version 2016-09-01) |
 |
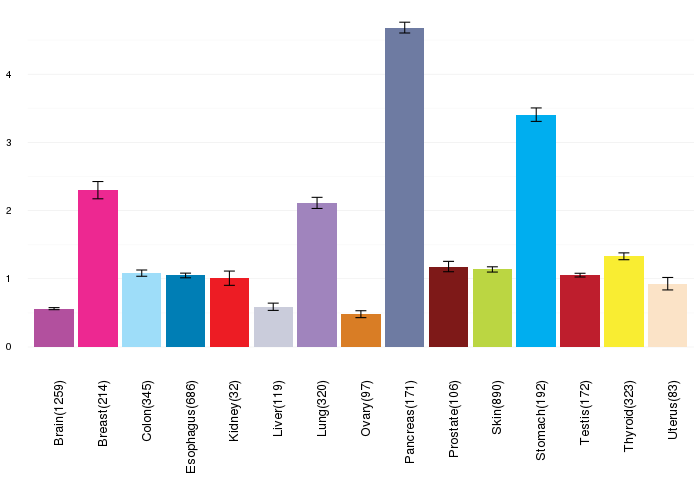
| Gene expressions across normal tissues of GTEx data (GTEx GTEx_Analysis_v6_RNA-seq_RNA-SeQCv1.1.8_gene_rpkm.gct) - Here, we shows the matched tissue types only among our 28 cancer types. |
 |
| Different expressions across 14 cancer types with more than 10 samples between matched tumors and normals (X-axis: cancer type and Y-axis: log2(norm_counts+1)) (TCGA IlluminaHiSeq_RNASeqV2, pan-cancer normalized log2(norm_counts+1) data, version 2016-08-16) |
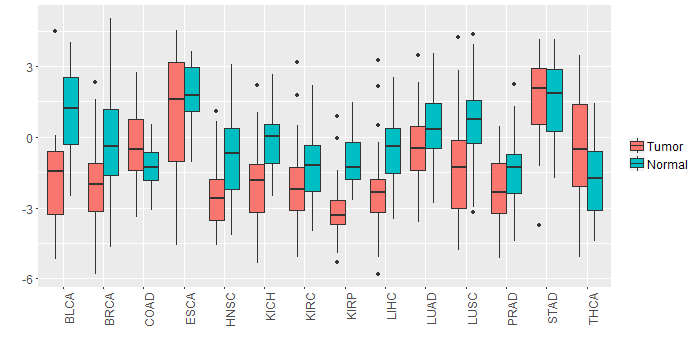 |
| - Significantly differentially expressed cancer types and information. (|Fold change|>1 and FDR<0.05) |
| Cancer type | Mean(exp) in tumor | Mean(exp) in matched normal | Log2FC | P-val. | FDR |
| KIRP | -3.136864735 | -1.04189911 | -2.094965625 | 4.14E-09 | 3.43E-08 |
| HNSC | -2.453637409 | -0.763688572 | -1.689948837 | 5.31E-06 | 3.26E-05 |
| LIHC | -2.335535735 | -0.489081735 | -1.846454 | 3.24E-08 | 2.54E-07 |
| LUSC | -1.353720127 | 0.66044654 | -2.014166667 | 8.91E-08 | 2.52E-07 |
| BRCA | -2.006191489 | -0.209730086 | -1.796461404 | 3.25E-12 | 1.41E-11 |
| BLCA | -1.774002893 | 1.155776055 | -2.929778947 | 0.000121 | 0.001287579 |
| KICH | -1.835163735 | -0.106715735 | -1.728448 | 0.000462 | 0.001065113 |
| THCA | -0.407300752 | -1.822178718 | 1.414877966 | 1.00E-04 | 0.000274349 |
| Top |
| TissGene-miRNA for C2CD4B |
| Significantly anti-correlated miRNAs of TissGene across 28 cancer types (Gene-miRNA relations from TargetScanHuman Relsease 7.1, Conserved_Site_Context_Scores.txt.zip, 06.01.2016) (TCGA IlluminaHiSeq_miRNASeq, log2(RPM+1) data, version 2016-11-21) (TCGA IlluminaHiSeq_RNASeqV2, log2(normalized_count+1) data, version 2016-08-16) (Spearman’s Rank Correlation (p-value<0.05 and coefficient<-0.25)) |
| Cancer type | miRNA id | miRNA accession | P-val. | Coeff. | # samples |
| Top |
| TissGeneMut for C2CD4B |
| TissGeneSNV for C2CD4B |
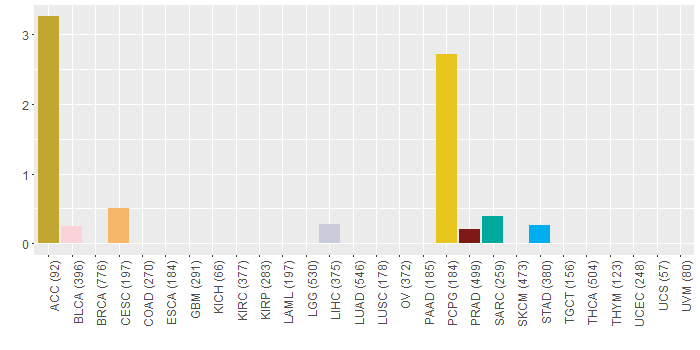
| nsSNV counts per each loci. Different colors of circles represent different cancer types. Circle size denotes number of samples. (TCGA somatic mutation (SNPs and small INDELs) data, version 2016-04-25) * Click on the image to enlarge it in a new window. |
 |
| Somatic nucleotide variants of TissGene across 28 cancer types (X-axis: cancer type and Y-axis: % of mutated samples) The numbers in parentheses are numbers of samples with mutation (nsSNVs). (TCGA somatic mutation (SNPs and small INDELs) data, version 2016-04-25) |
 |
| - nsSNVs sorted by frequency. |
| AAchange | Cancer type | # samples |
| p.F276V | PCPG | 4 |
| p.P80L | PCPG | 1 |
| p.P80L | ACC | 1 |
| p.D327Y | HNSC | 1 |
| p.L233F | STAD | 1 |
| p.F276V | ACC | 1 |
| p.C34Y | ACC | 1 |
| p.R343C | CESC | 1 |
| p.A333T | LIHC | 1 |
| p.T26R | PRAD | 1 |
| p.C101Y | SARC | 1 |
| p.S325L | BLCA | 1 |
| Top |
| TissGeneCNV for C2CD4B |
| Copy number variations of TissGene across 28 cancer types (X-axis: cancer type and Y-axis: % of CNV samples) (TCGA Gistic2_CopyNumber_Gistic2_all_data_by_genes, Gistic2 copy number data, version 2016-08-16) |
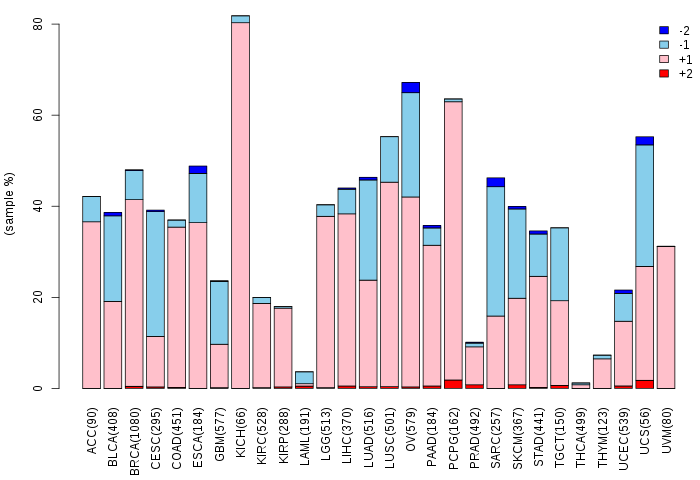 |
| Top |
| TissGeneFusions for C2CD4B |
| Fusion genes including TissGene (ChimerDB 3.0, 2016-12-01 and TCGA fusion Portal 2015-12-01) |
| Database | Src | Cancer type | Sample | Fusion gene | ORF | 5'-gene BP | 3'-gene BP |
| Top |
| TissGeneNet for C2CD4B |
| Co-expressed gene networks based on protein-protein interaction data (CePIN) (TCGA IlluminaHiSeq_RNASeqV2, pan-cancer normalized log2(norm_counts+1) data, version 2016-08-16) (PINA2 ppi data) |
| Top |
| TissGeneProg for C2CD4B |
| Kaplan-Meier plots with logrank tests of overall survival (OS) using 28 cancer types (TCGA IlluminaHiSeq_RNASeqV2, pan-cancer normalized log2(norm_counts+1) data, version 2016-08-16) (TCGA clinicalMatrix, phenotype data, version 2016-04-27) * Click on the image to enlarge it in a new window. |
 |
| Kaplan-Meier plots with logrank test of relapse free survival (RFS) using 28 cancer types (TCGA IlluminaHiSeq_RNASeqV2, pan-cancer normalized log2(norm_counts+1) data, version 2016-08-16) (TCGA clinicalMatrix, phenotype data, version 2016-04-27) * Click on the image enlarge it in a new window. |
 |
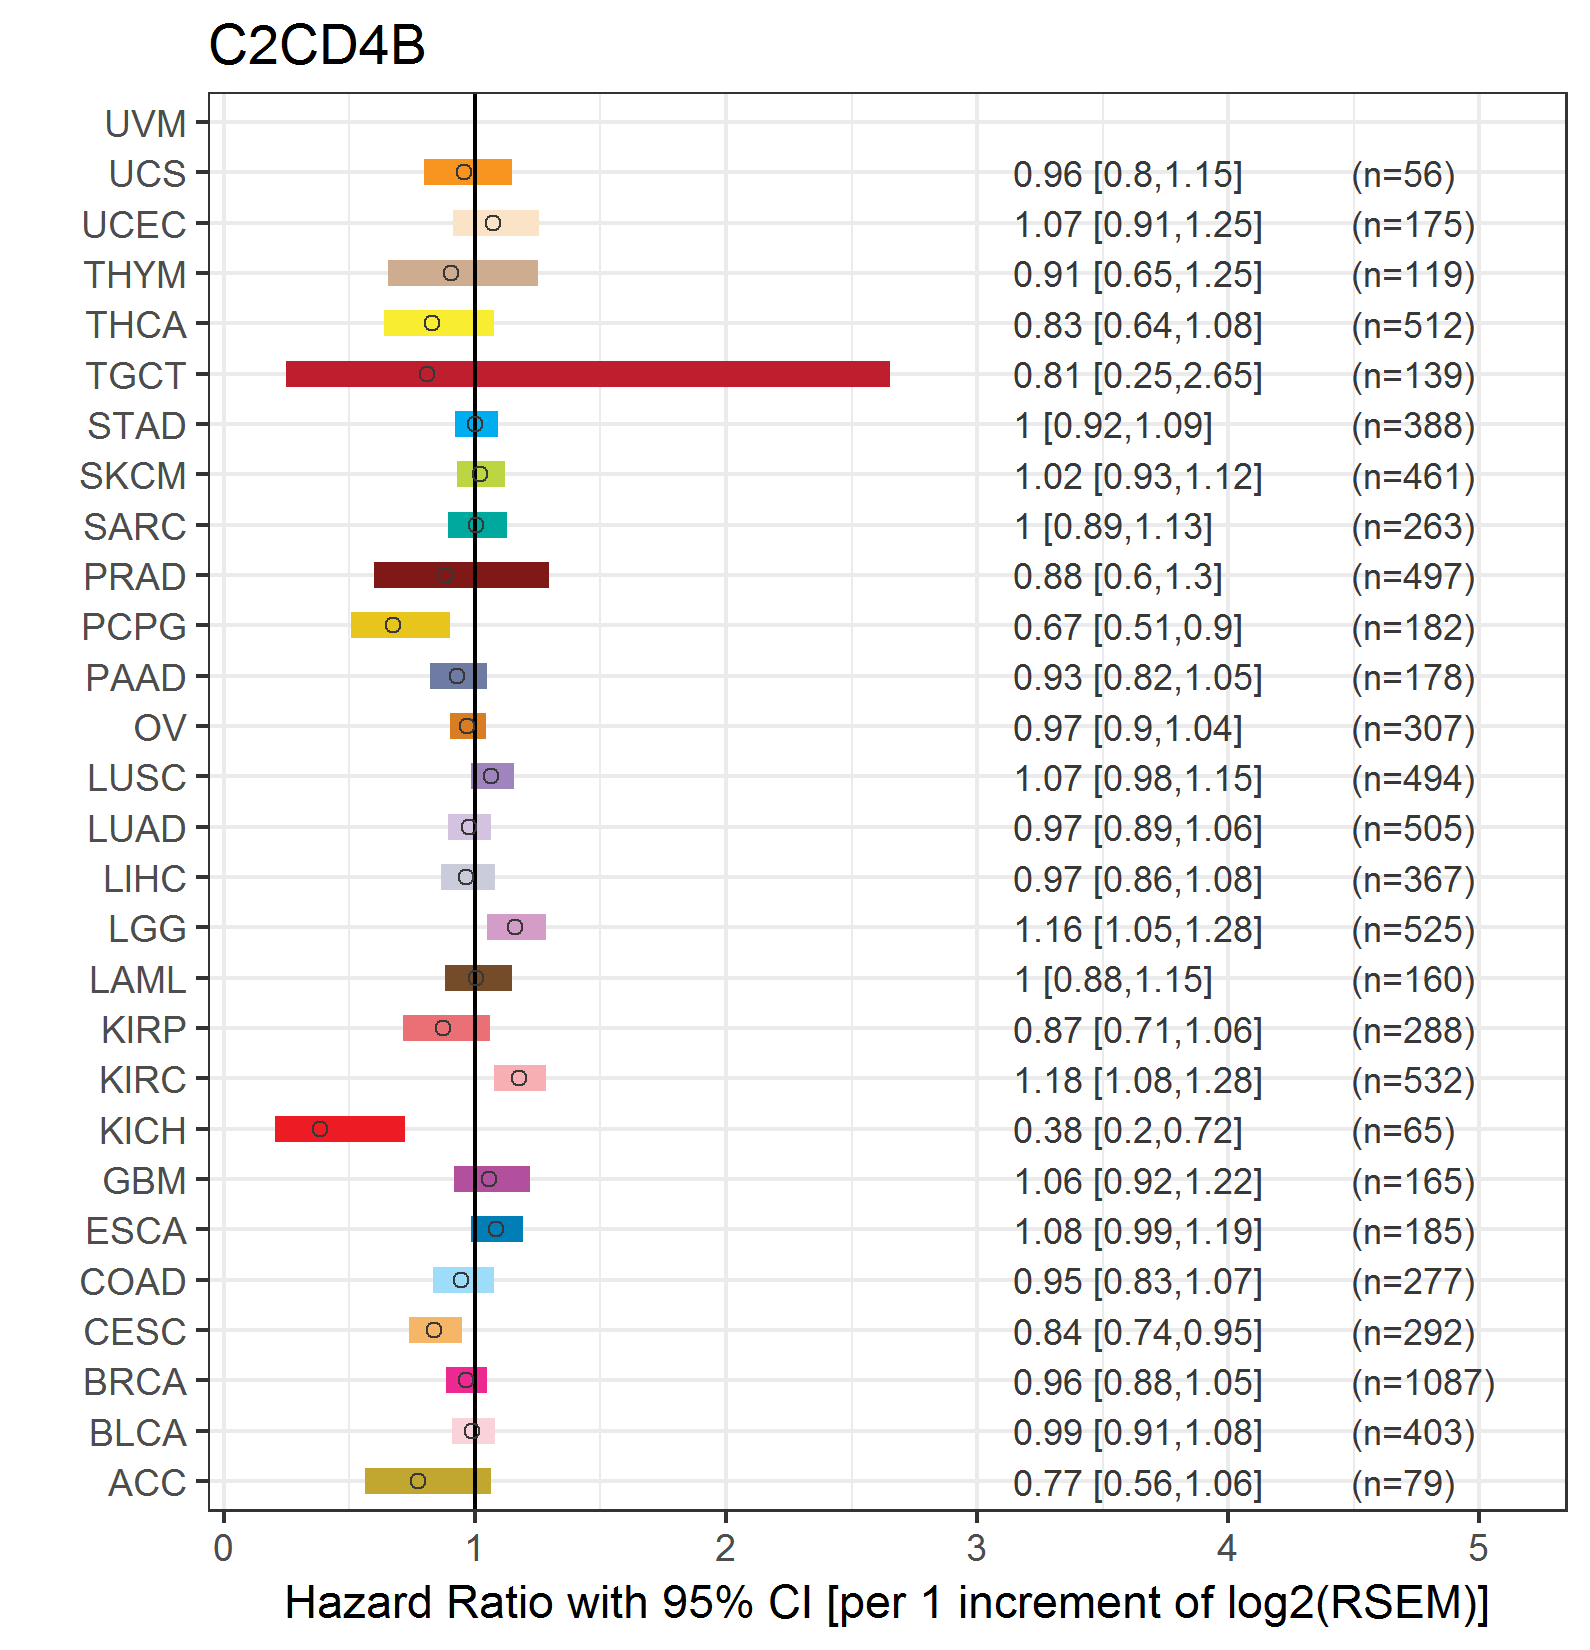
| Forest plot of Cox proportional hazard ratio (HR) and 95% CI of overall survival (OS) using 28 cancer types (TCGA IlluminaHiSeq_RNASeqV2, pan-cancer normalized log2(norm_counts+1) data, version 2016-08-16) (TCGA clinicalMatrix, phenotype data, version 2016-04-27) * Click on the image enlarge it in a new window. |
 |
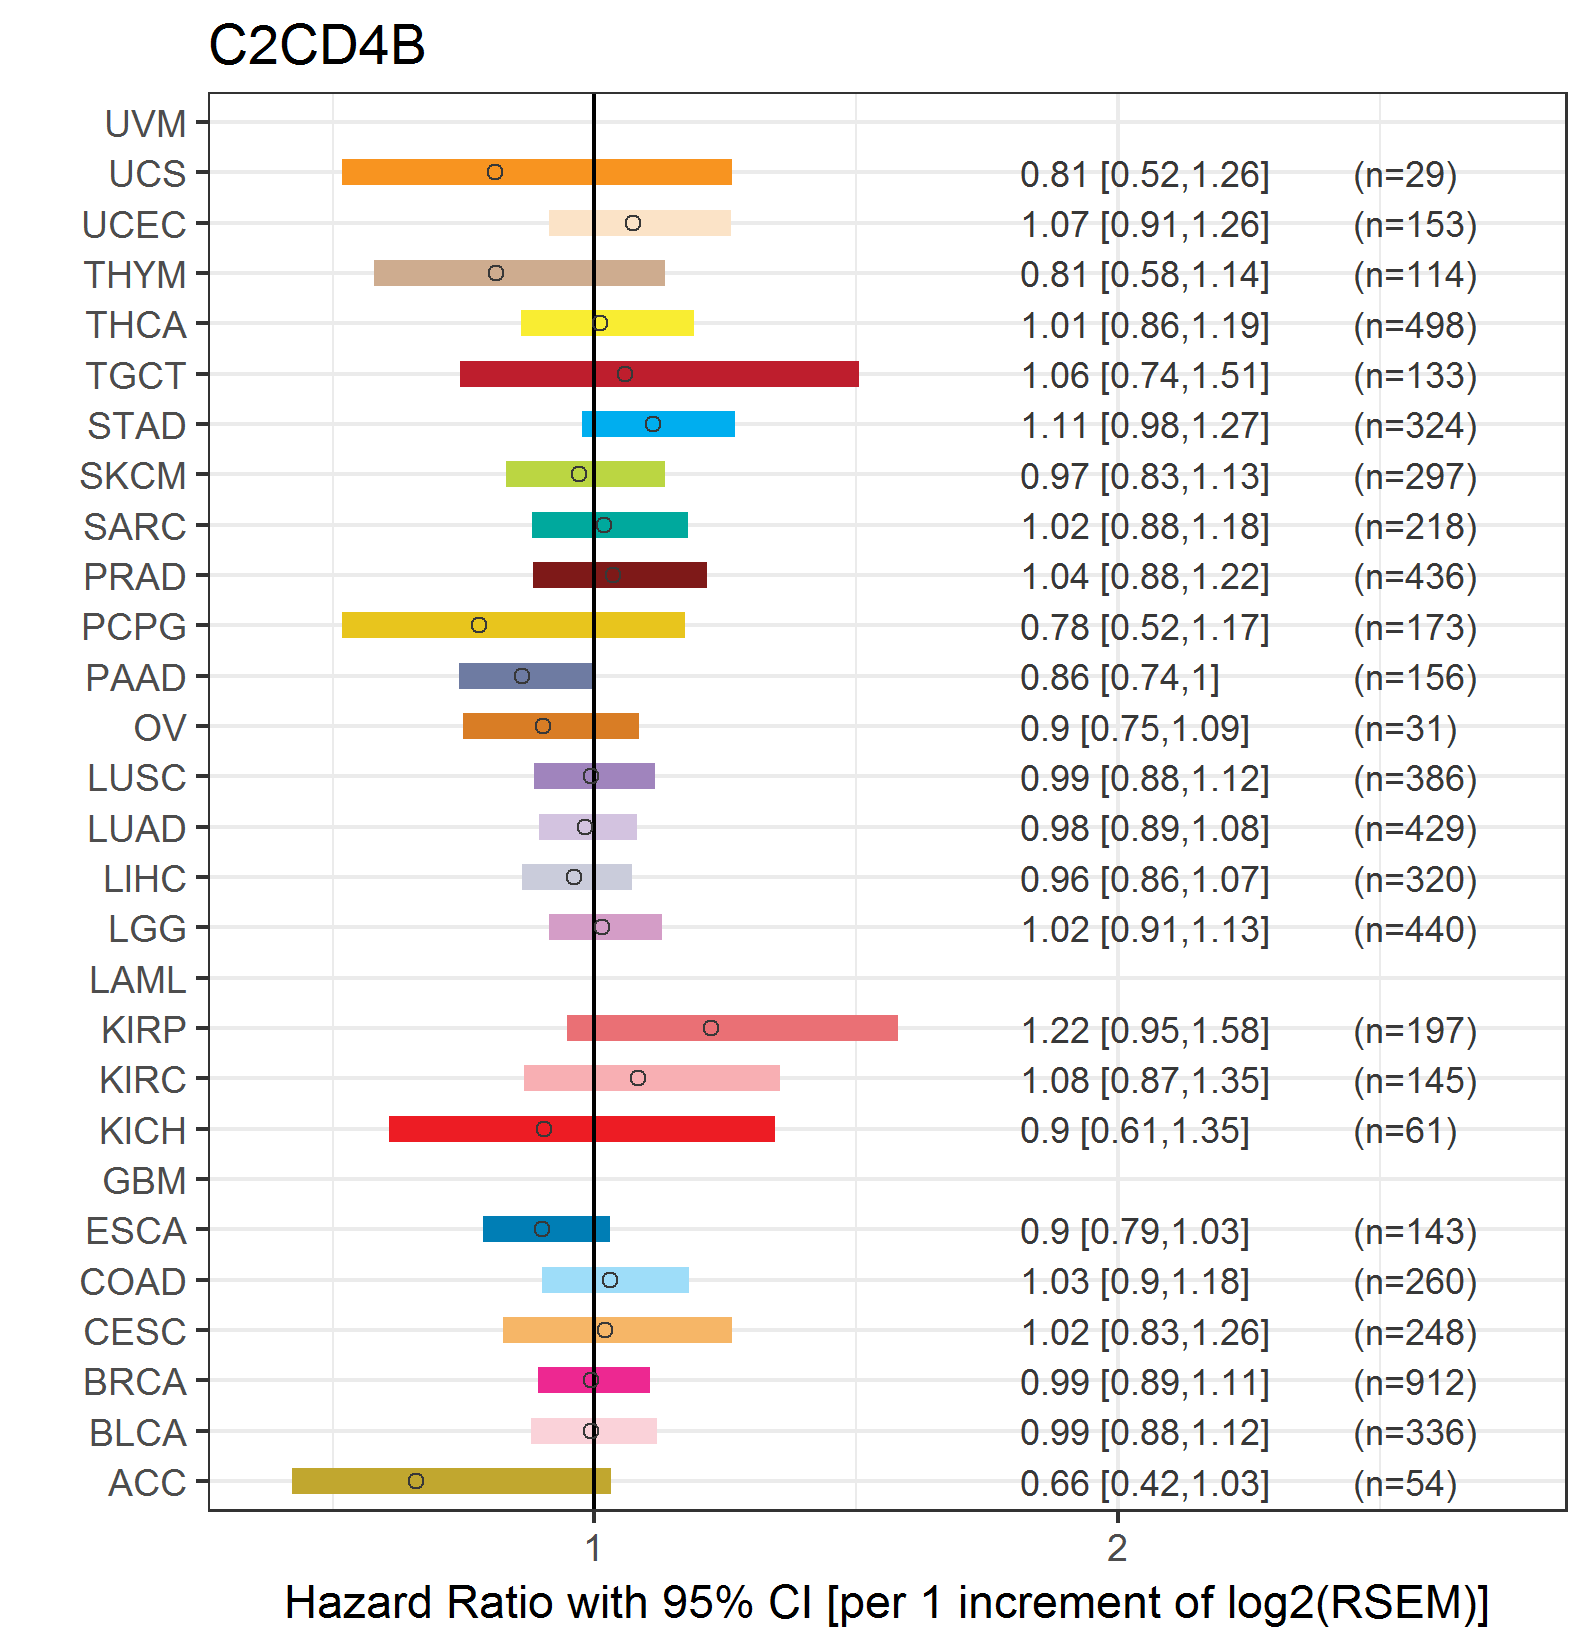
| Forest plot of Cox proportional hazard ratio (HR) and 95% CI of relapse free survival (RFS) using 28 cancer types (TCGA IlluminaHiSeq_RNASeqV2, pan-cancer normalized log2(norm_counts+1) data, version 2016-08-16) (TCGA clinicalMatrix, phenotype data, version 2016-04-27) * Click on the image enlarge it in a new window. |
 |
| Top |
| TissGeneClin for C2CD4B |
| TissGeneDrug for C2CD4B |
| Drug information targeting TissGene (DrugBank Version 5.0.6, 2017-04-01) |
| DrugBank ID | Drug name | Drug activity | Drug type | Drug status |
| Top |
| TissGeneDisease for C2CD4B |
| Disease information associated with TissGene (DisGeNet, 2016-06-01) |
| Disease ID | Disease name | # pubmeds | Source |
| umls:C0011860 | Diabetes Mellitus, Non-Insulin-Dependent | 3 | BeFree,CTD_human,GAD |
| umls:C0011847 | Diabetes | 2 | BeFree |
| umls:C0011849 | Diabetes Mellitus | 2 | BeFree |
| umls:C0007222 | Cardiovascular Diseases | 1 | BeFree |
|
Copyright 2016-Present - The University of Texas Health Science Center at Houston (UTHealth) Web File Viewing | How to Report, Fraud, Waste and Abuse | State of Texas | Statewide Search | Texas Homeland Security | Site Policies |