 |
| |
| |
| |
| |
| |
| |
|

| TissGeneSummary for NPTX1 |
 Gene summary Gene summary |
| Basic gene information | Gene symbol | NPTX1 |
| Gene name | neuronal pentraxin I | |
| Synonyms | NP1 | |
| Cytomap | UCSC genome browser: 17q25.3 | |
| Type of gene | protein-coding | |
| RefGenes | NM_002522.3, | |
| Description | NP-Ineuronal pentraxin-1 | |
| Modification date | 20141207 | |
| dbXrefs | MIM : 602367 | |
| HGNC : HGNC | ||
| Ensembl : ENSG00000171246 | ||
| HPRD : 03843 | ||
| Vega : OTTHUMG00000177607 | ||
| Protein | UniProt: go to UniProt's Cross Reference DB Table | |
| Expression | CleanEX: HS_NPTX1 | |
| BioGPS: 4884 | ||
| Pathway | NCI Pathway Interaction Database: NPTX1 | |
| KEGG: NPTX1 | ||
| REACTOME: NPTX1 | ||
| Pathway Commons: NPTX1 | ||
| Context | iHOP: NPTX1 | |
| ligand binding site mutation search in PubMed: NPTX1 | ||
| UCL Cancer Institute: NPTX1 | ||
| Assigned class in TissGDB* | C | |
| Included tissue-specific gene expression resources | HPA,TiGER | |
| Specific-tissues in normal samples (assigned by TissGDB using HPA, TiGER, and GTEx) | Brain | |
| Cancer types related to the specific-tissues in cancer samples (assigned by TissGDB using TCGA) | GBM,LGG | |
| Reference showing the relevant tissue of NPTX1 | ||
| Description by TissGene annotations | ||
| * Class A consists of genes with literature evidence and is part of the cTissGenes. Class B consists of only cTissGenes without additional evidence. The remaining genes belong to Class C. |
| Gene ontology having evidence of Inferred from Direct Assay (IDA) from Entrez |
| GO ID | GO term | PubMed ID |
| Top |
| TissGeneExp for NPTX1 |
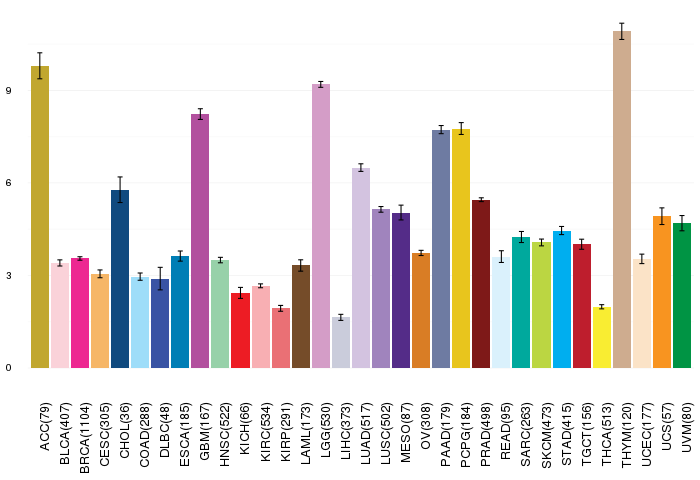
| Gene expressions across 28 cancer types (X-axis: cancer type and Y-axis: log2(norm_counts+1)) (TCGA IlluminaHiSeq_RNASeqV2, pan-cancer normalized log2(norm_counts+1) data, version 2016-08-16) |
 |
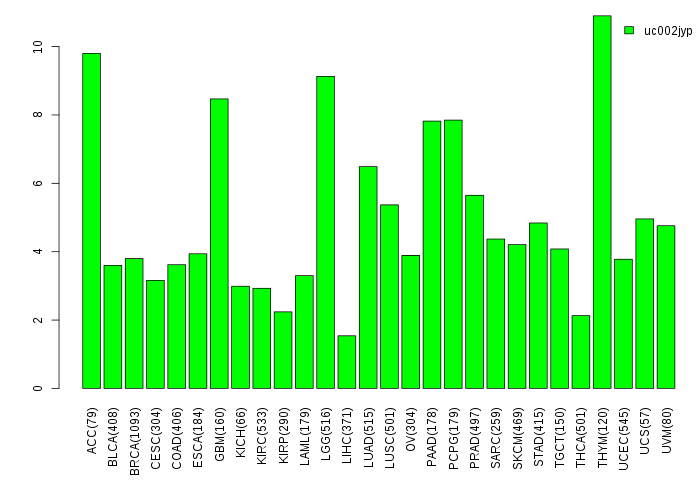
| Gene isoform expressions across 28 cancer types (X-axis: cancer type and Y-axis: log2(norm_counts+1)) (TCGA pan-cancer tcga_rsem_isoform_tpm, version 2016-09-01) |
 |
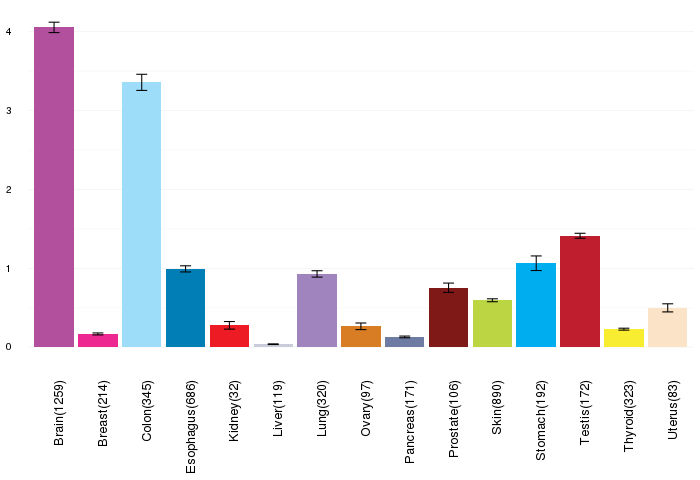
| Gene expressions across normal tissues of GTEx data (GTEx GTEx_Analysis_v6_RNA-seq_RNA-SeQCv1.1.8_gene_rpkm.gct) - Here, we shows the matched tissue types only among our 28 cancer types. |
 |
| Different expressions across 14 cancer types with more than 10 samples between matched tumors and normals (X-axis: cancer type and Y-axis: log2(norm_counts+1)) (TCGA IlluminaHiSeq_RNASeqV2, pan-cancer normalized log2(norm_counts+1) data, version 2016-08-16) |
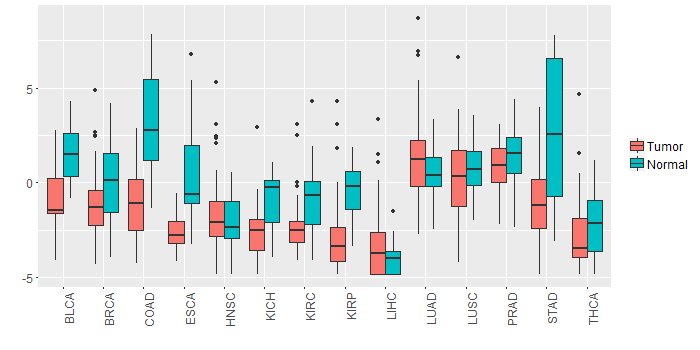 |
| - Significantly differentially expressed cancer types and information. (|Fold change|>1 and FDR<0.05) |
| Cancer type | Mean(exp) in tumor | Mean(exp) in matched normal | Log2FC | P-val. | FDR |
| STAD | -1.116297866 | 2.635020884 | -3.75131875 | 4.28E-06 | 5.56E-05 |
| KIRP | -2.704385366 | -0.438479116 | -2.26590625 | 7.48E-06 | 3.21E-05 |
| COAD | -1.069570943 | 3.142532903 | -4.212103846 | 3.80E-08 | 2.94E-07 |
| KIRC | -2.421603421 | -0.965863144 | -1.455740278 | 8.73E-09 | 2.67E-08 |
| BRCA | -1.289042603 | 0.019089854 | -1.308132456 | 5.80E-08 | 1.78E-07 |
| ESCA | -2.61709332 | 0.720070316 | -3.337163636 | 0.00571 | 0.042902162 |
| BLCA | -0.798163655 | 1.42317845 | -2.221342105 | 0.000162 | 0.001637673 |
| KICH | -2.490583866 | -0.935063866 | -1.55552 | 0.000624 | 0.001400505 |
| Top |
| TissGene-miRNA for NPTX1 |
| Significantly anti-correlated miRNAs of TissGene across 28 cancer types (Gene-miRNA relations from TargetScanHuman Relsease 7.1, Conserved_Site_Context_Scores.txt.zip, 06.01.2016) (TCGA IlluminaHiSeq_miRNASeq, log2(RPM+1) data, version 2016-11-21) (TCGA IlluminaHiSeq_RNASeqV2, log2(normalized_count+1) data, version 2016-08-16) (Spearman’s Rank Correlation (p-value<0.05 and coefficient<-0.25)) |
| Cancer type | miRNA id | miRNA accession | P-val. | Coeff. | # samples |
| LUAD | hsa-miR-301a-3p | MIMAT0000688 | 0.046 | -0.26 | 60 |
| Top |
| TissGeneMut for NPTX1 |
| TissGeneSNV for NPTX1 |
| nsSNV counts per each loci. Different colors of circles represent different cancer types. Circle size denotes number of samples. (TCGA somatic mutation (SNPs and small INDELs) data, version 2016-04-25) * Click on the image to enlarge it in a new window. |
 |
 |
| Somatic nucleotide variants of TissGene across 28 cancer types (X-axis: cancer type and Y-axis: % of mutated samples) The numbers in parentheses are numbers of samples with mutation (nsSNVs). (TCGA somatic mutation (SNPs and small INDELs) data, version 2016-04-25) |
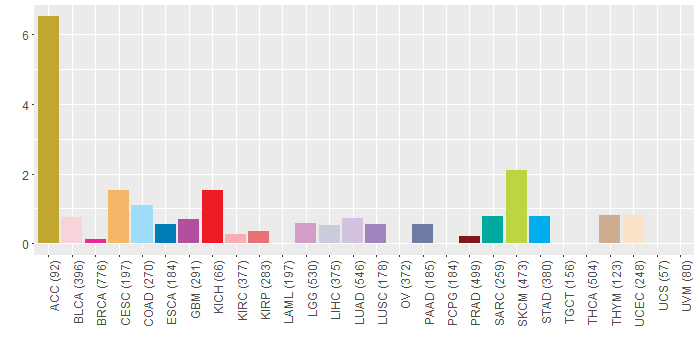 |
| - nsSNVs sorted by frequency. |
| AAchange | Cancer type | # samples |
| p.G100D | ACC | 5 |
| p.G100D | COAD | 2 |
| p.G100D | READ | 2 |
| p.A263T | GBM | 2 |
| p.R235Q | STAD | 1 |
| p.V181G | KICH | 1 |
| p.G351S | SKCM | 1 |
| p.T206N | PRAD | 1 |
| p.K163N | UCEC | 1 |
| p.E339K | SKCM | 1 |
| p.H378N | THYM | 1 |
| p.Q357K | KIRC | 1 |
| p.G364C | READ | 1 |
| p.A410T | LGG | 1 |
| p.G112S | SKCM | 1 |
| p.P388L | SKCM | 1 |
| p.A263T | LGG | 1 |
| p.M250K | BRCA | 1 |
| p.G389W | LUAD | 1 |
| p.R384H | COAD | 1 |
| p.S113L | STAD | 1 |
| p.D171N | CESC | 1 |
| p.Q135H | MESO | 1 |
| p.G324E | SKCM | 1 |
| p.A252T | BLCA | 1 |
| p.G324R | ESCA | 1 |
| p.G324W | LIHC | 1 |
| p.L162F | UCEC | 1 |
| p.F25I | ACC | 1 |
| p.Q330X | SKCM | 1 |
| p.D331N | SKCM | 1 |
| p.Q330* | SKCM | 1 |
| p.R429L | LUAD | 1 |
| p.F253S | SARC | 1 |
| p.G335C | STAD | 1 |
| p.S261F | SKCM | 1 |
| p.G225V | BLCA | 1 |
| p.E293K | SKCM | 1 |
| p.G225E | BLCA | 1 |
| p.E281Q | HNSC | 1 |
| p.T195I | PAAD | 1 |
| p.G389E | SARC | 1 |
| p.D171H | HNSC | 1 |
| p.D164H | LUSC | 1 |
| p.G419V | KIRP | 1 |
| p.V352M | LUAD | 1 |
| p.L376R | LUAD | 1 |
| p.Q167* | CESC | 1 |
| p.Q23L | LIHC | 1 |
| p.G418R | LGG | 1 |
| p.H345Y | CESC | 1 |
| p.A420V | SKCM | 1 |
| Top |
| TissGeneCNV for NPTX1 |
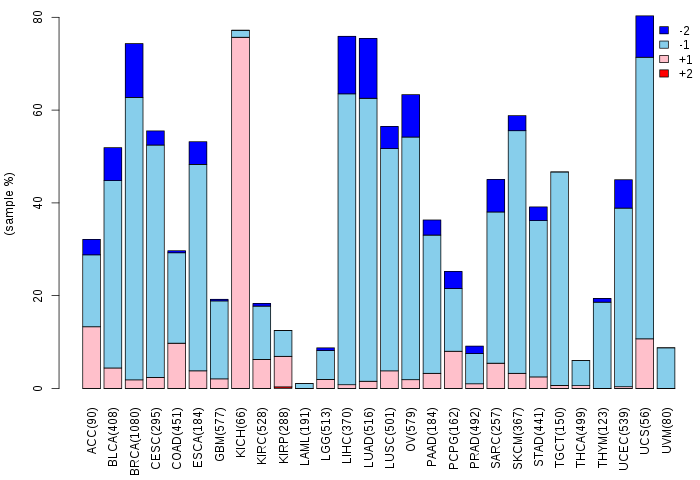
| Copy number variations of TissGene across 28 cancer types (X-axis: cancer type and Y-axis: % of CNV samples) (TCGA Gistic2_CopyNumber_Gistic2_all_data_by_genes, Gistic2 copy number data, version 2016-08-16) |
 |
| Top |
| TissGeneFusions for NPTX1 |
| Fusion genes including TissGene (ChimerDB 3.0, 2016-12-01 and TCGA fusion Portal 2015-12-01) |
| Database | Src | Cancer type | Sample | Fusion gene | ORF | 5'-gene BP | 3'-gene BP |
| Chimerdb3.0 | ChiTaRs | NA | DB469323 | NPTX1-NPTX1 | chr17:78442410 | chr17:78443253 |
| Top |
| TissGeneNet for NPTX1 |
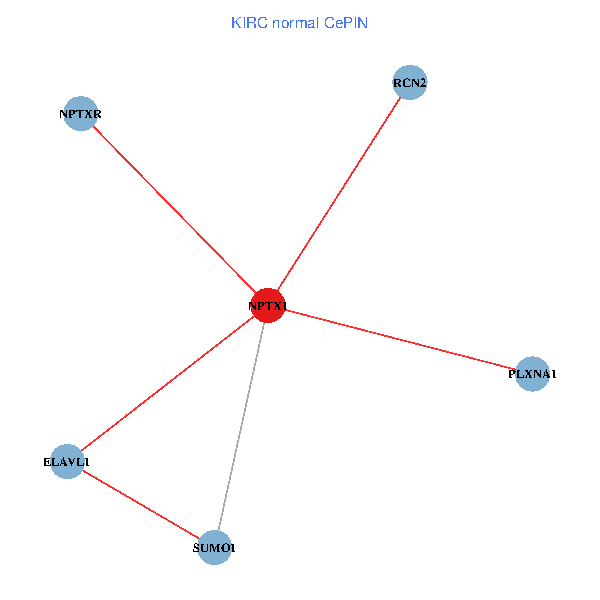
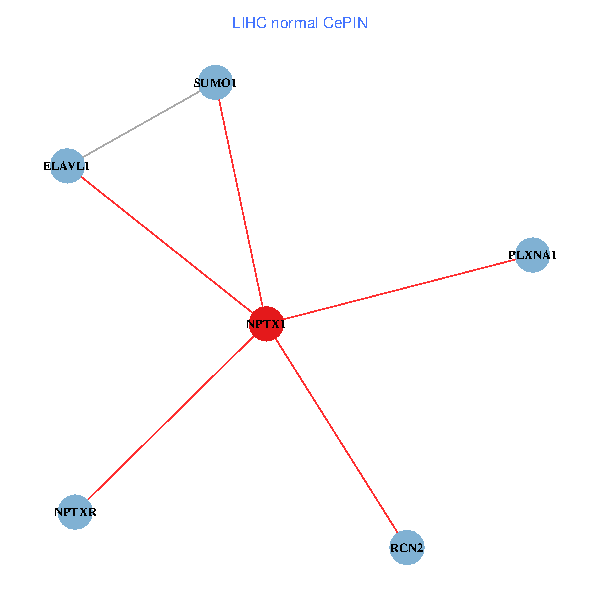
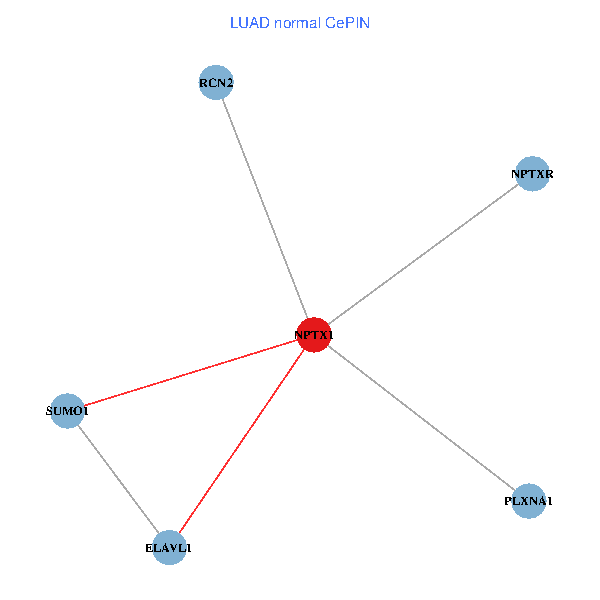
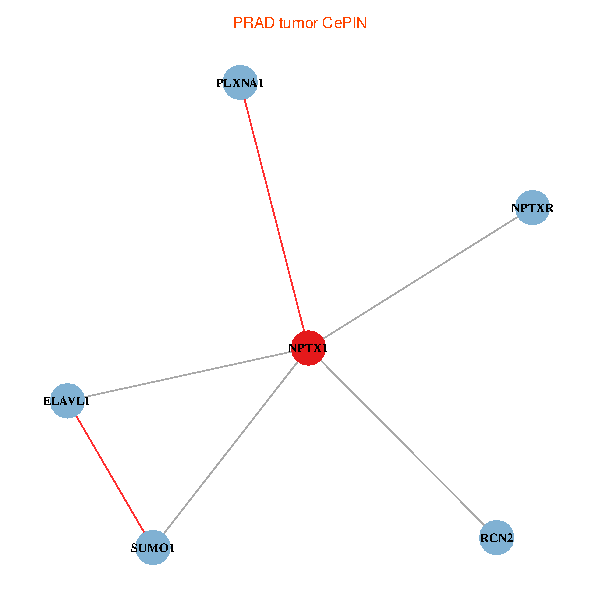
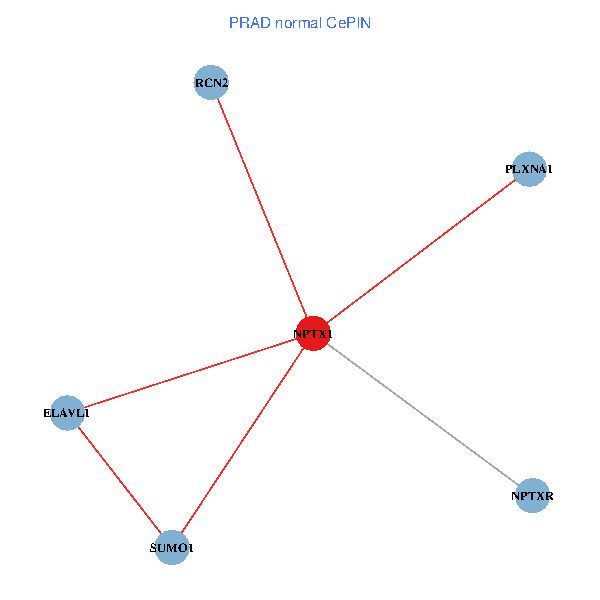
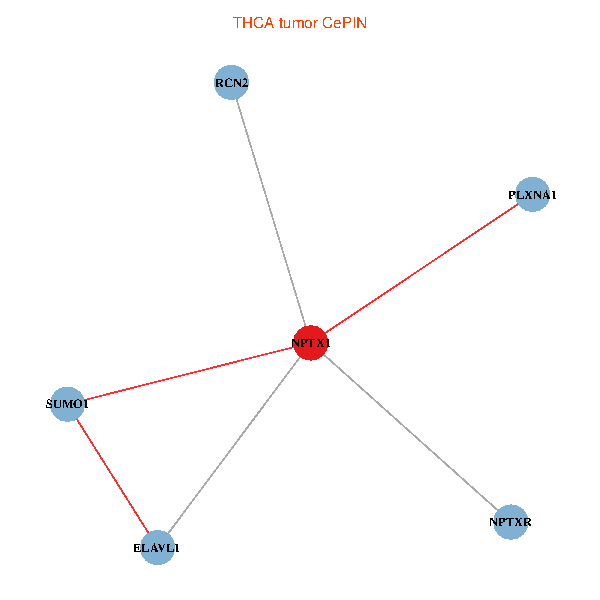
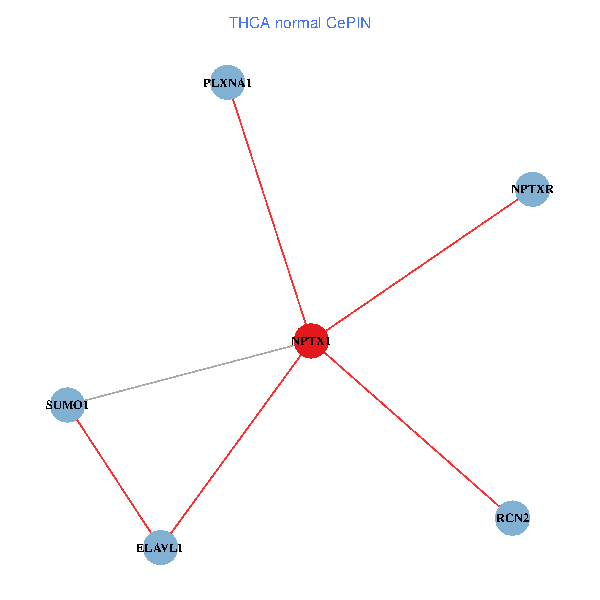
| Co-expressed gene networks based on protein-protein interaction data (CePIN) (TCGA IlluminaHiSeq_RNASeqV2, pan-cancer normalized log2(norm_counts+1) data, version 2016-08-16) (PINA2 ppi data) |
| BRCA (tumor) | BRCA (normal) |
| NPTX1, ELAVL1, SUMO1, PLXNA1, NPTXR, RCN2 (tumor) | NPTX1, ELAVL1, SUMO1, PLXNA1, NPTXR, RCN2 (normal) |
 |  |
| COAD (tumor) | COAD (normal) |
| NPTX1, ELAVL1, SUMO1, PLXNA1, NPTXR, RCN2 (tumor) | NPTX1, ELAVL1, SUMO1, PLXNA1, NPTXR, RCN2 (normal) |
 |  |
| HNSC (tumor) | HNSC (normal) |
| NPTX1, ELAVL1, SUMO1, PLXNA1, NPTXR, RCN2 (tumor) | NPTX1, ELAVL1, SUMO1, PLXNA1, NPTXR, RCN2 (normal) |
 |  |
| KICH (tumor) | KICH (normal) |
| NPTX1, ELAVL1, SUMO1, PLXNA1, NPTXR, RCN2 (tumor) | NPTX1, ELAVL1, SUMO1, PLXNA1, NPTXR, RCN2 (normal) |
 |  |
| KIRC (tumor) | KIRC (normal) |
| NPTX1, ELAVL1, SUMO1, PLXNA1, NPTXR, RCN2 (tumor) | NPTX1, ELAVL1, SUMO1, PLXNA1, NPTXR, RCN2 (normal) |
 |  |
| KIRP (tumor) | KIRP (normal) |
| NPTX1, ELAVL1, SUMO1, PLXNA1, NPTXR, RCN2 (tumor) | NPTX1, ELAVL1, SUMO1, PLXNA1, NPTXR, RCN2 (normal) |
 |  |
| LIHC (tumor) | LIHC (normal) |
| NPTX1, ELAVL1, SUMO1, PLXNA1, NPTXR, RCN2 (tumor) | NPTX1, ELAVL1, SUMO1, PLXNA1, NPTXR, RCN2 (normal) |
 |  |
| LUAD (tumor) | LUAD (normal) |
| NPTX1, ELAVL1, SUMO1, PLXNA1, NPTXR, RCN2 (tumor) | NPTX1, ELAVL1, SUMO1, PLXNA1, NPTXR, RCN2 (normal) |
 |  |
| LUSC (tumor) | LUSC (normal) |
| NPTX1, ELAVL1, SUMO1, PLXNA1, NPTXR, RCN2 (tumor) | NPTX1, ELAVL1, SUMO1, PLXNA1, NPTXR, RCN2 (normal) |
 |  |
| PRAD (tumor) | PRAD (normal) |
| NPTX1, ELAVL1, SUMO1, PLXNA1, NPTXR, RCN2 (tumor) | NPTX1, ELAVL1, SUMO1, PLXNA1, NPTXR, RCN2 (normal) |
 |  |
| STAD (tumor) | STAD (normal) |
| NPTX1, ELAVL1, SUMO1, PLXNA1, NPTXR, RCN2 (tumor) | NPTX1, ELAVL1, SUMO1, PLXNA1, NPTXR, RCN2 (normal) |
 |  |
| THCA (tumor) | THCA (normal) |
| NPTX1, ELAVL1, SUMO1, PLXNA1, NPTXR, RCN2 (tumor) | NPTX1, ELAVL1, SUMO1, PLXNA1, NPTXR, RCN2 (normal) |
 |  |
| Top |
| TissGeneProg for NPTX1 |
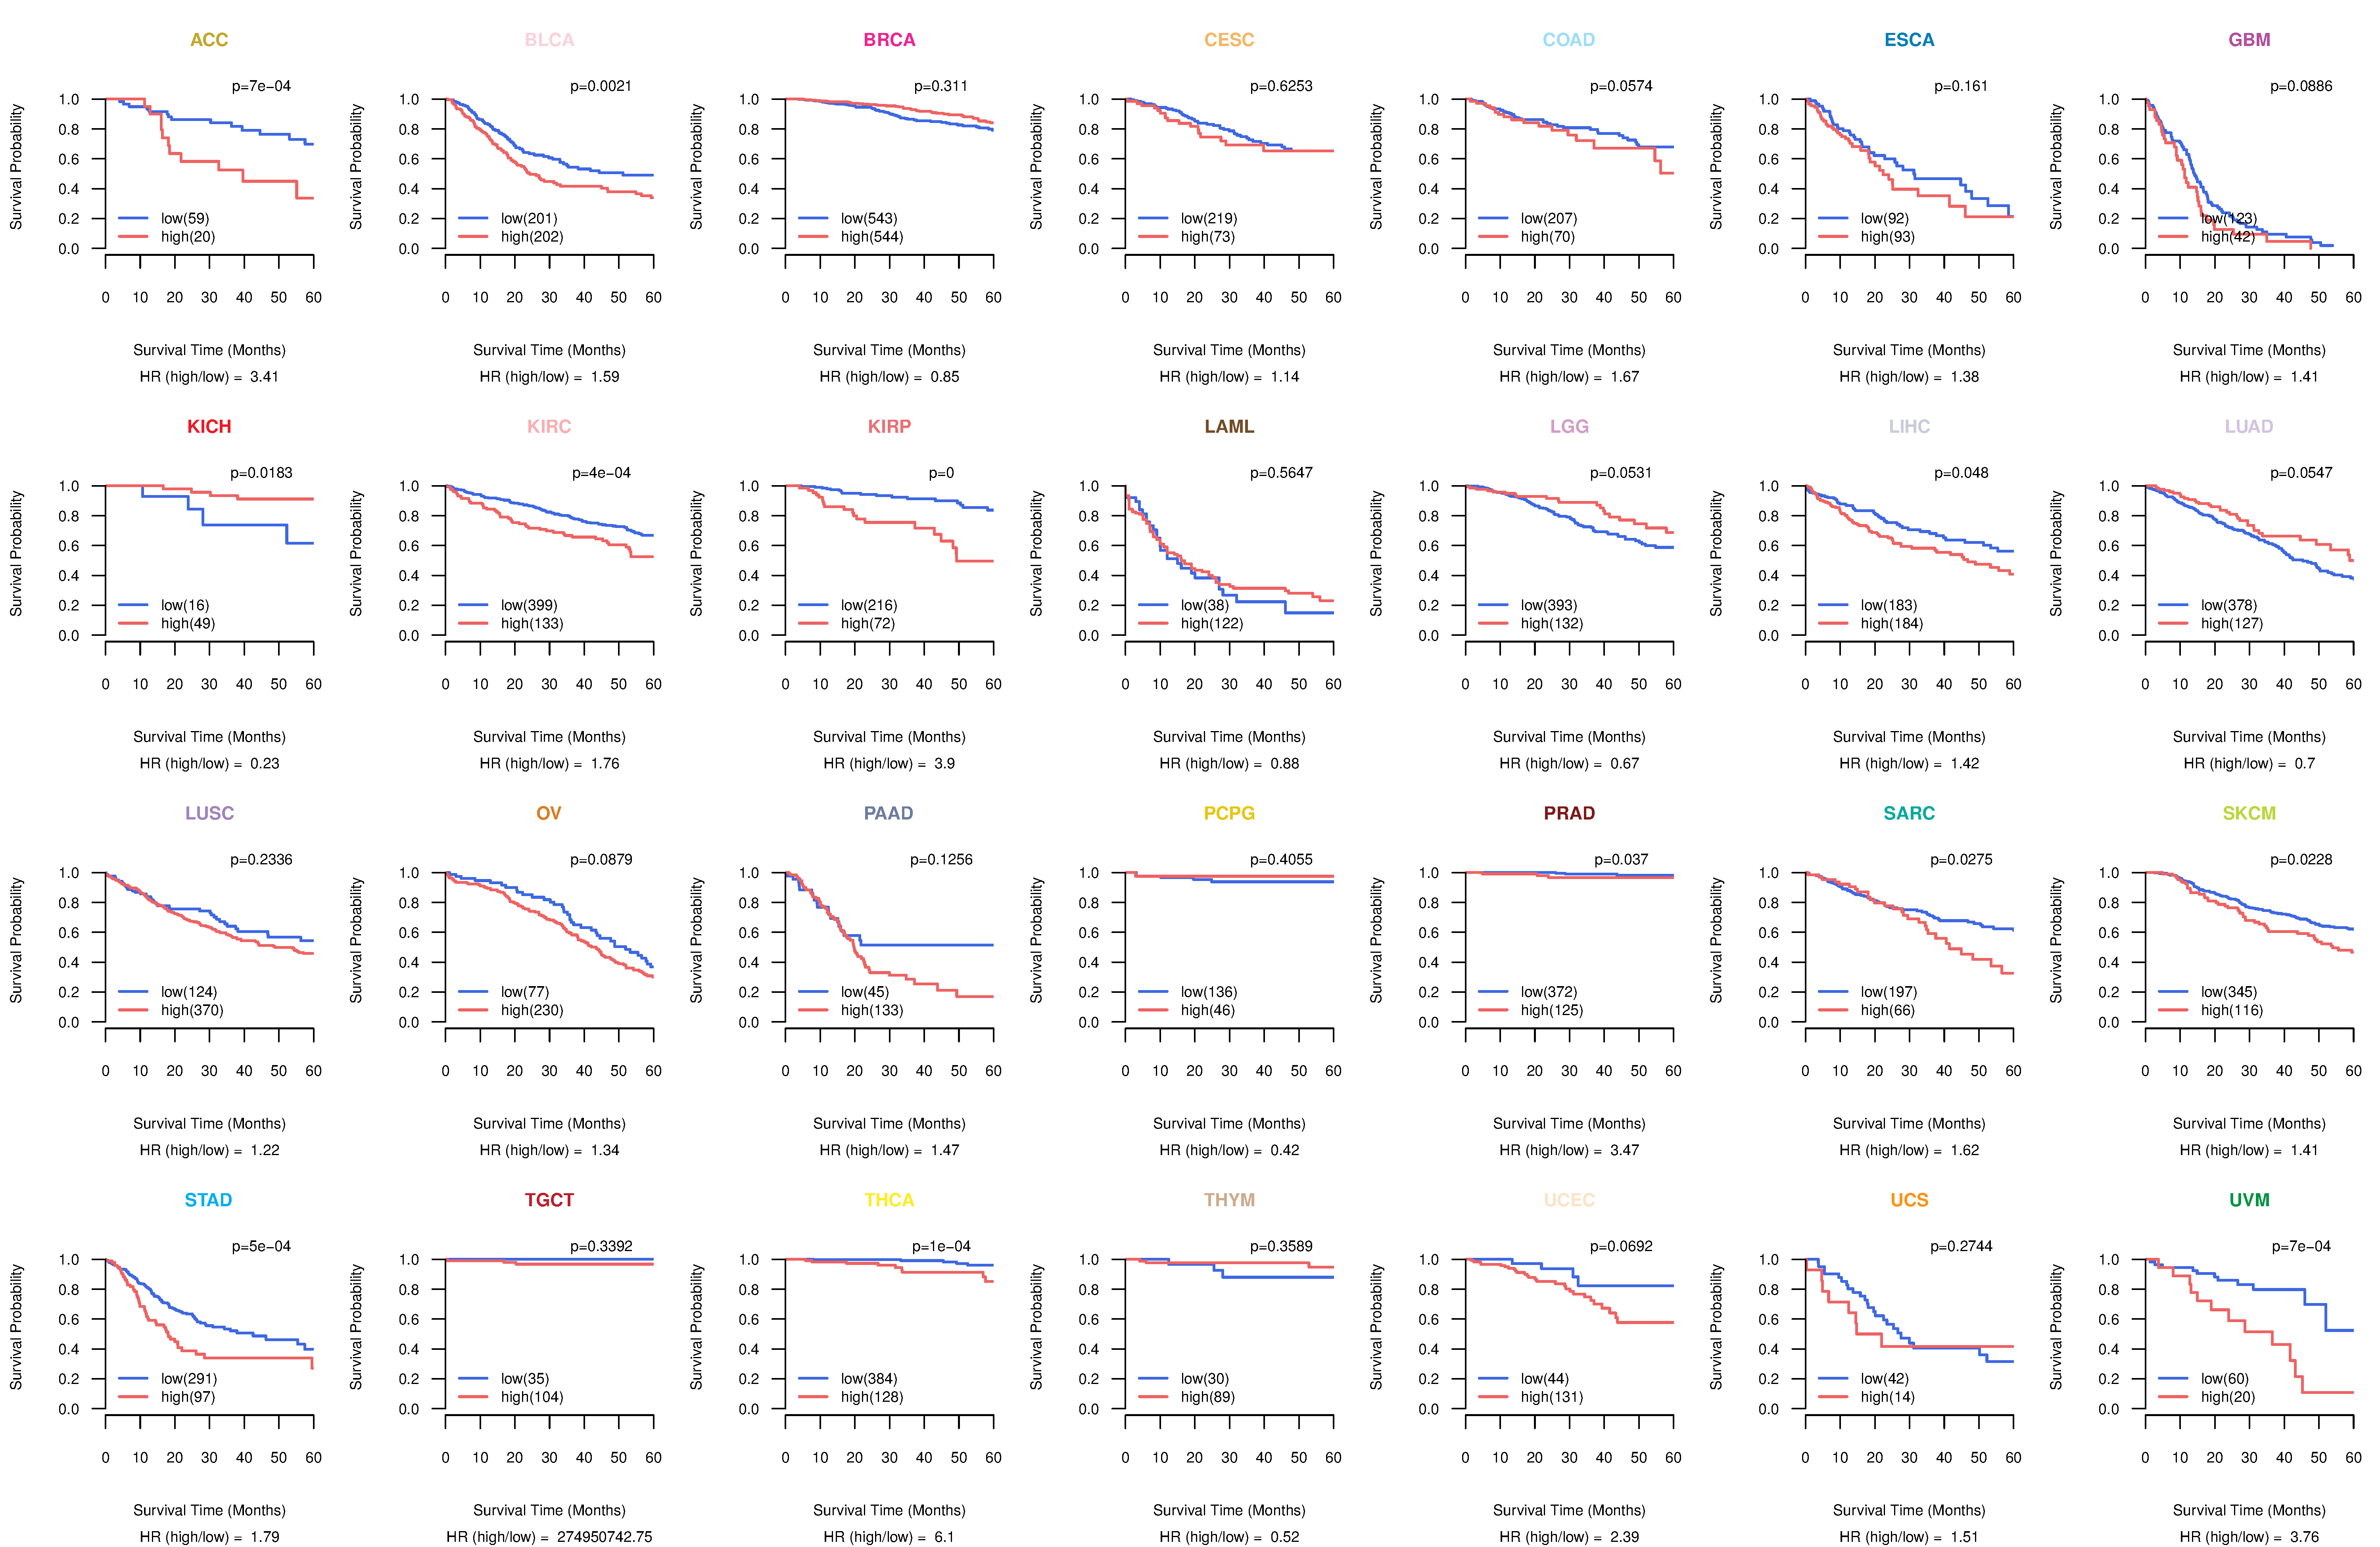
| Kaplan-Meier plots with logrank tests of overall survival (OS) using 28 cancer types (TCGA IlluminaHiSeq_RNASeqV2, pan-cancer normalized log2(norm_counts+1) data, version 2016-08-16) (TCGA clinicalMatrix, phenotype data, version 2016-04-27) * Click on the image to enlarge it in a new window. |
 |
| Kaplan-Meier plots with logrank test of relapse free survival (RFS) using 28 cancer types (TCGA IlluminaHiSeq_RNASeqV2, pan-cancer normalized log2(norm_counts+1) data, version 2016-08-16) (TCGA clinicalMatrix, phenotype data, version 2016-04-27) * Click on the image enlarge it in a new window. |
 |
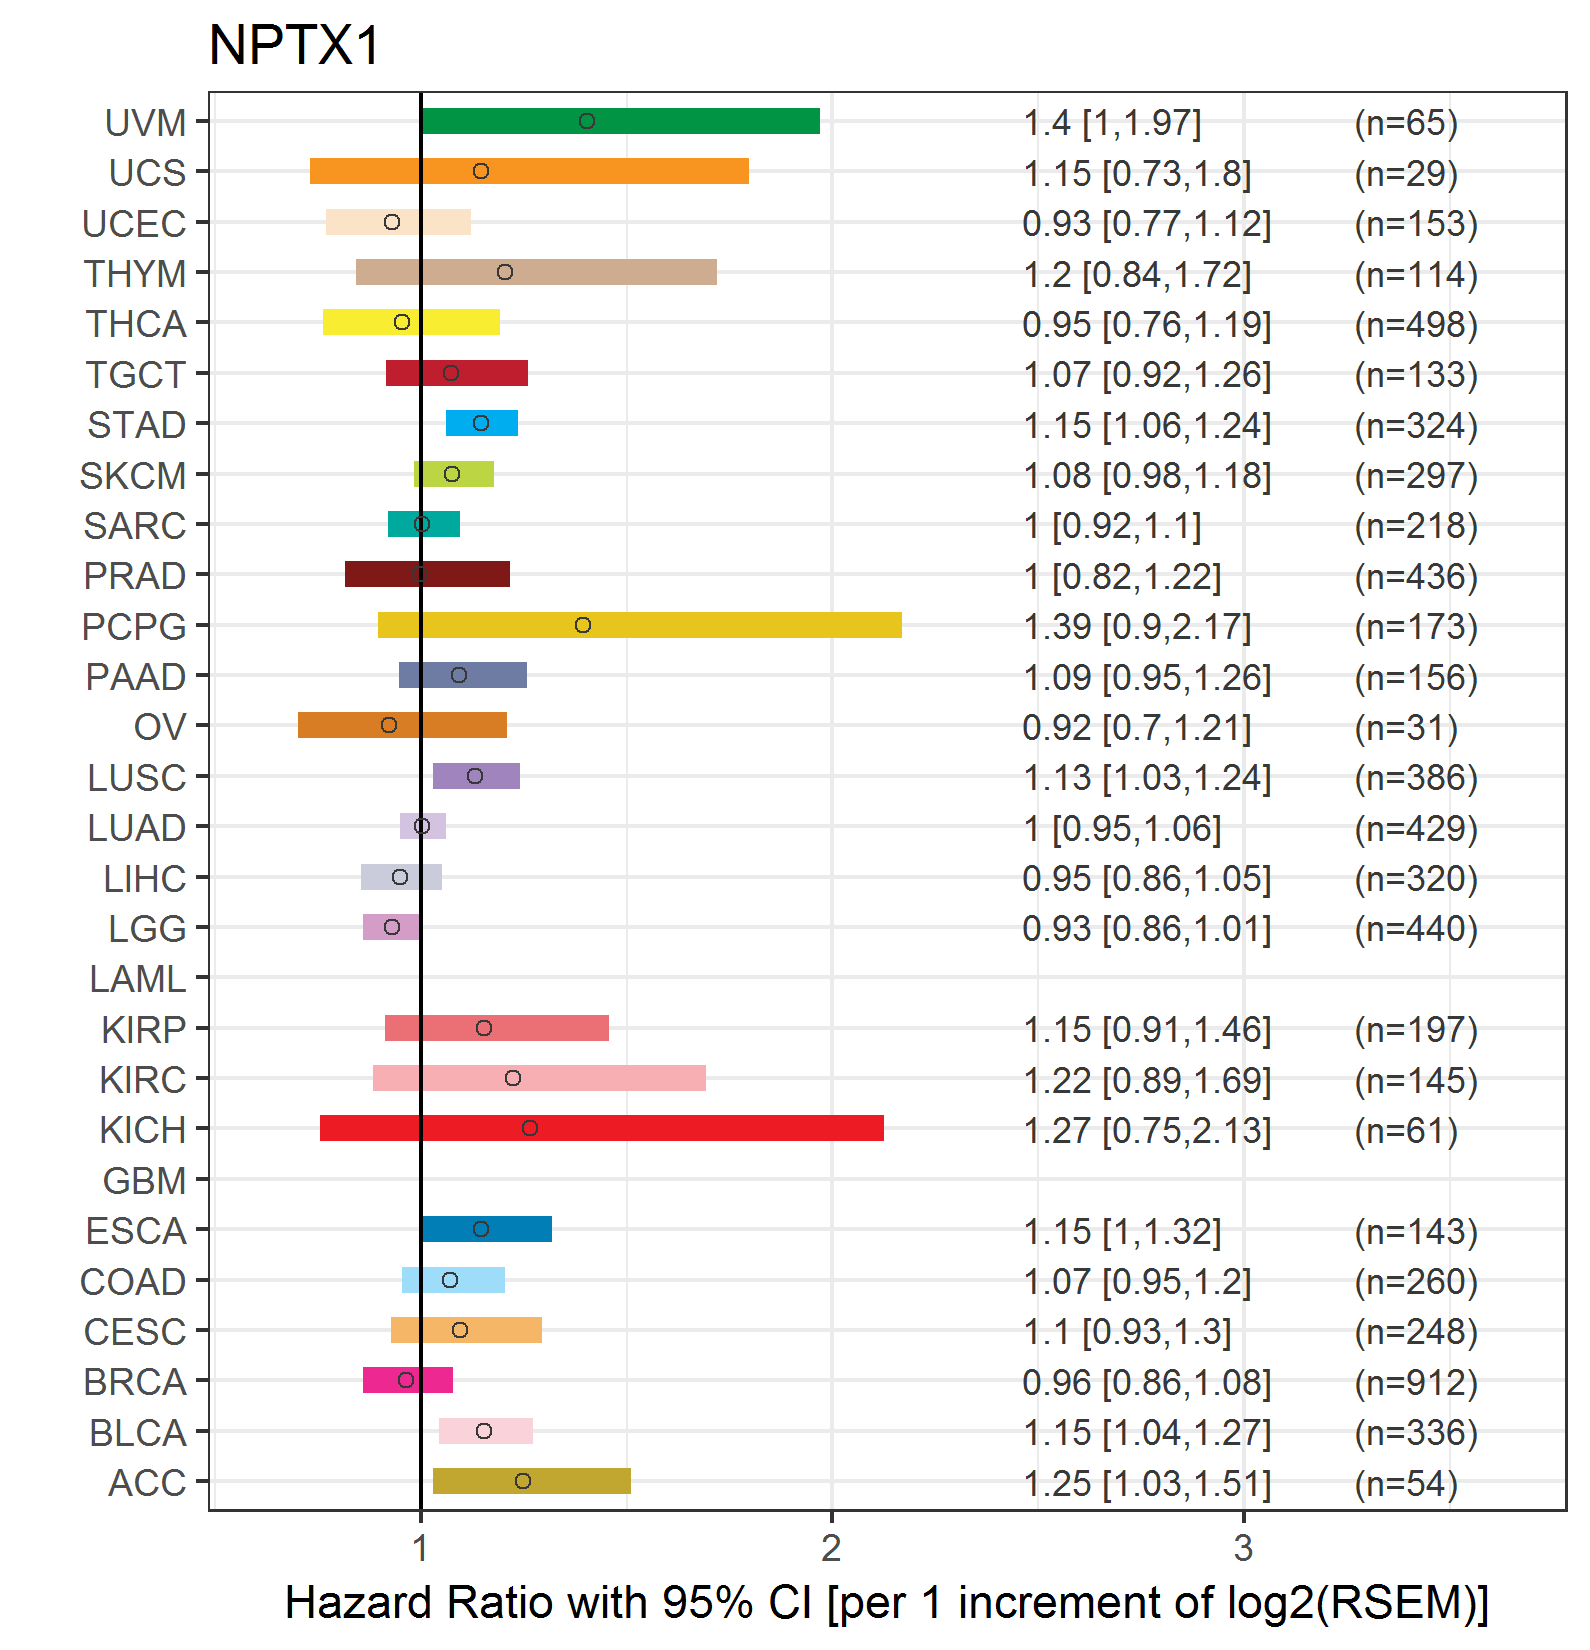
| Forest plot of Cox proportional hazard ratio (HR) and 95% CI of overall survival (OS) using 28 cancer types (TCGA IlluminaHiSeq_RNASeqV2, pan-cancer normalized log2(norm_counts+1) data, version 2016-08-16) (TCGA clinicalMatrix, phenotype data, version 2016-04-27) * Click on the image enlarge it in a new window. |
 |
| Forest plot of Cox proportional hazard ratio (HR) and 95% CI of relapse free survival (RFS) using 28 cancer types (TCGA IlluminaHiSeq_RNASeqV2, pan-cancer normalized log2(norm_counts+1) data, version 2016-08-16) (TCGA clinicalMatrix, phenotype data, version 2016-04-27) * Click on the image enlarge it in a new window. |
 |
| Top |
| TissGeneClin for NPTX1 |
| TissGeneDrug for NPTX1 |
| Drug information targeting TissGene (DrugBank Version 5.0.6, 2017-04-01) |
| DrugBank ID | Drug name | Drug activity | Drug type | Drug status |
| Top |
| TissGeneDisease for NPTX1 |
| Disease information associated with TissGene (DisGeNet, 2016-06-01) |
| Disease ID | Disease name | # pubmeds | Source |
| umls:C0007847 | Malignant tumor of cervix | 1 | BeFree |
| umls:C0149925 | Small cell carcinoma of lung | 1 | BeFree |
| umls:C0242379 | Malignant neoplasm of lung | 1 | BeFree |
| umls:C0302592 | Cervix carcinoma | 1 | BeFree |
| umls:C0684249 | Carcinoma of lung | 1 | BeFree |
| umls:C1527249 | Colorectal Cancer | 1 | BeFree |
| umls:C1709246 | Non-Neoplastic Disorder | 1 | BeFree |
|
Copyright 2016-Present - The University of Texas Health Science Center at Houston (UTHealth) Web File Viewing | How to Report, Fraud, Waste and Abuse | State of Texas | Statewide Search | Texas Homeland Security | Site Policies |