 |
| |
| |
| |
| |
| |
| |
|

| TissGeneSummary for CEND1 |
 Gene summary Gene summary |
| Basic gene information | Gene symbol | CEND1 |
| Gene name | cell cycle exit and neuronal differentiation 1 | |
| Synonyms | BM88 | |
| Cytomap | UCSC genome browser: 11p15.5 | |
| Type of gene | protein-coding | |
| RefGenes | NM_016564.3, | |
| Description | BM88 antigencell cycle exit and neuronal differentiation protein 1 | |
| Modification date | 20141207 | |
| dbXrefs | MIM : 608213 | |
| HGNC : HGNC | ||
| Ensembl : ENSG00000184524 | ||
| HPRD : 16300 | ||
| Vega : OTTHUMG00000133308 | ||
| Protein | UniProt: go to UniProt's Cross Reference DB Table | |
| Expression | CleanEX: HS_CEND1 | |
| BioGPS: 51286 | ||
| Pathway | NCI Pathway Interaction Database: CEND1 | |
| KEGG: CEND1 | ||
| REACTOME: CEND1 | ||
| Pathway Commons: CEND1 | ||
| Context | iHOP: CEND1 | |
| ligand binding site mutation search in PubMed: CEND1 | ||
| UCL Cancer Institute: CEND1 | ||
| Assigned class in TissGDB* | C | |
| Included tissue-specific gene expression resources | HPA,TiGER | |
| Specific-tissues in normal samples (assigned by TissGDB using HPA, TiGER, and GTEx) | Brain | |
| Cancer types related to the specific-tissues in cancer samples (assigned by TissGDB using TCGA) | GBM,LGG | |
| Reference showing the relevant tissue of CEND1 | ||
| Description by TissGene annotations | ||
| * Class A consists of genes with literature evidence and is part of the cTissGenes. Class B consists of only cTissGenes without additional evidence. The remaining genes belong to Class C. |
| Gene ontology having evidence of Inferred from Direct Assay (IDA) from Entrez |
| GO ID | GO term | PubMed ID |
| Top |
| TissGeneExp for CEND1 |
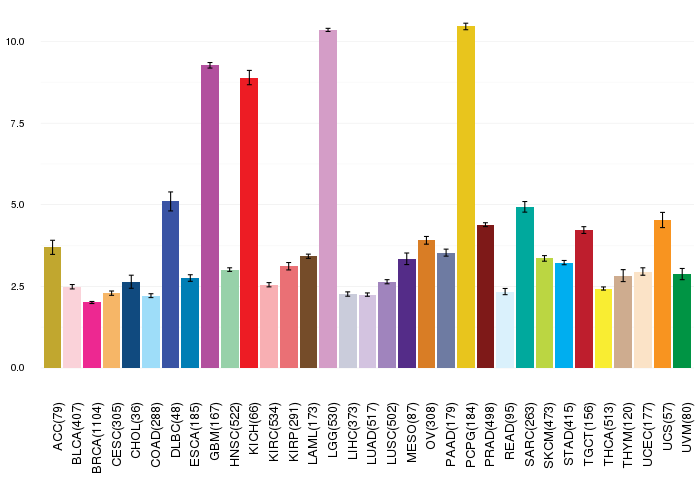
| Gene expressions across 28 cancer types (X-axis: cancer type and Y-axis: log2(norm_counts+1)) (TCGA IlluminaHiSeq_RNASeqV2, pan-cancer normalized log2(norm_counts+1) data, version 2016-08-16) |
 |
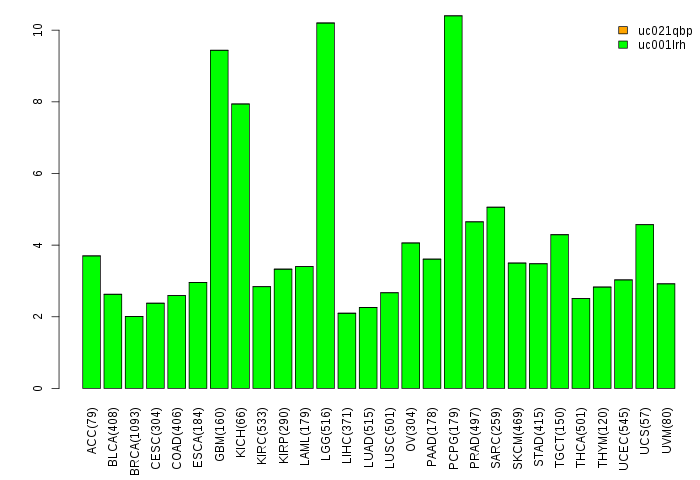
| Gene isoform expressions across 28 cancer types (X-axis: cancer type and Y-axis: log2(norm_counts+1)) (TCGA pan-cancer tcga_rsem_isoform_tpm, version 2016-09-01) |
 |
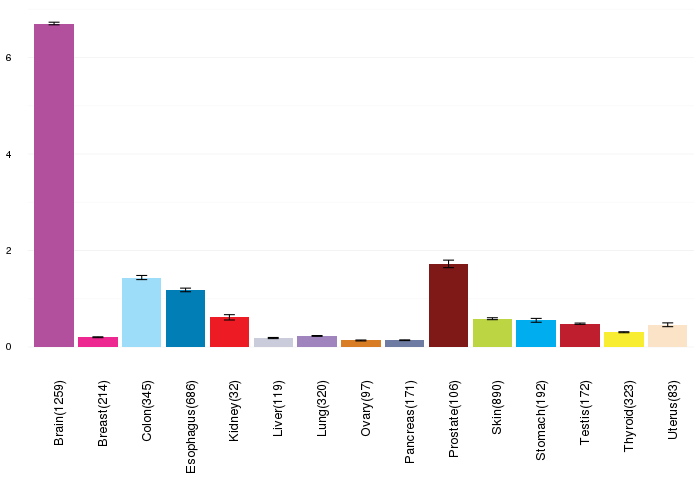
| Gene expressions across normal tissues of GTEx data (GTEx GTEx_Analysis_v6_RNA-seq_RNA-SeQCv1.1.8_gene_rpkm.gct) - Here, we shows the matched tissue types only among our 28 cancer types. |
 |
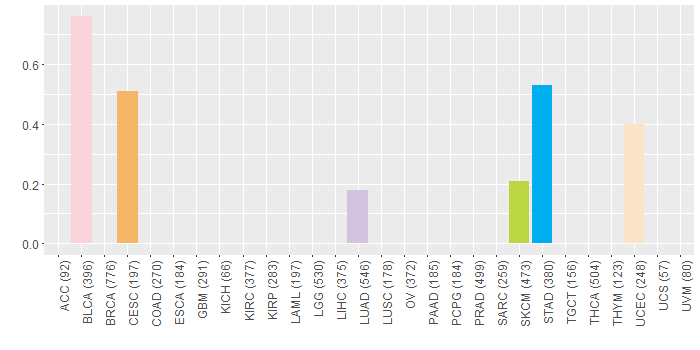
| Different expressions across 14 cancer types with more than 10 samples between matched tumors and normals (X-axis: cancer type and Y-axis: log2(norm_counts+1)) (TCGA IlluminaHiSeq_RNASeqV2, pan-cancer normalized log2(norm_counts+1) data, version 2016-08-16) |
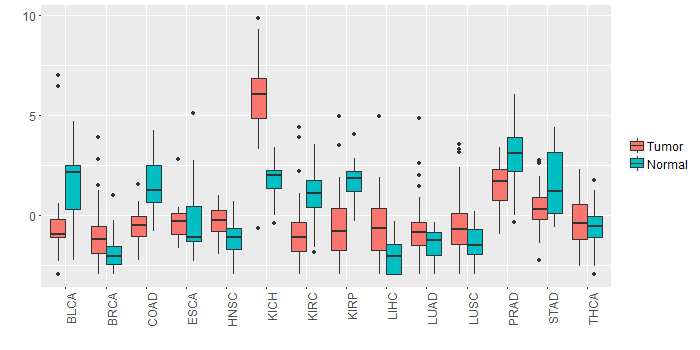 |
| - Significantly differentially expressed cancer types and information. (|Fold change|>1 and FDR<0.05) |
| Cancer type | Mean(exp) in tumor | Mean(exp) in matched normal | Log2FC | P-val. | FDR |
| PRAD | 1.526913952 | 3.092819721 | -1.565905769 | 3.76E-10 | 6.85E-09 |
| KIRP | -0.58768052 | 1.65247573 | -2.24015625 | 1.01E-07 | 6.07E-07 |
| LIHC | -0.552061895 | -2.036333895 | 1.484272 | 7.25E-08 | 5.26E-07 |
| KICH | 5.873130105 | 1.798238105 | 4.074892 | 3.58E-10 | 2.53E-09 |
| KIRC | -0.915306561 | 1.061712883 | -1.977019444 | 4.11E-17 | 2.44E-16 |
| COAD | -0.550809125 | 1.568383182 | -2.119192308 | 1.44E-08 | 1.24E-07 |
| STAD | 0.402928855 | 1.57490698 | -1.171978125 | 0.00211 | 0.00949078 |
| Top |
| TissGene-miRNA for CEND1 |
| Significantly anti-correlated miRNAs of TissGene across 28 cancer types (Gene-miRNA relations from TargetScanHuman Relsease 7.1, Conserved_Site_Context_Scores.txt.zip, 06.01.2016) (TCGA IlluminaHiSeq_miRNASeq, log2(RPM+1) data, version 2016-11-21) (TCGA IlluminaHiSeq_RNASeqV2, log2(normalized_count+1) data, version 2016-08-16) (Spearman’s Rank Correlation (p-value<0.05 and coefficient<-0.25)) |
| Cancer type | miRNA id | miRNA accession | P-val. | Coeff. | # samples |
| Top |
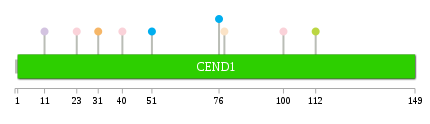
| TissGeneMut for CEND1 |
| TissGeneSNV for CEND1 |
| nsSNV counts per each loci. Different colors of circles represent different cancer types. Circle size denotes number of samples. (TCGA somatic mutation (SNPs and small INDELs) data, version 2016-04-25) * Click on the image to enlarge it in a new window. |
 |
 |
| Somatic nucleotide variants of TissGene across 28 cancer types (X-axis: cancer type and Y-axis: % of mutated samples) The numbers in parentheses are numbers of samples with mutation (nsSNVs). (TCGA somatic mutation (SNPs and small INDELs) data, version 2016-04-25) |
 |
| - nsSNVs sorted by frequency. |
| AAchange | Cancer type | # samples |
| p.P51S | STAD | 1 |
| p.D31N | CESC | 1 |
| p.E23Q | BLCA | 1 |
| p.G100R | BLCA | 1 |
| p.L78M | UCEC | 1 |
| p.G112E | SKCM | 1 |
| p.S76I | STAD | 1 |
| p.S40L | BLCA | 1 |
| p.P11T | LUAD | 1 |
| Top |
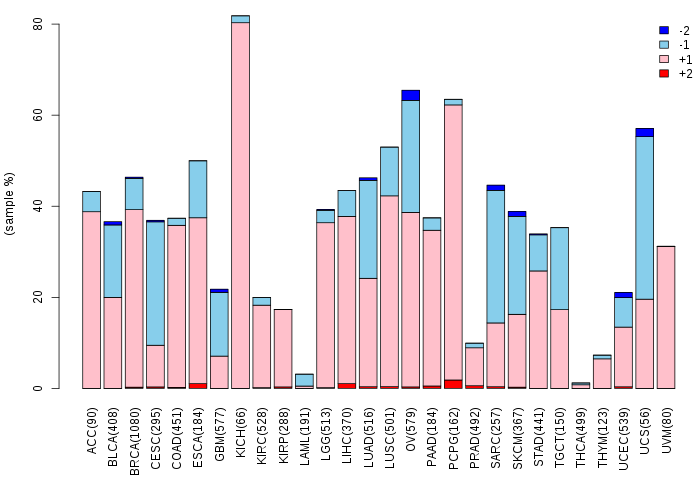
| TissGeneCNV for CEND1 |
| Copy number variations of TissGene across 28 cancer types (X-axis: cancer type and Y-axis: % of CNV samples) (TCGA Gistic2_CopyNumber_Gistic2_all_data_by_genes, Gistic2 copy number data, version 2016-08-16) |
 |
| Top |
| TissGeneFusions for CEND1 |
| Fusion genes including TissGene (ChimerDB 3.0, 2016-12-01 and TCGA fusion Portal 2015-12-01) |
| Database | Src | Cancer type | Sample | Fusion gene | ORF | 5'-gene BP | 3'-gene BP |
| Top |
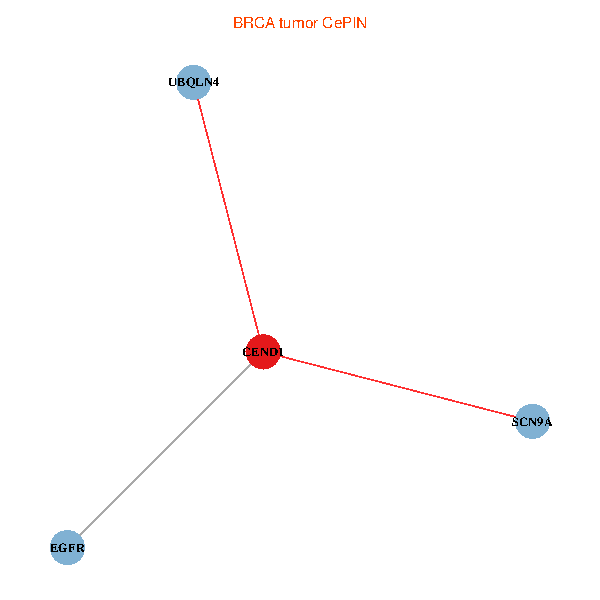
| TissGeneNet for CEND1 |
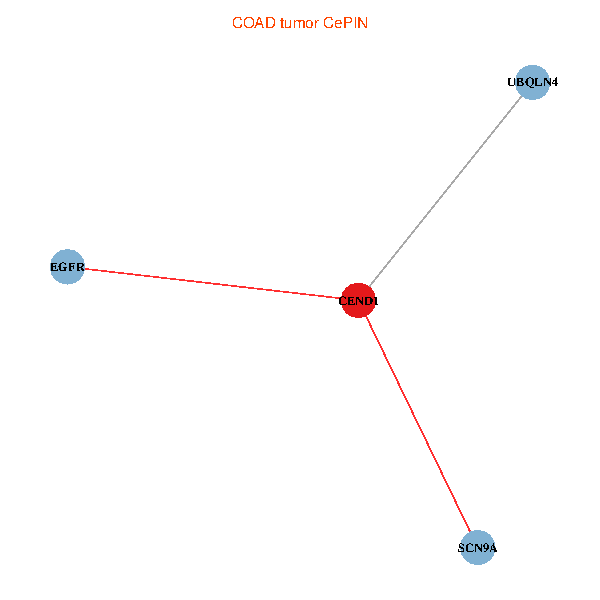
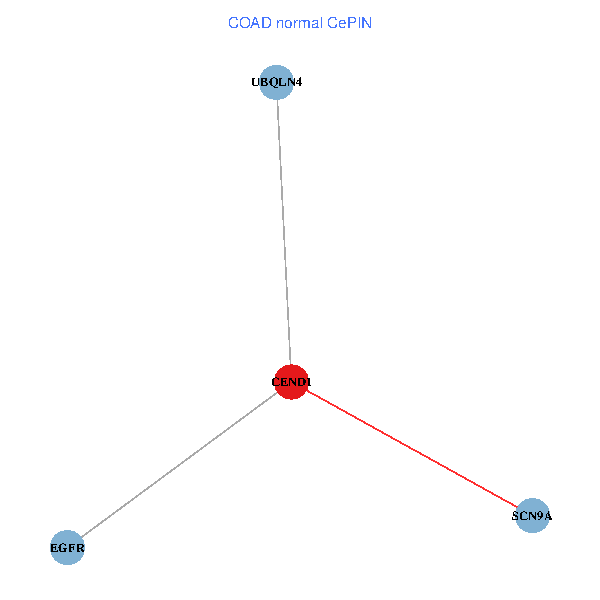
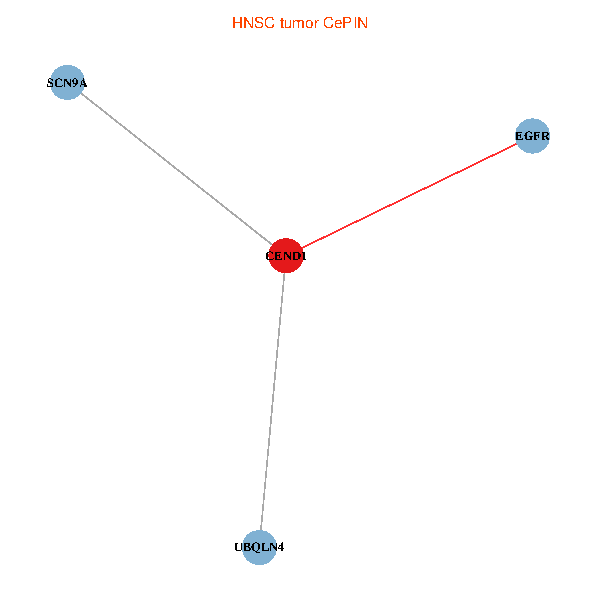
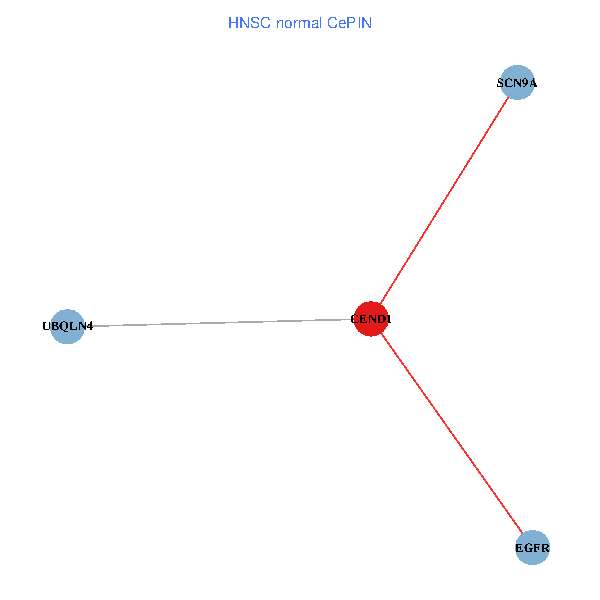
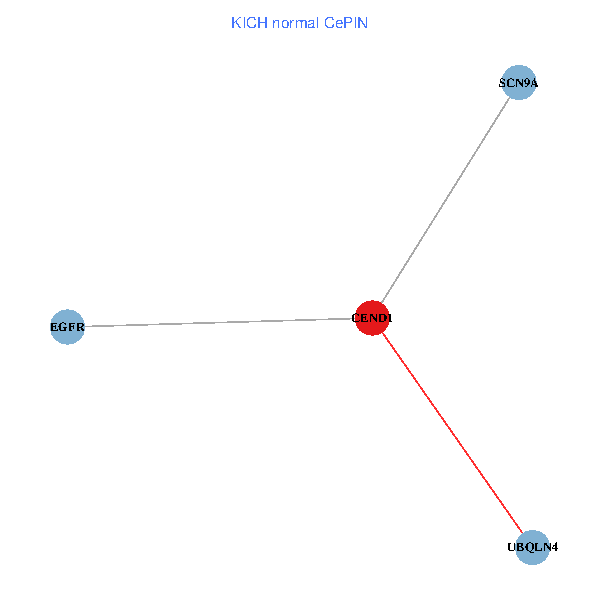
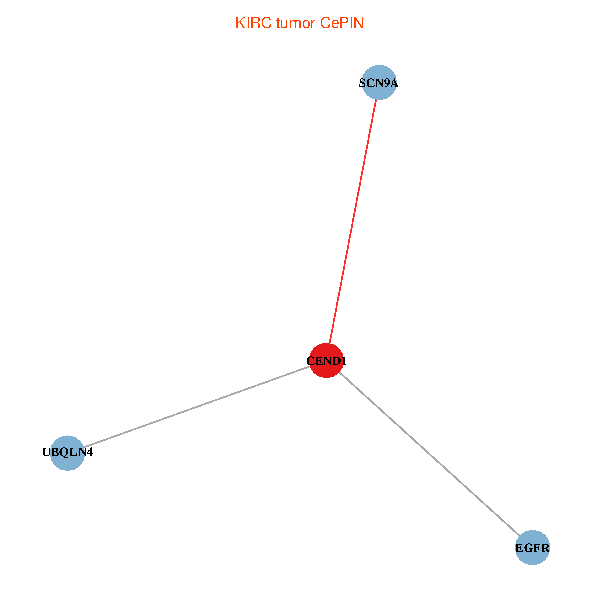
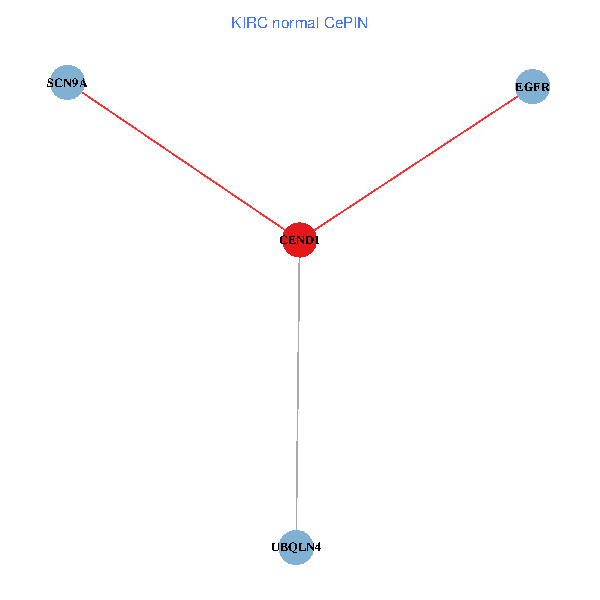
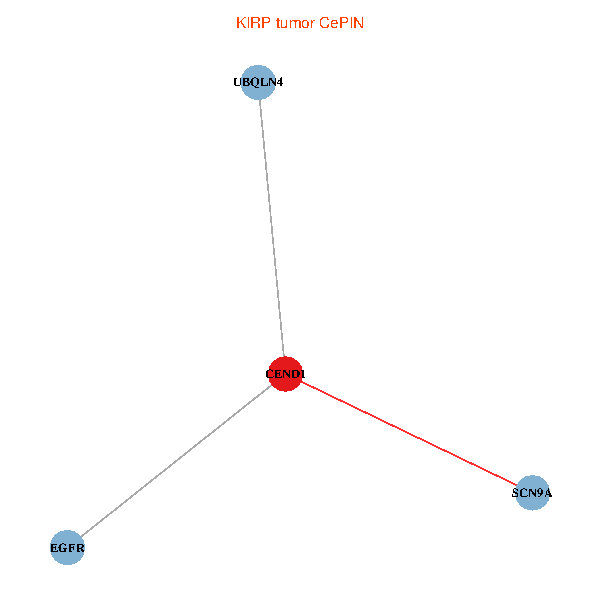
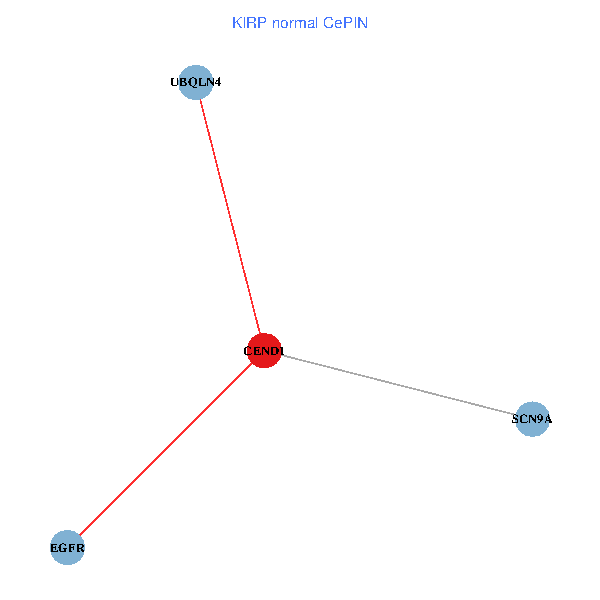
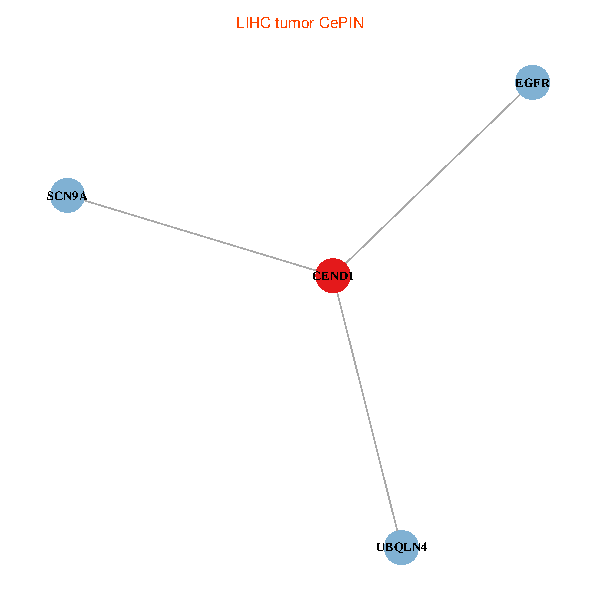
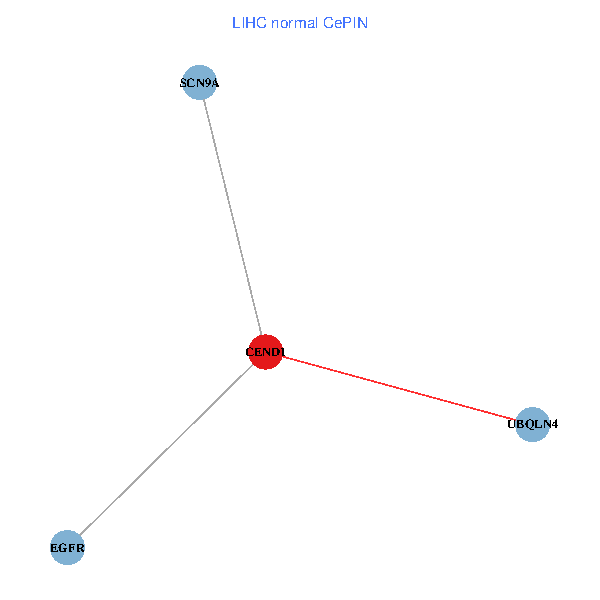
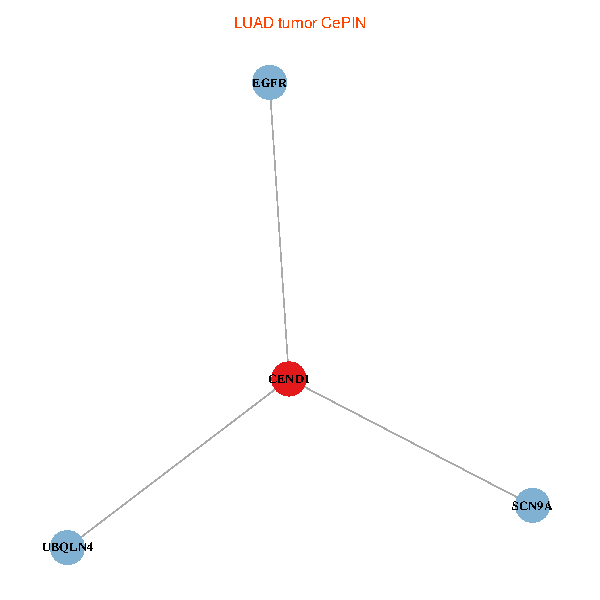
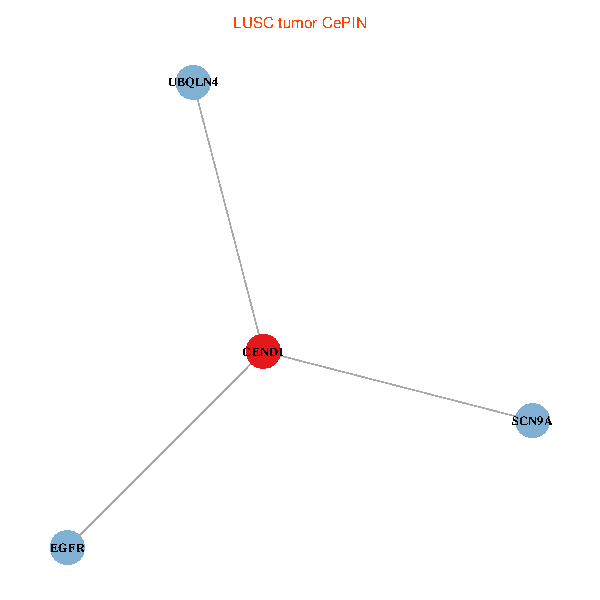
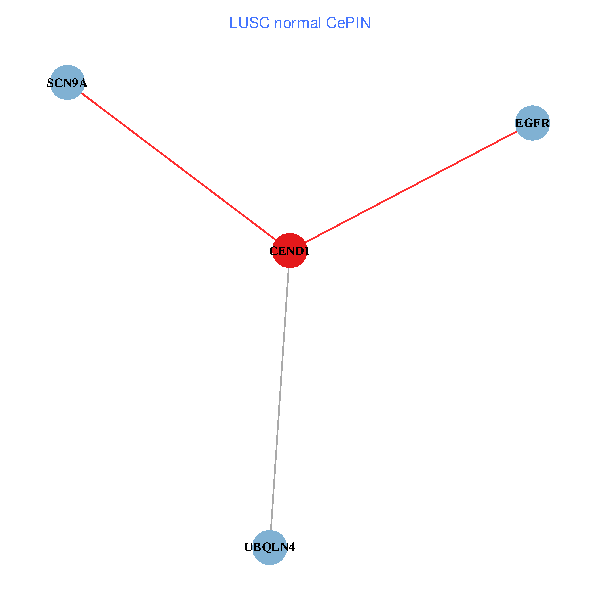
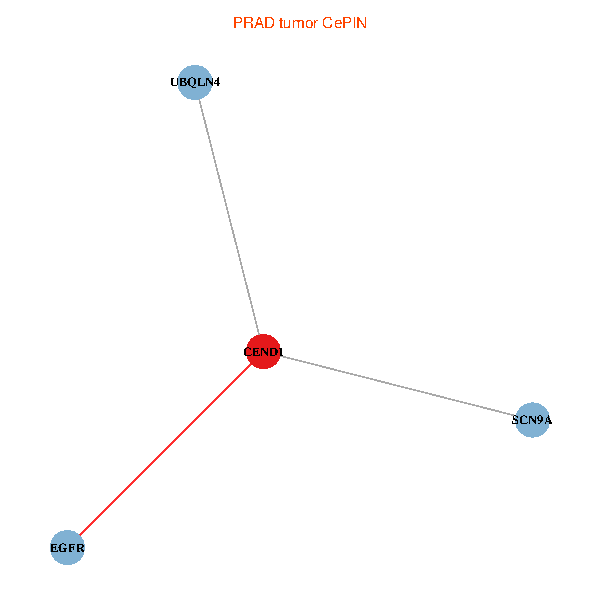
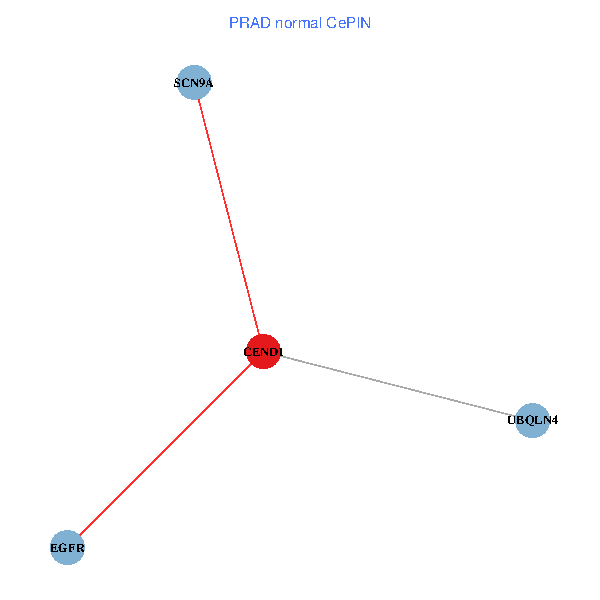
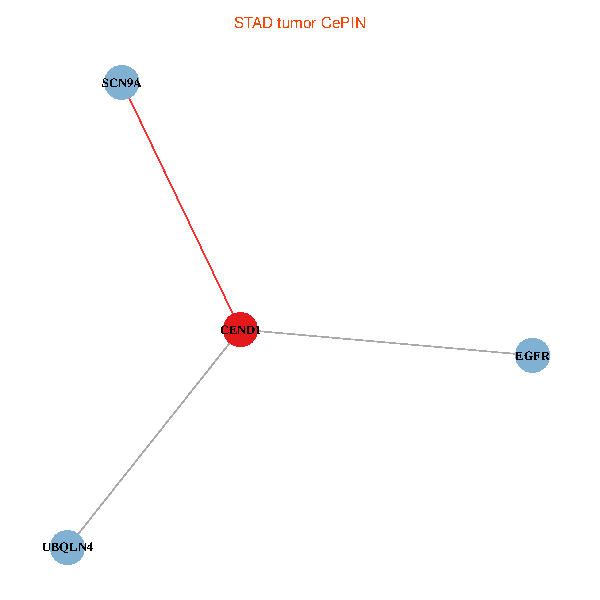
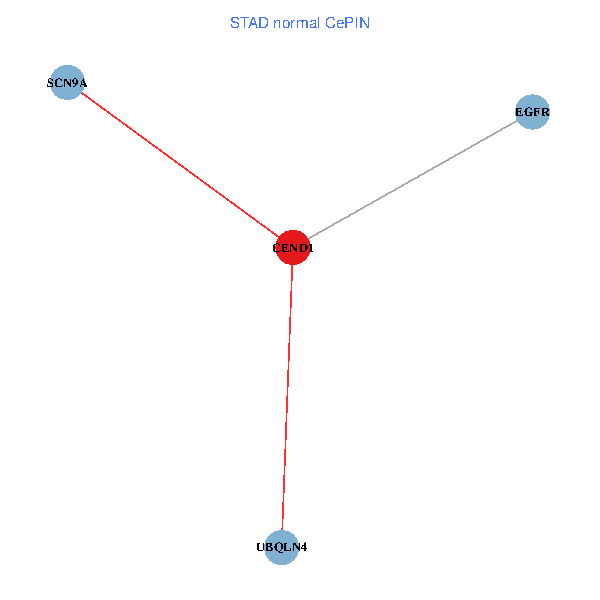
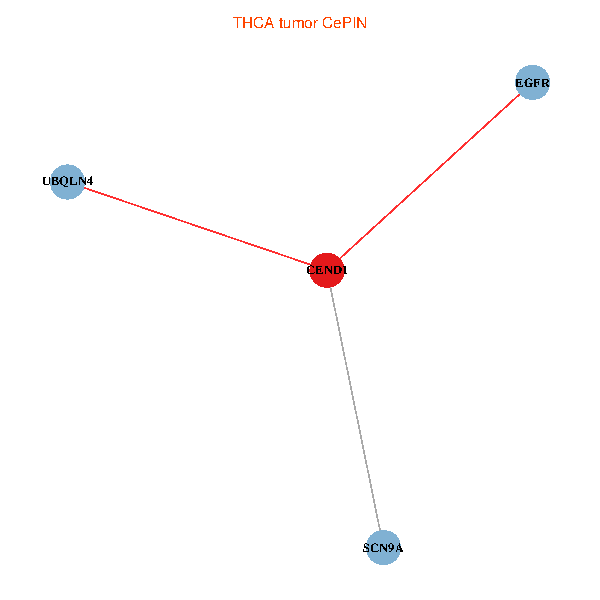
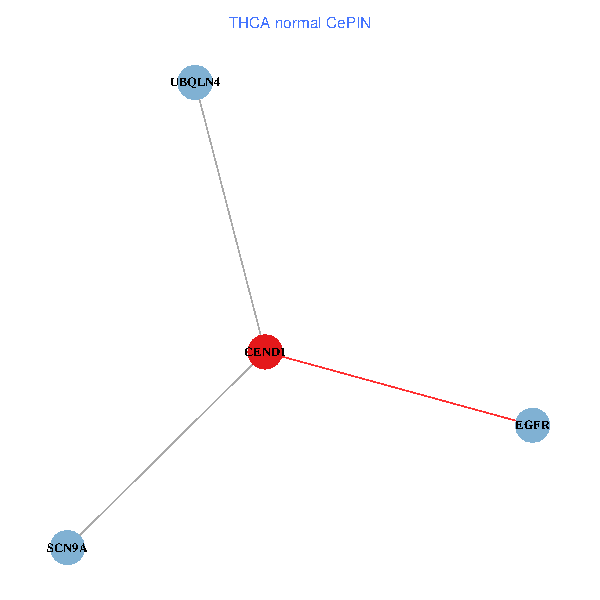
| Co-expressed gene networks based on protein-protein interaction data (CePIN) (TCGA IlluminaHiSeq_RNASeqV2, pan-cancer normalized log2(norm_counts+1) data, version 2016-08-16) (PINA2 ppi data) |
| BRCA (tumor) | BRCA (normal) |
| CEND1, SCN9A, EGFR, UBQLN4 (tumor) | CEND1, SCN9A, EGFR, UBQLN4 (normal) |
 |  |
| COAD (tumor) | COAD (normal) |
| CEND1, SCN9A, EGFR, UBQLN4 (tumor) | CEND1, SCN9A, EGFR, UBQLN4 (normal) |
 |  |
| HNSC (tumor) | HNSC (normal) |
| CEND1, SCN9A, EGFR, UBQLN4 (tumor) | CEND1, SCN9A, EGFR, UBQLN4 (normal) |
 |  |
| KICH (tumor) | KICH (normal) |
| CEND1, SCN9A, EGFR, UBQLN4 (tumor) | CEND1, SCN9A, EGFR, UBQLN4 (normal) |
 |  |
| KIRC (tumor) | KIRC (normal) |
| CEND1, SCN9A, EGFR, UBQLN4 (tumor) | CEND1, SCN9A, EGFR, UBQLN4 (normal) |
 |  |
| KIRP (tumor) | KIRP (normal) |
| CEND1, SCN9A, EGFR, UBQLN4 (tumor) | CEND1, SCN9A, EGFR, UBQLN4 (normal) |
 |  |
| LIHC (tumor) | LIHC (normal) |
| CEND1, SCN9A, EGFR, UBQLN4 (tumor) | CEND1, SCN9A, EGFR, UBQLN4 (normal) |
 |  |
| LUAD (tumor) | LUAD (normal) |
| CEND1, SCN9A, EGFR, UBQLN4 (tumor) | CEND1, SCN9A, EGFR, UBQLN4 (normal) |
 |  |
| LUSC (tumor) | LUSC (normal) |
| CEND1, SCN9A, EGFR, UBQLN4 (tumor) | CEND1, SCN9A, EGFR, UBQLN4 (normal) |
 |  |
| PRAD (tumor) | PRAD (normal) |
| CEND1, SCN9A, EGFR, UBQLN4 (tumor) | CEND1, SCN9A, EGFR, UBQLN4 (normal) |
 |  |
| STAD (tumor) | STAD (normal) |
| CEND1, SCN9A, EGFR, UBQLN4 (tumor) | CEND1, SCN9A, EGFR, UBQLN4 (normal) |
 |  |
| THCA (tumor) | THCA (normal) |
| CEND1, SCN9A, EGFR, UBQLN4 (tumor) | CEND1, SCN9A, EGFR, UBQLN4 (normal) |
 |  |
| Top |
| TissGeneProg for CEND1 |
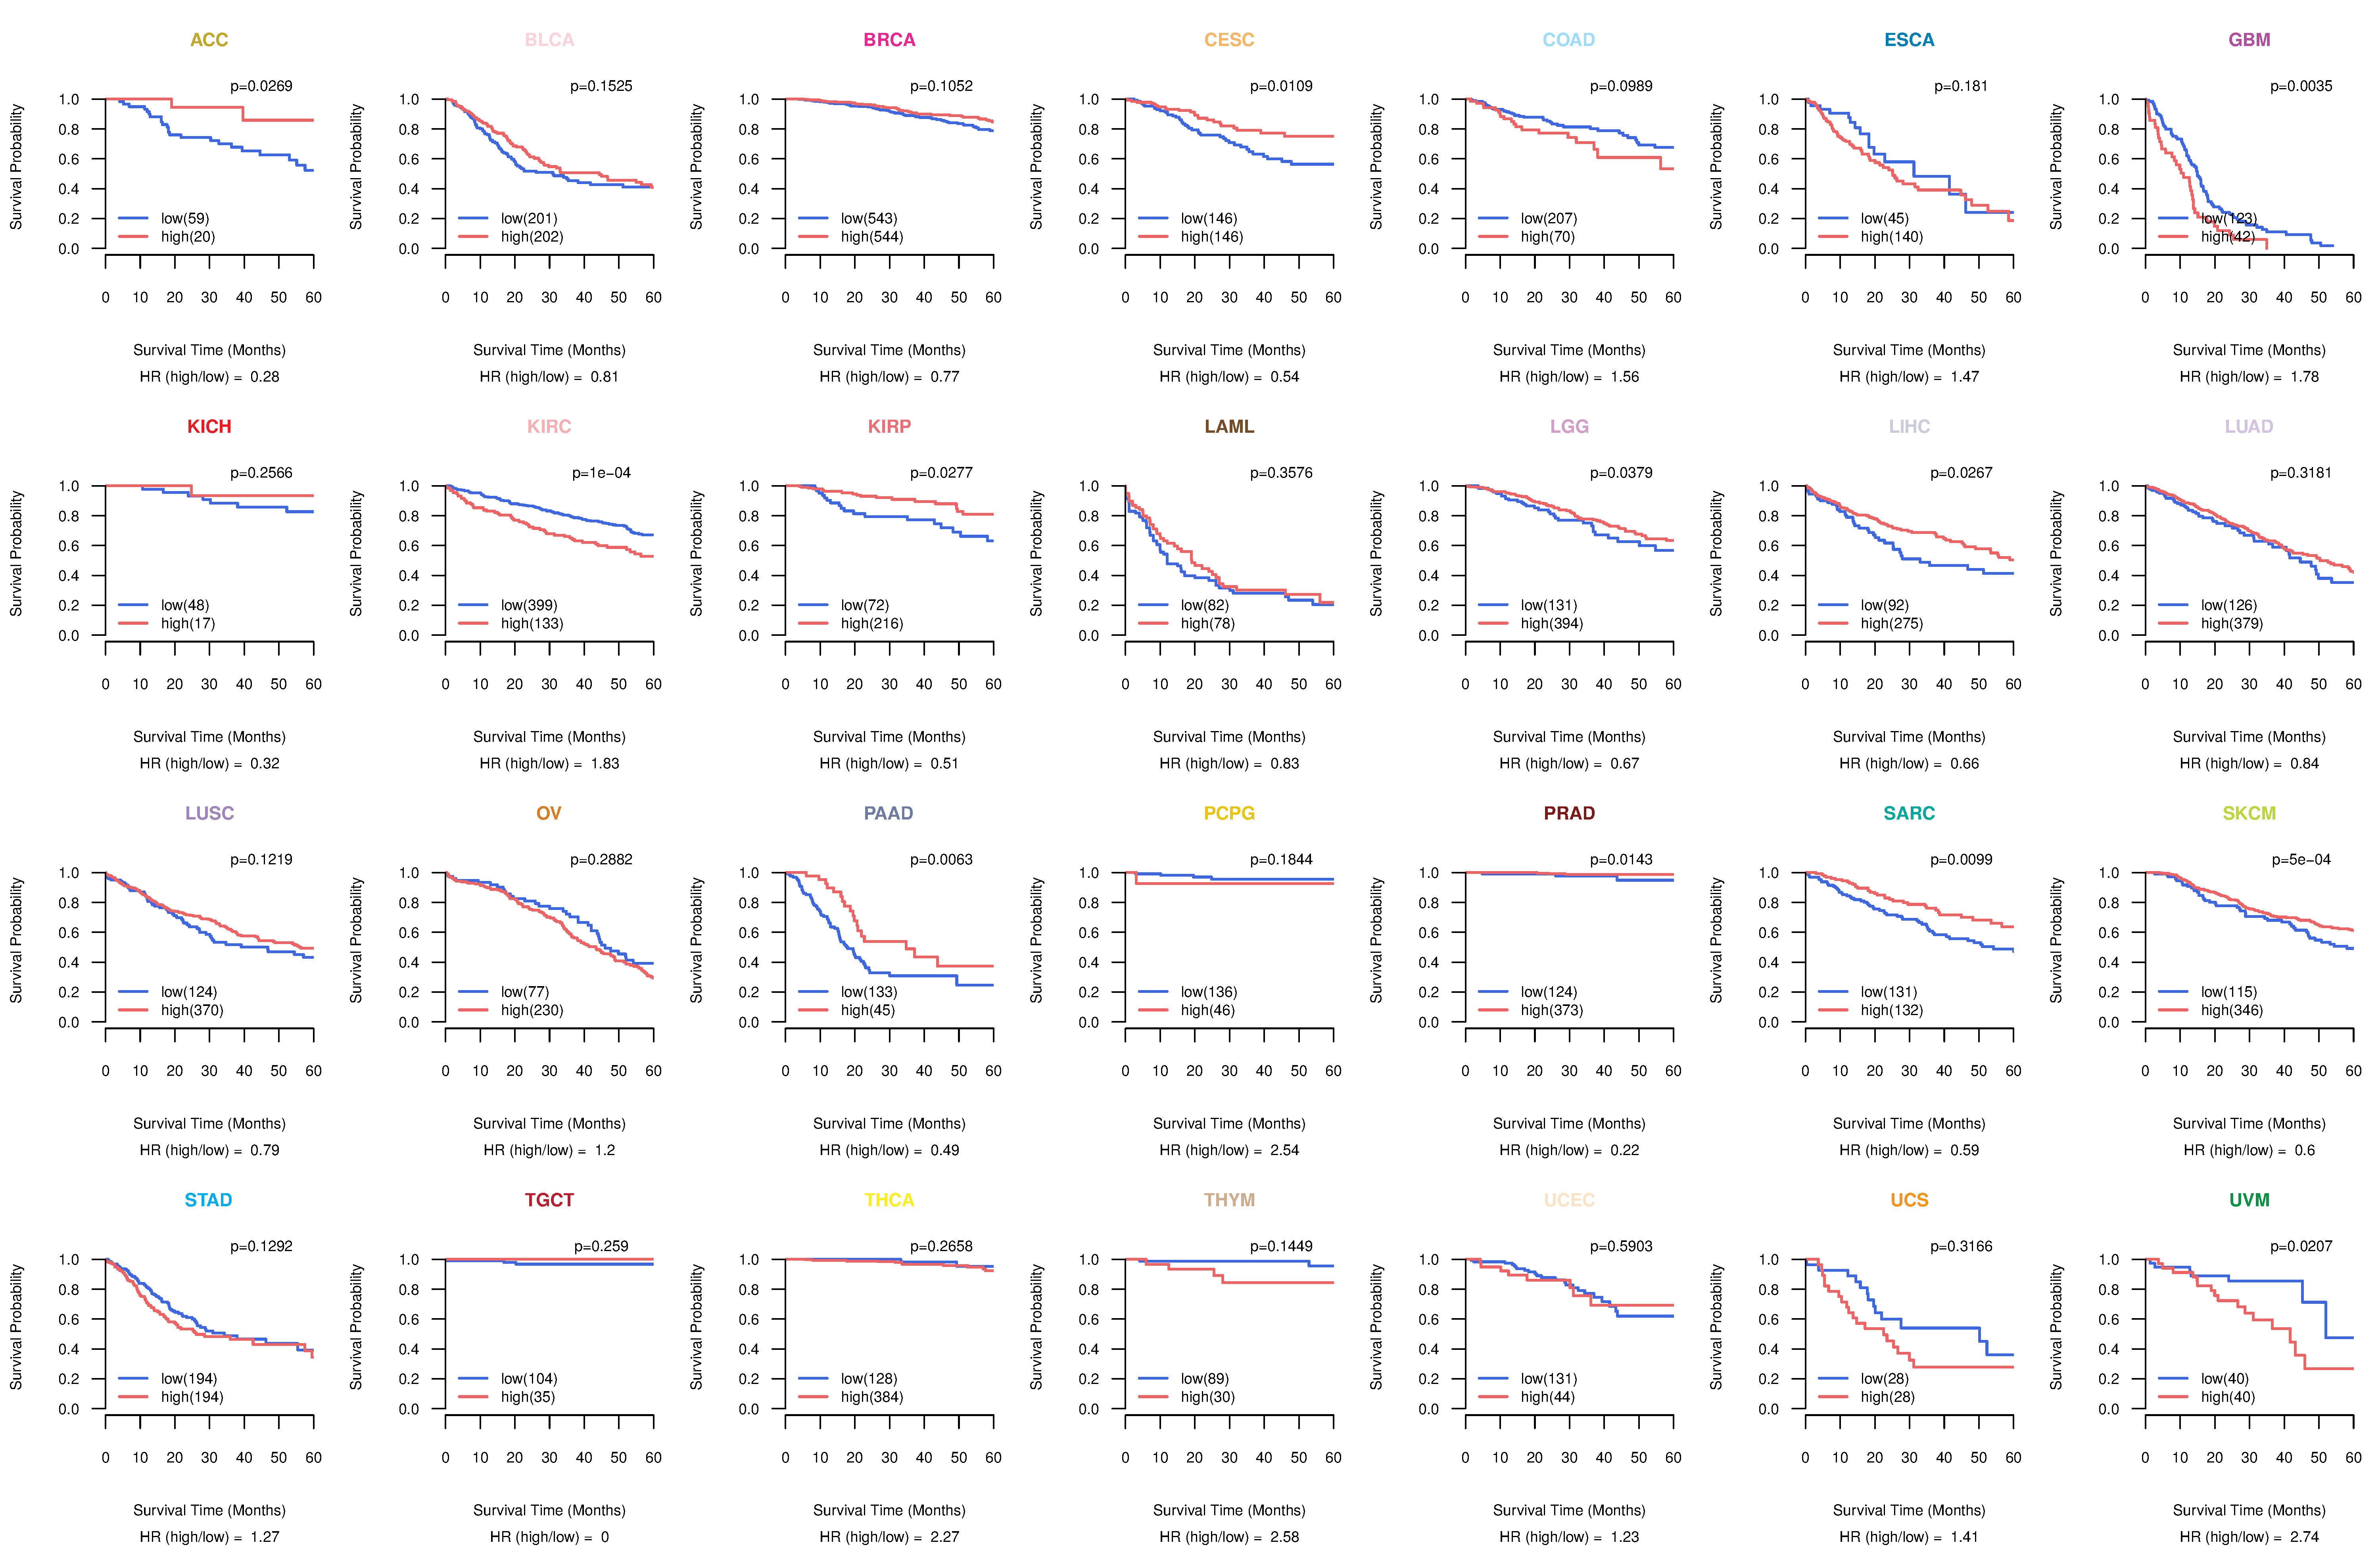
| Kaplan-Meier plots with logrank tests of overall survival (OS) using 28 cancer types (TCGA IlluminaHiSeq_RNASeqV2, pan-cancer normalized log2(norm_counts+1) data, version 2016-08-16) (TCGA clinicalMatrix, phenotype data, version 2016-04-27) * Click on the image to enlarge it in a new window. |
 |
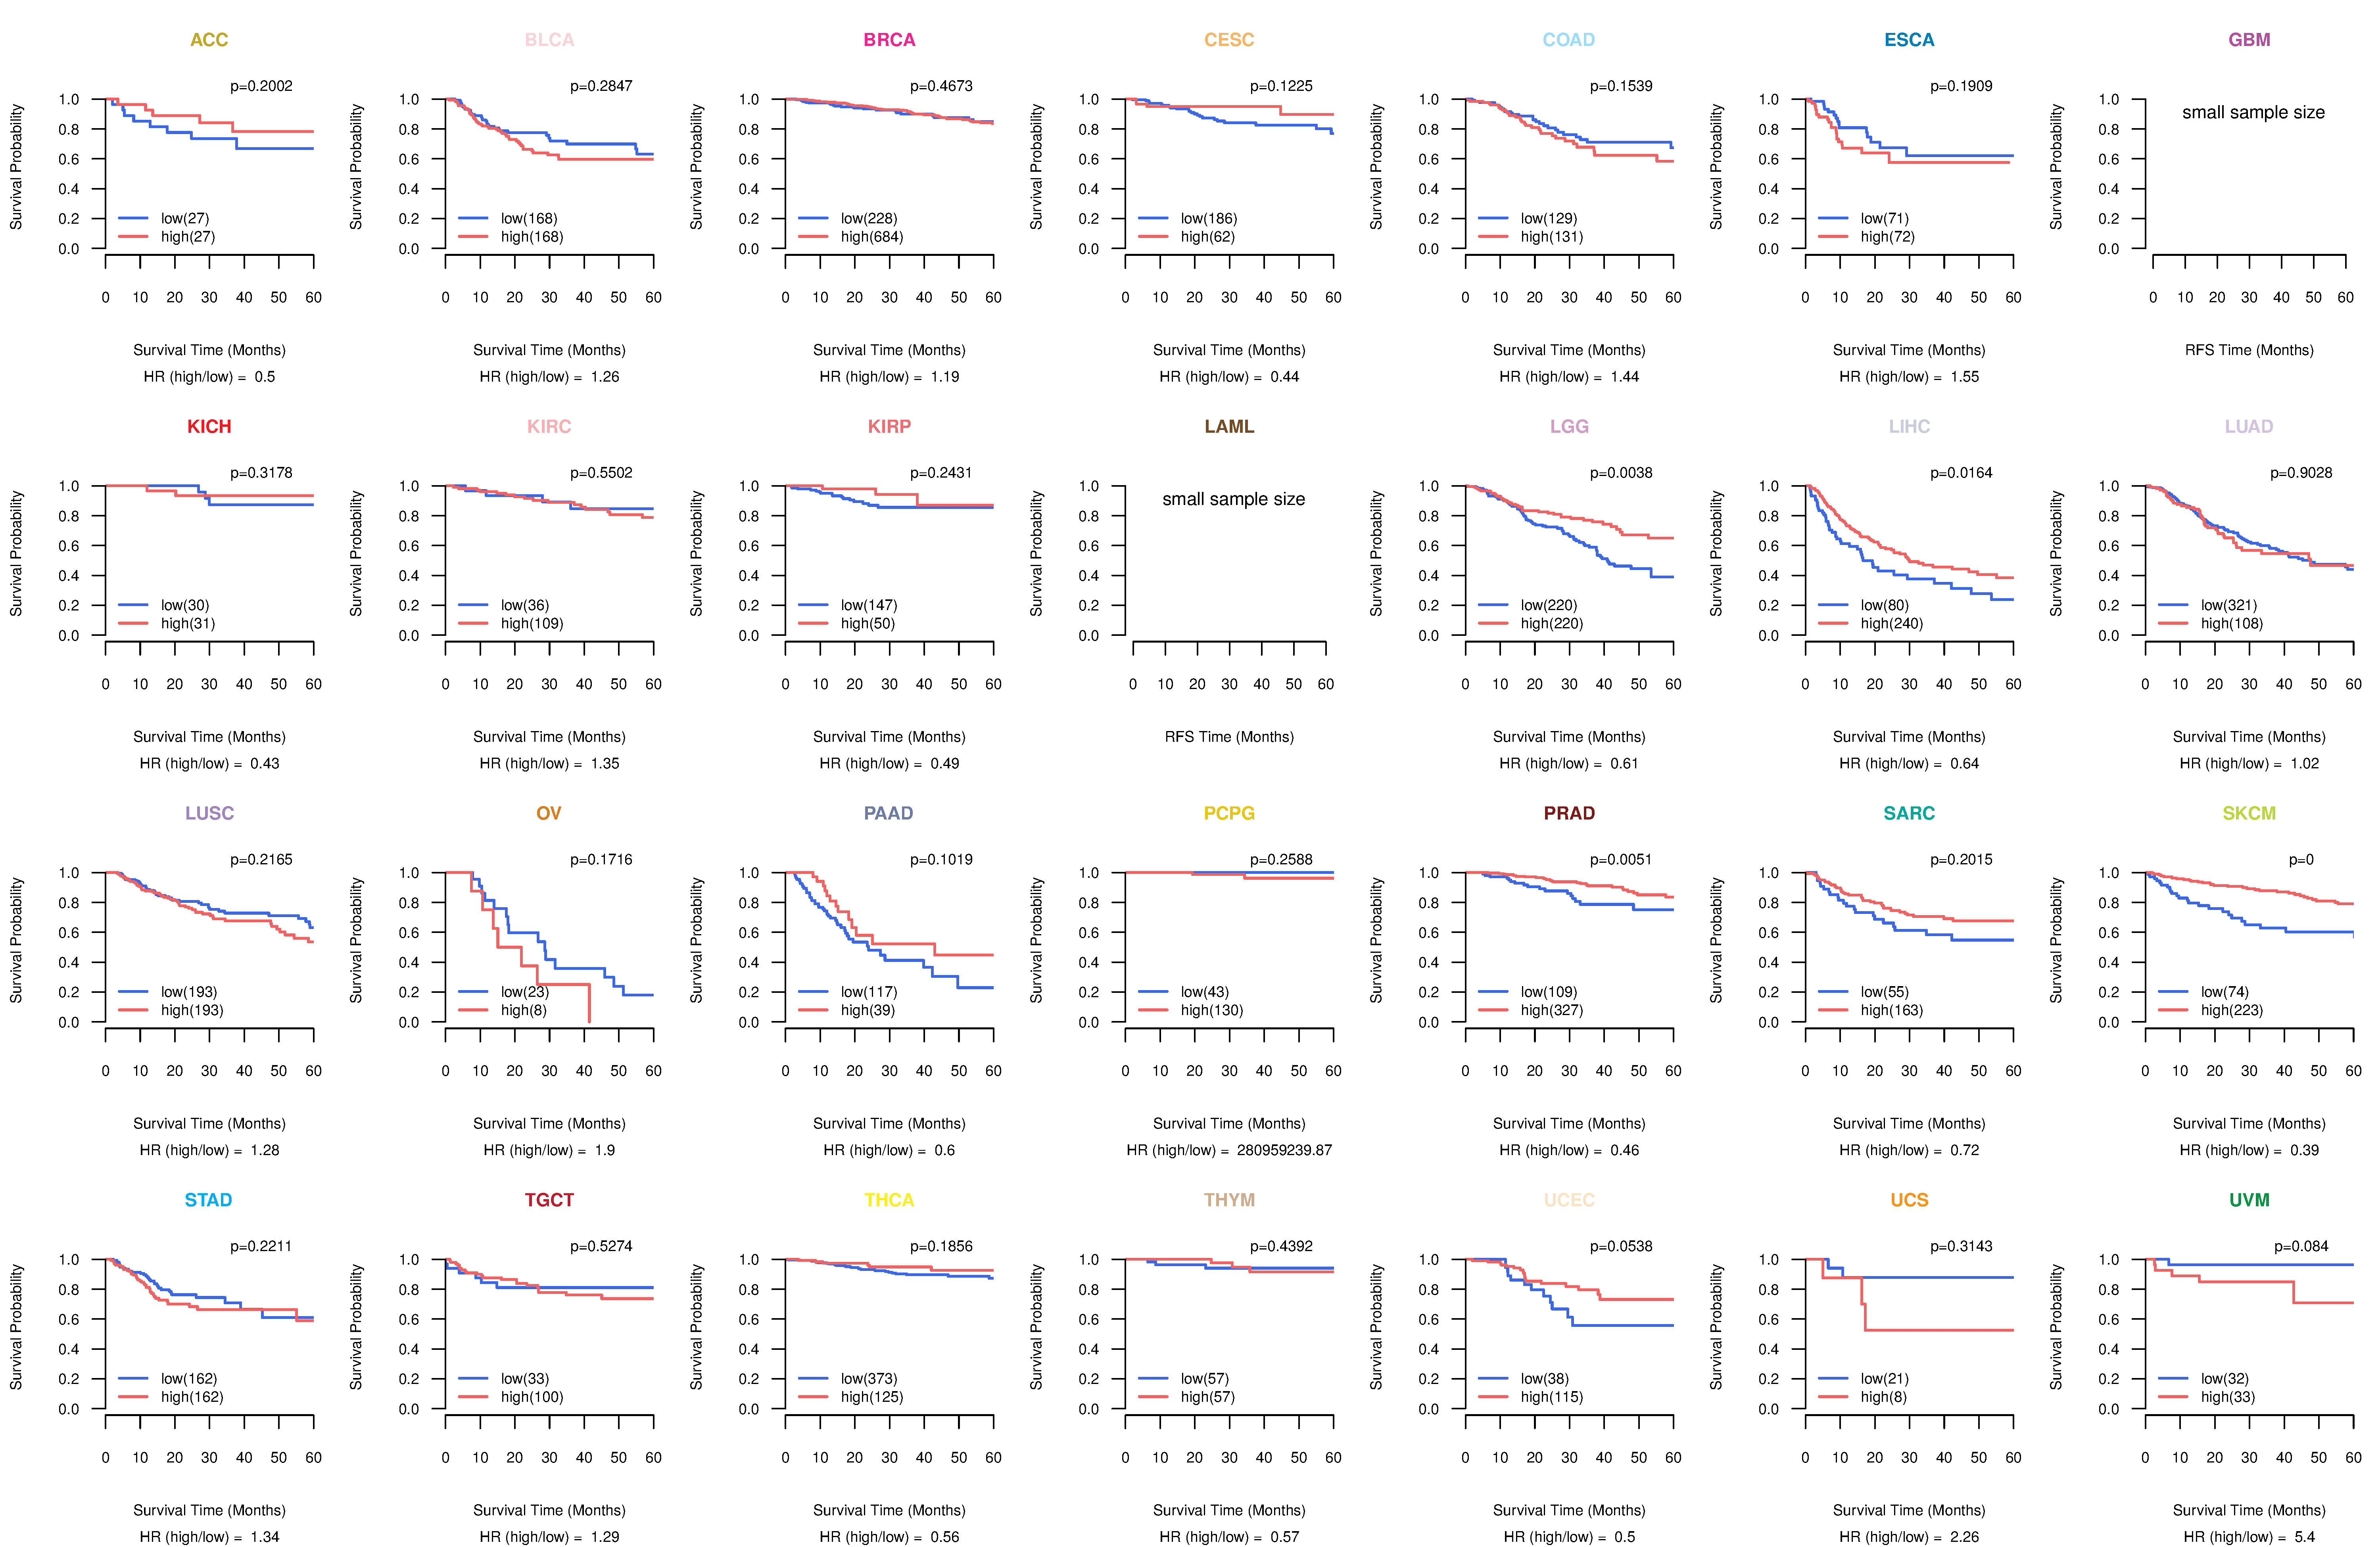
| Kaplan-Meier plots with logrank test of relapse free survival (RFS) using 28 cancer types (TCGA IlluminaHiSeq_RNASeqV2, pan-cancer normalized log2(norm_counts+1) data, version 2016-08-16) (TCGA clinicalMatrix, phenotype data, version 2016-04-27) * Click on the image enlarge it in a new window. |
 |
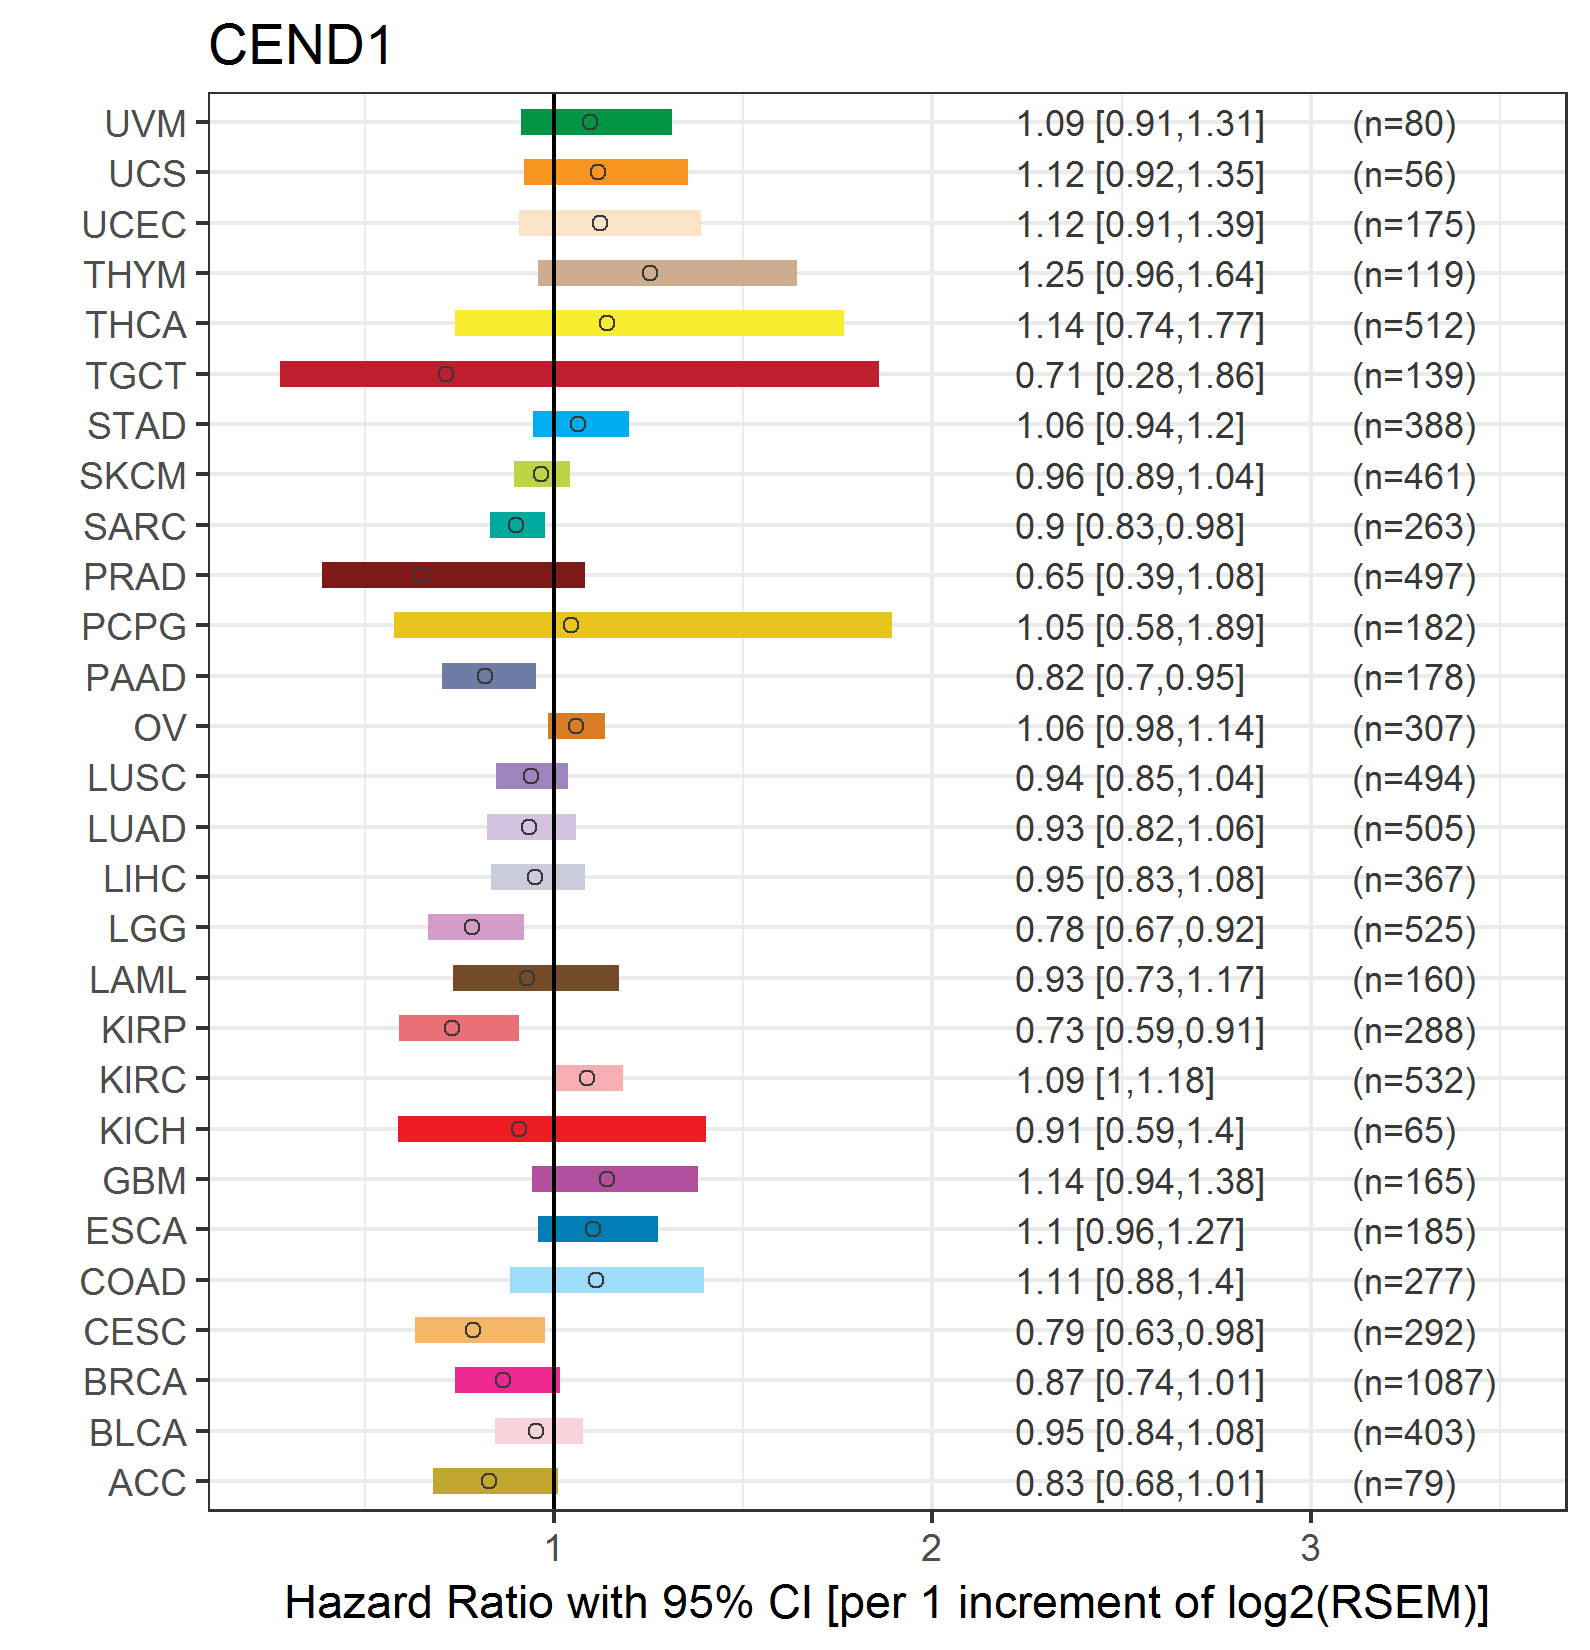
| Forest plot of Cox proportional hazard ratio (HR) and 95% CI of overall survival (OS) using 28 cancer types (TCGA IlluminaHiSeq_RNASeqV2, pan-cancer normalized log2(norm_counts+1) data, version 2016-08-16) (TCGA clinicalMatrix, phenotype data, version 2016-04-27) * Click on the image enlarge it in a new window. |
 |
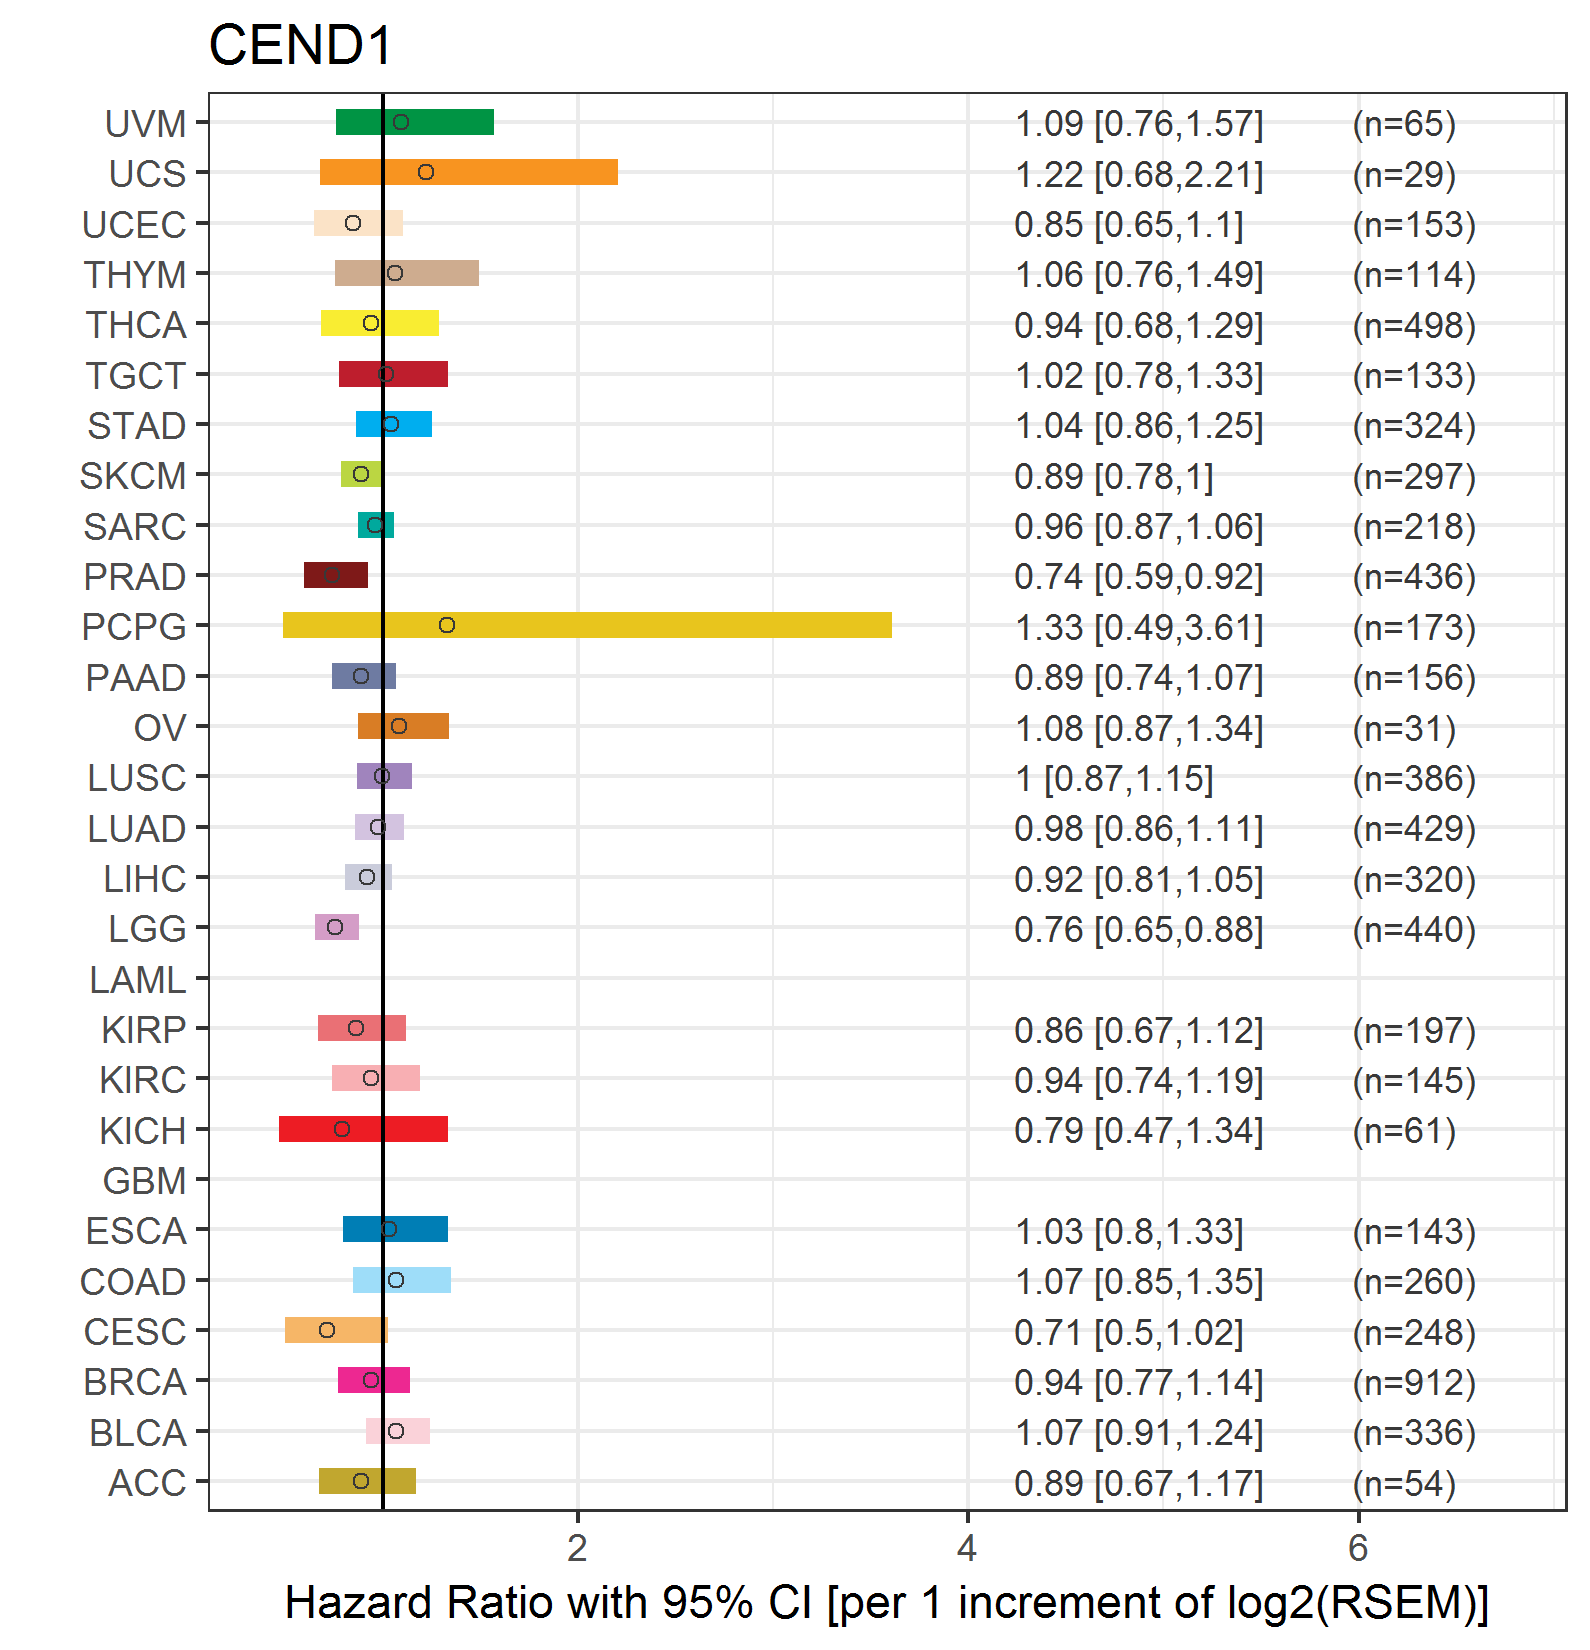
| Forest plot of Cox proportional hazard ratio (HR) and 95% CI of relapse free survival (RFS) using 28 cancer types (TCGA IlluminaHiSeq_RNASeqV2, pan-cancer normalized log2(norm_counts+1) data, version 2016-08-16) (TCGA clinicalMatrix, phenotype data, version 2016-04-27) * Click on the image enlarge it in a new window. |
 |
| Top |
| TissGeneClin for CEND1 |
| TissGeneDrug for CEND1 |
| Drug information targeting TissGene (DrugBank Version 5.0.6, 2017-04-01) |
| DrugBank ID | Drug name | Drug activity | Drug type | Drug status |
| Top |
| TissGeneDisease for CEND1 |
| Disease information associated with TissGene (DisGeNet, 2016-06-01) |
| Disease ID | Disease name | # pubmeds | Source |
| umls:C0004903 | Beckwith-Wiedemann Syndrome | 1 | BeFree |
| umls:C0027819 | Neuroblastoma | 1 | BeFree |
| umls:C0424605 | Developmental delay (disorder) | 1 | BeFree |
| umls:C0431399 | Familial aplasia of the vermis | 1 | BeFree |
| umls:C0596263 | Carcinogenesis | 1 | BeFree |
| umls:C0700095 | Central neuroblastoma | 1 | BeFree |
|
Copyright 2016-Present - The University of Texas Health Science Center at Houston (UTHealth) Web File Viewing | How to Report, Fraud, Waste and Abuse | State of Texas | Statewide Search | Texas Homeland Security | Site Policies |