 |
| |
| |
| |
| |
| |
| |
|

| TissGeneSummary for PHF7 |
 Gene summary Gene summary |
| Basic gene information | Gene symbol | PHF7 |
| Gene name | PHD finger protein 7 | |
| Synonyms | HSPC045|HSPC226|NYD-SP6 | |
| Cytomap | UCSC genome browser: 3p21.1 | |
| Type of gene | protein-coding | |
| RefGenes | NM_001278221.1, NM_016483.5,NM_173341.1, | |
| Description | testis development protein NYD-SP6 | |
| Modification date | 20141207 | |
| dbXrefs | HGNC : HGNC | |
| Ensembl : ENSG00000010318 | ||
| HPRD : 15127 | ||
| Vega : OTTHUMG00000158495 | ||
| Protein | UniProt: go to UniProt's Cross Reference DB Table | |
| Expression | CleanEX: HS_PHF7 | |
| BioGPS: 51533 | ||
| Pathway | NCI Pathway Interaction Database: PHF7 | |
| KEGG: PHF7 | ||
| REACTOME: PHF7 | ||
| Pathway Commons: PHF7 | ||
| Context | iHOP: PHF7 | |
| ligand binding site mutation search in PubMed: PHF7 | ||
| UCL Cancer Institute: PHF7 | ||
| Assigned class in TissGDB* | B | |
| Included tissue-specific gene expression resources | HPA,TiGER,GTEx | |
| Specific-tissues in normal samples (assigned by TissGDB using HPA, TiGER, and GTEx) | Testis | |
| Cancer types related to the specific-tissues in cancer samples (assigned by TissGDB using TCGA) | TGCT | |
| Reference showing the relevant tissue of PHF7 | ||
| Description by TissGene annotations | ||
| * Class A consists of genes with literature evidence and is part of the cTissGenes. Class B consists of only cTissGenes without additional evidence. The remaining genes belong to Class C. |
| Gene ontology having evidence of Inferred from Direct Assay (IDA) from Entrez |
| GO ID | GO term | PubMed ID |
| Top |
| TissGeneExp for PHF7 |
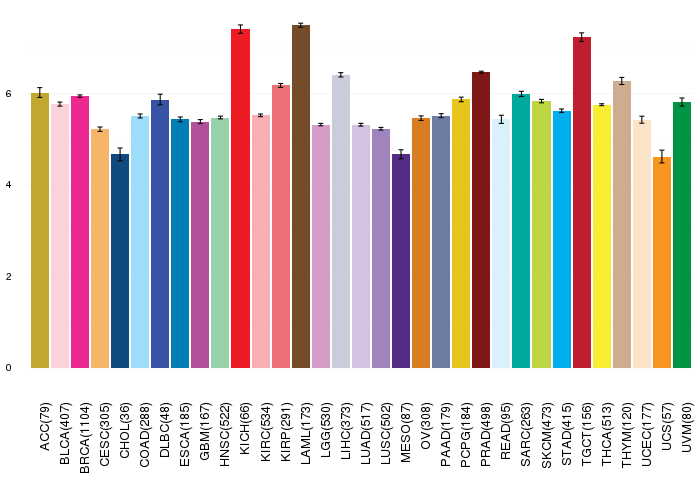
| Gene expressions across 28 cancer types (X-axis: cancer type and Y-axis: log2(norm_counts+1)) (TCGA IlluminaHiSeq_RNASeqV2, pan-cancer normalized log2(norm_counts+1) data, version 2016-08-16) |
 |
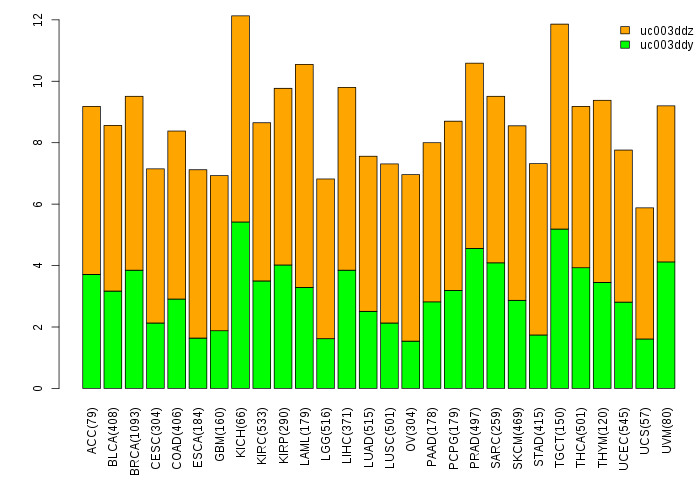
| Gene isoform expressions across 28 cancer types (X-axis: cancer type and Y-axis: log2(norm_counts+1)) (TCGA pan-cancer tcga_rsem_isoform_tpm, version 2016-09-01) |
 |
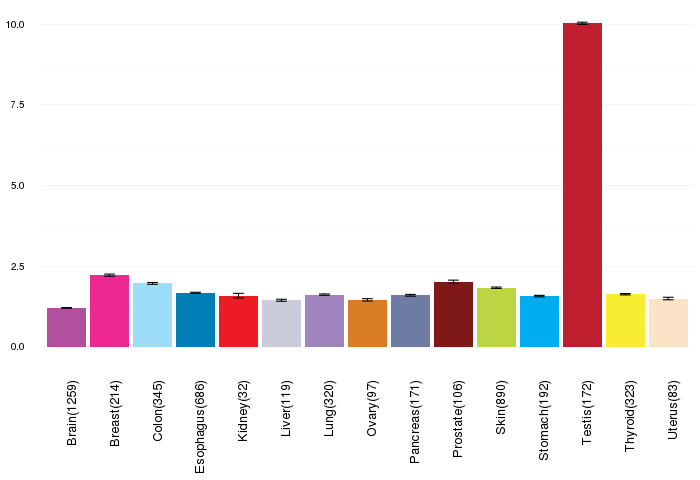
| Gene expressions across normal tissues of GTEx data (GTEx GTEx_Analysis_v6_RNA-seq_RNA-SeQCv1.1.8_gene_rpkm.gct) - Here, we shows the matched tissue types only among our 28 cancer types. |
 |
| Different expressions across 14 cancer types with more than 10 samples between matched tumors and normals (X-axis: cancer type and Y-axis: log2(norm_counts+1)) (TCGA IlluminaHiSeq_RNASeqV2, pan-cancer normalized log2(norm_counts+1) data, version 2016-08-16) |
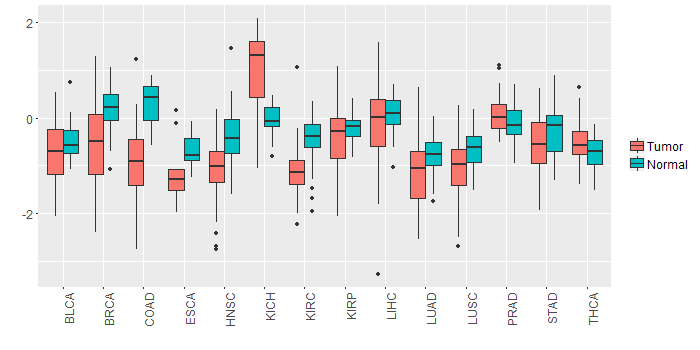 |
| - Significantly differentially expressed cancer types and information. (|Fold change|>1 and FDR<0.05) |
| Cancer type | Mean(exp) in tumor | Mean(exp) in matched normal | Log2FC | P-val. | FDR |
| KICH | 0.984590943 | -0.048361057 | 1.032952 | 1.00E-06 | 3.75E-06 |
| COAD | -0.972370441 | 0.330894943 | -1.303265385 | 3.95E-08 | 3.03E-07 |
| Top |
| TissGene-miRNA for PHF7 |
| Significantly anti-correlated miRNAs of TissGene across 28 cancer types (Gene-miRNA relations from TargetScanHuman Relsease 7.1, Conserved_Site_Context_Scores.txt.zip, 06.01.2016) (TCGA IlluminaHiSeq_miRNASeq, log2(RPM+1) data, version 2016-11-21) (TCGA IlluminaHiSeq_RNASeqV2, log2(normalized_count+1) data, version 2016-08-16) (Spearman’s Rank Correlation (p-value<0.05 and coefficient<-0.25)) |
| Cancer type | miRNA id | miRNA accession | P-val. | Coeff. | # samples |
| ACC | hsa-miR-378f | MIMAT0018932 | 0.017 | -0.27 | 78 |
| ACC | hsa-miR-378f | MIMAT0018932 | 0.017 | -0.27 | 78 |
| LUAD | hsa-miR-495-3p | MIMAT0002817 | 0.028 | -0.29 | 60 |
| Top |
| TissGeneMut for PHF7 |
| TissGeneSNV for PHF7 |
| nsSNV counts per each loci. Different colors of circles represent different cancer types. Circle size denotes number of samples. (TCGA somatic mutation (SNPs and small INDELs) data, version 2016-04-25) * Click on the image to enlarge it in a new window. |
 |
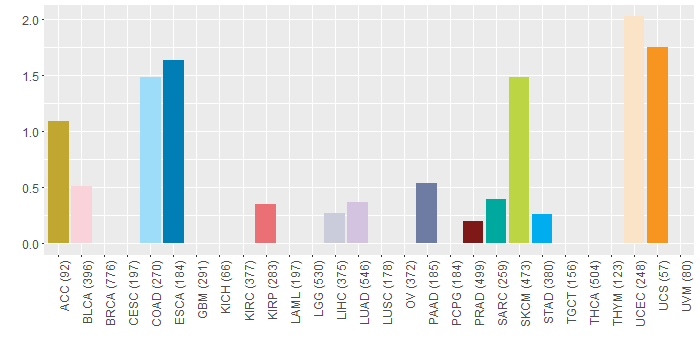
| Somatic nucleotide variants of TissGene across 28 cancer types (X-axis: cancer type and Y-axis: % of mutated samples) The numbers in parentheses are numbers of samples with mutation (nsSNVs). (TCGA somatic mutation (SNPs and small INDELs) data, version 2016-04-25) |
 |
| - nsSNVs sorted by frequency. |
| AAchange | Cancer type | # samples |
| p.P317S | SKCM | 2 |
| p.E165K | HNSC | 1 |
| p.R210Q | BLCA | 1 |
| p.Q151* | SKCM | 1 |
| p.K7N | HNSC | 1 |
| p.H200Y | PRAD | 1 |
| p.F60V | PAAD | 1 |
| p.D260Y | UCEC | 1 |
| p.R145C | SKCM | 1 |
| p.T344S | ACC | 1 |
| p.V57M | COAD | 1 |
| p.H144Y | UCS | 1 |
| p.P69H | STAD | 1 |
| p.K87N | COAD | 1 |
| p.E44* | LUAD | 1 |
| p.P347S | ESCA | 1 |
| p.P214S | SKCM | 1 |
| p.A303V | SKCM | 1 |
| p.P69H | UCEC | 1 |
| p.N54D | LIHC | 1 |
| p.Y245C | KIRP | 1 |
| p.R92Q | UCEC | 1 |
| p.E212* | UCEC | 1 |
| p.G280E | SKCM | 1 |
| p.S313A | COAD | 1 |
| p.W343* | ESCA | 1 |
| p.E337K | BLCA | 1 |
| p.T196A | UCEC | 1 |
| p.R289K | SKCM | 1 |
| p.A194V | LUAD | 1 |
| p.L335M | COAD | 1 |
| p.R71S | COAD | 1 |
| p.K104R | SARC | 1 |
| p.R244H | ESCA | 1 |
| Top |
| TissGeneCNV for PHF7 |
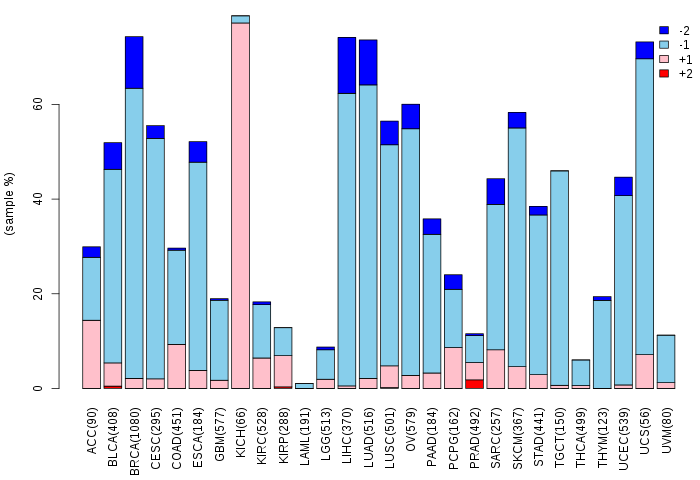
| Copy number variations of TissGene across 28 cancer types (X-axis: cancer type and Y-axis: % of CNV samples) (TCGA Gistic2_CopyNumber_Gistic2_all_data_by_genes, Gistic2 copy number data, version 2016-08-16) |
 |
| Top |
| TissGeneFusions for PHF7 |
| Fusion genes including TissGene (ChimerDB 3.0, 2016-12-01 and TCGA fusion Portal 2015-12-01) |
| Database | Src | Cancer type | Sample | Fusion gene | ORF | 5'-gene BP | 3'-gene BP |
| Chimerdb3.0 | ChiTaRs | NA | AL137671 | PHF7-PHF7 | chr3:52457299 | chr3:52456731 |
| Top |
| TissGeneNet for PHF7 |
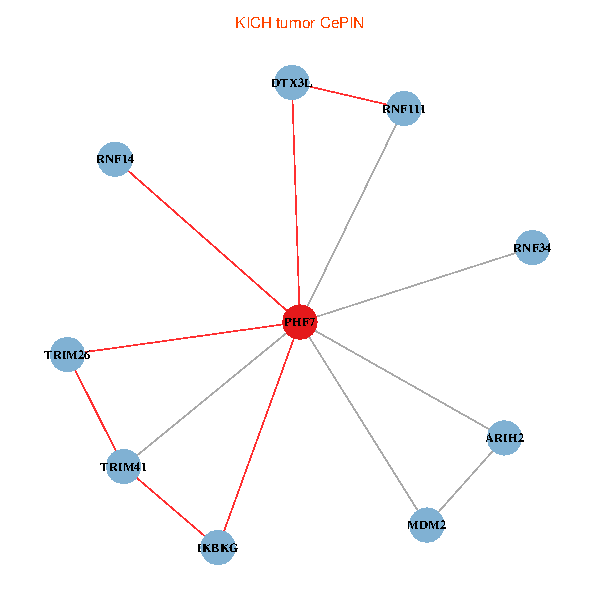
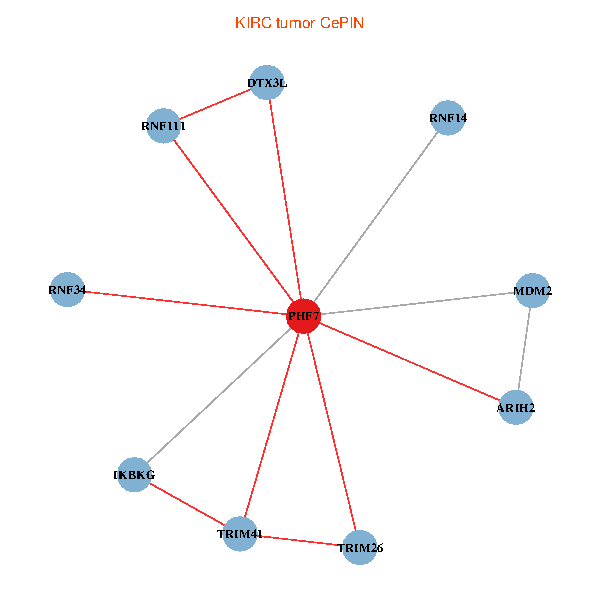
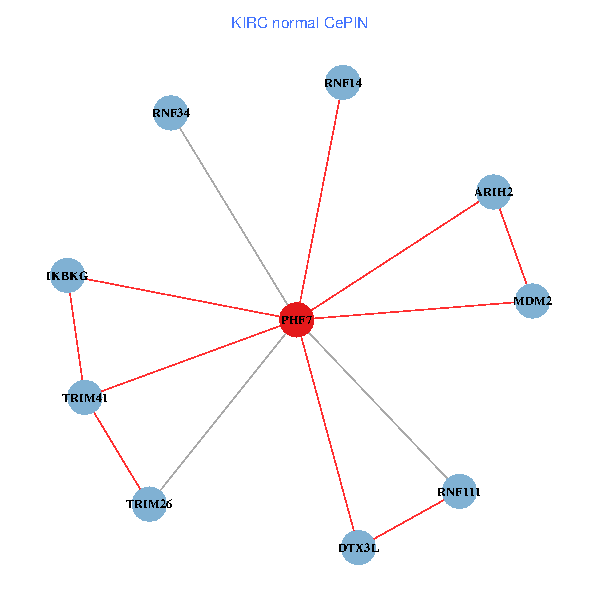
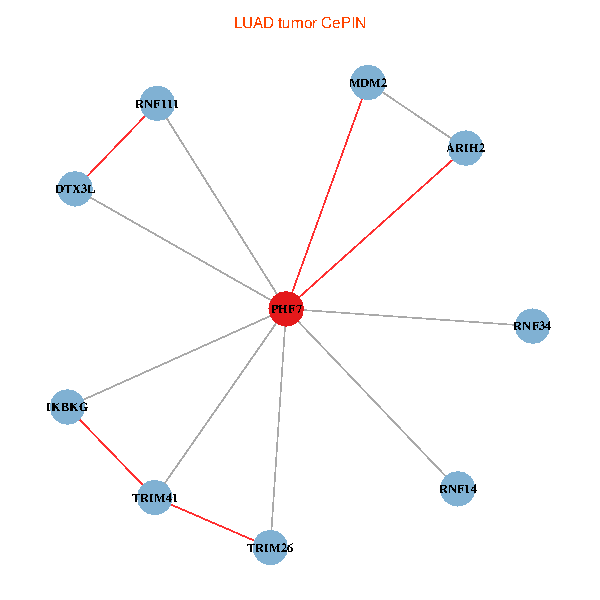
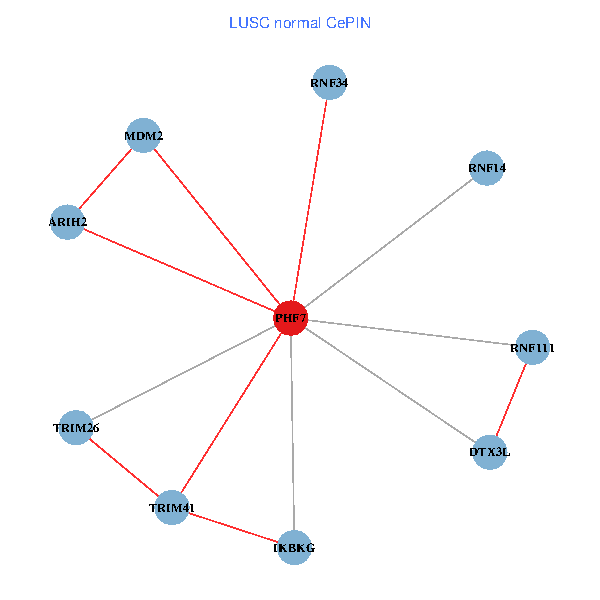
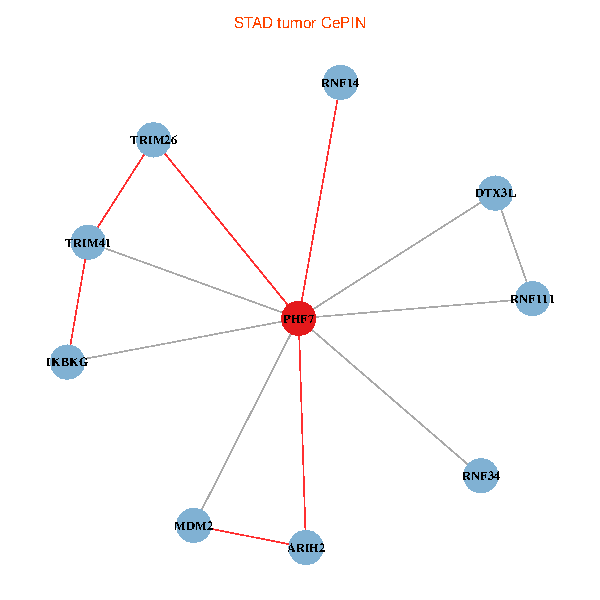
| Co-expressed gene networks based on protein-protein interaction data (CePIN) (TCGA IlluminaHiSeq_RNASeqV2, pan-cancer normalized log2(norm_counts+1) data, version 2016-08-16) (PINA2 ppi data) |
| BRCA (tumor) | BRCA (normal) |
| PHF7, MDM2, IKBKG, RNF111, RNF14, TRIM41, ARIH2, DTX3L, TRIM26, RNF34 (tumor) | PHF7, MDM2, IKBKG, RNF111, RNF14, TRIM41, ARIH2, DTX3L, TRIM26, RNF34 (normal) |
 |  |
| COAD (tumor) | COAD (normal) |
| PHF7, MDM2, IKBKG, RNF111, RNF14, TRIM41, ARIH2, DTX3L, TRIM26, RNF34 (tumor) | PHF7, MDM2, IKBKG, RNF111, RNF14, TRIM41, ARIH2, DTX3L, TRIM26, RNF34 (normal) |
 |  |
| HNSC (tumor) | HNSC (normal) |
| PHF7, MDM2, IKBKG, RNF111, RNF14, TRIM41, ARIH2, DTX3L, TRIM26, RNF34 (tumor) | PHF7, MDM2, IKBKG, RNF111, RNF14, TRIM41, ARIH2, DTX3L, TRIM26, RNF34 (normal) |
 |  |
| KICH (tumor) | KICH (normal) |
| PHF7, MDM2, IKBKG, RNF111, RNF14, TRIM41, ARIH2, DTX3L, TRIM26, RNF34 (tumor) | PHF7, MDM2, IKBKG, RNF111, RNF14, TRIM41, ARIH2, DTX3L, TRIM26, RNF34 (normal) |
 |  |
| KIRC (tumor) | KIRC (normal) |
| PHF7, MDM2, IKBKG, RNF111, RNF14, TRIM41, ARIH2, DTX3L, TRIM26, RNF34 (tumor) | PHF7, MDM2, IKBKG, RNF111, RNF14, TRIM41, ARIH2, DTX3L, TRIM26, RNF34 (normal) |
 |  |
| KIRP (tumor) | KIRP (normal) |
| PHF7, MDM2, IKBKG, RNF111, RNF14, TRIM41, ARIH2, DTX3L, TRIM26, RNF34 (tumor) | PHF7, MDM2, IKBKG, RNF111, RNF14, TRIM41, ARIH2, DTX3L, TRIM26, RNF34 (normal) |
 |  |
| LIHC (tumor) | LIHC (normal) |
| PHF7, MDM2, IKBKG, RNF111, RNF14, TRIM41, ARIH2, DTX3L, TRIM26, RNF34 (tumor) | PHF7, MDM2, IKBKG, RNF111, RNF14, TRIM41, ARIH2, DTX3L, TRIM26, RNF34 (normal) |
 |  |
| LUAD (tumor) | LUAD (normal) |
| PHF7, MDM2, IKBKG, RNF111, RNF14, TRIM41, ARIH2, DTX3L, TRIM26, RNF34 (tumor) | PHF7, MDM2, IKBKG, RNF111, RNF14, TRIM41, ARIH2, DTX3L, TRIM26, RNF34 (normal) |
 |  |
| LUSC (tumor) | LUSC (normal) |
| PHF7, MDM2, IKBKG, RNF111, RNF14, TRIM41, ARIH2, DTX3L, TRIM26, RNF34 (tumor) | PHF7, MDM2, IKBKG, RNF111, RNF14, TRIM41, ARIH2, DTX3L, TRIM26, RNF34 (normal) |
 |  |
| PRAD (tumor) | PRAD (normal) |
| PHF7, MDM2, IKBKG, RNF111, RNF14, TRIM41, ARIH2, DTX3L, TRIM26, RNF34 (tumor) | PHF7, MDM2, IKBKG, RNF111, RNF14, TRIM41, ARIH2, DTX3L, TRIM26, RNF34 (normal) |
 |  |
| STAD (tumor) | STAD (normal) |
| PHF7, MDM2, IKBKG, RNF111, RNF14, TRIM41, ARIH2, DTX3L, TRIM26, RNF34 (tumor) | PHF7, MDM2, IKBKG, RNF111, RNF14, TRIM41, ARIH2, DTX3L, TRIM26, RNF34 (normal) |
 |  |
| THCA (tumor) | THCA (normal) |
| PHF7, MDM2, IKBKG, RNF111, RNF14, TRIM41, ARIH2, DTX3L, TRIM26, RNF34 (tumor) | PHF7, MDM2, IKBKG, RNF111, RNF14, TRIM41, ARIH2, DTX3L, TRIM26, RNF34 (normal) |
 |  |
| Top |
| TissGeneProg for PHF7 |
| Kaplan-Meier plots with logrank tests of overall survival (OS) using 28 cancer types (TCGA IlluminaHiSeq_RNASeqV2, pan-cancer normalized log2(norm_counts+1) data, version 2016-08-16) (TCGA clinicalMatrix, phenotype data, version 2016-04-27) * Click on the image to enlarge it in a new window. |
 |
| Kaplan-Meier plots with logrank test of relapse free survival (RFS) using 28 cancer types (TCGA IlluminaHiSeq_RNASeqV2, pan-cancer normalized log2(norm_counts+1) data, version 2016-08-16) (TCGA clinicalMatrix, phenotype data, version 2016-04-27) * Click on the image enlarge it in a new window. |
 |
| Forest plot of Cox proportional hazard ratio (HR) and 95% CI of overall survival (OS) using 28 cancer types (TCGA IlluminaHiSeq_RNASeqV2, pan-cancer normalized log2(norm_counts+1) data, version 2016-08-16) (TCGA clinicalMatrix, phenotype data, version 2016-04-27) * Click on the image enlarge it in a new window. |
 |
| Forest plot of Cox proportional hazard ratio (HR) and 95% CI of relapse free survival (RFS) using 28 cancer types (TCGA IlluminaHiSeq_RNASeqV2, pan-cancer normalized log2(norm_counts+1) data, version 2016-08-16) (TCGA clinicalMatrix, phenotype data, version 2016-04-27) * Click on the image enlarge it in a new window. |
 |
| Top |
| TissGeneClin for PHF7 |
| TissGeneDrug for PHF7 |
| Drug information targeting TissGene (DrugBank Version 5.0.6, 2017-04-01) |
| DrugBank ID | Drug name | Drug activity | Drug type | Drug status |
| Top |
| TissGeneDisease for PHF7 |
| Disease information associated with TissGene (DisGeNet, 2016-06-01) |
| Disease ID | Disease name | # pubmeds | Source |
|
Copyright 2016-Present - The University of Texas Health Science Center at Houston (UTHealth) Web File Viewing | How to Report, Fraud, Waste and Abuse | State of Texas | Statewide Search | Texas Homeland Security | Site Policies |