 |
| |
| |
| |
| |
| |
| |
|

| TissGeneSummary for SERPINI2 |
 Gene summary Gene summary |
| Basic gene information | Gene symbol | SERPINI2 |
| Gene name | serpin peptidase inhibitor, clade I (pancpin), member 2 | |
| Synonyms | MEPI|PANCPIN|PI14|TSA2004 | |
| Cytomap | UCSC genome browser: 3q26.1 | |
| Type of gene | protein-coding | |
| RefGenes | NM_001012303.2, NM_006217.4, | |
| Description | myoepithelium-derived serine protease inhibitorpancreas-specific protein TSA2004peptidase inhibitor 14protease inhibitor 14serine (or cysteine) proteinase inhibitor, clade I (neuroserpin), member 2serine (or cysteine) proteinase inhibitor, clade I (p | |
| Modification date | 20141207 | |
| dbXrefs | MIM : 605587 | |
| HGNC : HGNC | ||
| Ensembl : ENSG00000114204 | ||
| HPRD : 05722 | ||
| Vega : OTTHUMG00000158231 | ||
| Protein | UniProt: go to UniProt's Cross Reference DB Table | |
| Expression | CleanEX: HS_SERPINI2 | |
| BioGPS: 5276 | ||
| Pathway | NCI Pathway Interaction Database: SERPINI2 | |
| KEGG: SERPINI2 | ||
| REACTOME: SERPINI2 | ||
| Pathway Commons: SERPINI2 | ||
| Context | iHOP: SERPINI2 | |
| ligand binding site mutation search in PubMed: SERPINI2 | ||
| UCL Cancer Institute: SERPINI2 | ||
| Assigned class in TissGDB* | B | |
| Included tissue-specific gene expression resources | HPA,TiGER,GTEx | |
| Specific-tissues in normal samples (assigned by TissGDB using HPA, TiGER, and GTEx) | Pancreas | |
| Cancer types related to the specific-tissues in cancer samples (assigned by TissGDB using TCGA) | PAAD | |
| Reference showing the relevant tissue of SERPINI2 | ||
| Description by TissGene annotations | ||
| * Class A consists of genes with literature evidence and is part of the cTissGenes. Class B consists of only cTissGenes without additional evidence. The remaining genes belong to Class C. |
| Gene ontology having evidence of Inferred from Direct Assay (IDA) from Entrez |
| GO ID | GO term | PubMed ID |
| Top |
| TissGeneExp for SERPINI2 |
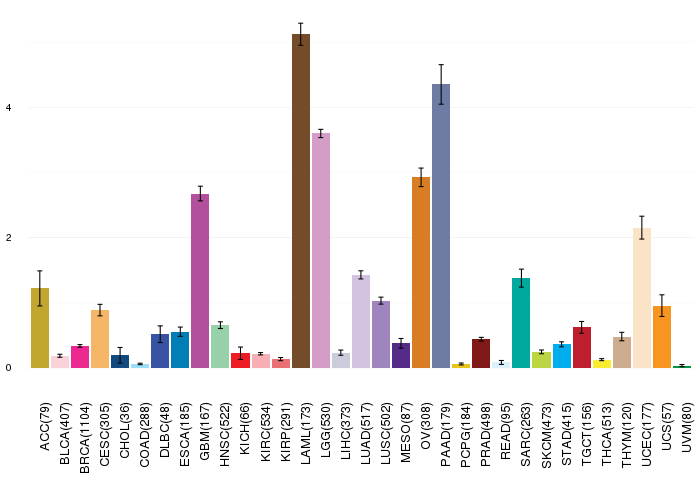
| Gene expressions across 28 cancer types (X-axis: cancer type and Y-axis: log2(norm_counts+1)) (TCGA IlluminaHiSeq_RNASeqV2, pan-cancer normalized log2(norm_counts+1) data, version 2016-08-16) |
 |
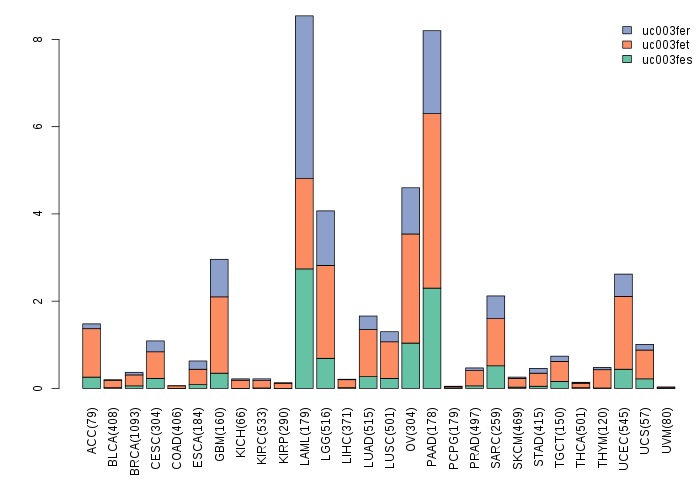
| Gene isoform expressions across 28 cancer types (X-axis: cancer type and Y-axis: log2(norm_counts+1)) (TCGA pan-cancer tcga_rsem_isoform_tpm, version 2016-09-01) |
 |
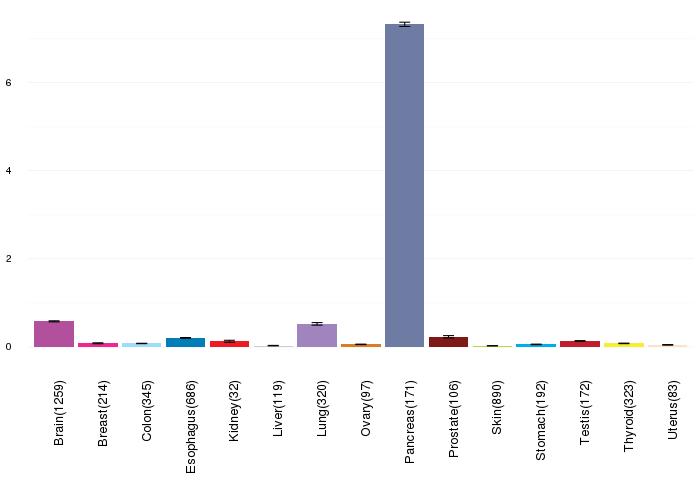
| Gene expressions across normal tissues of GTEx data (GTEx GTEx_Analysis_v6_RNA-seq_RNA-SeQCv1.1.8_gene_rpkm.gct) - Here, we shows the matched tissue types only among our 28 cancer types. |
 |
| Different expressions across 14 cancer types with more than 10 samples between matched tumors and normals (X-axis: cancer type and Y-axis: log2(norm_counts+1)) (TCGA IlluminaHiSeq_RNASeqV2, pan-cancer normalized log2(norm_counts+1) data, version 2016-08-16) |
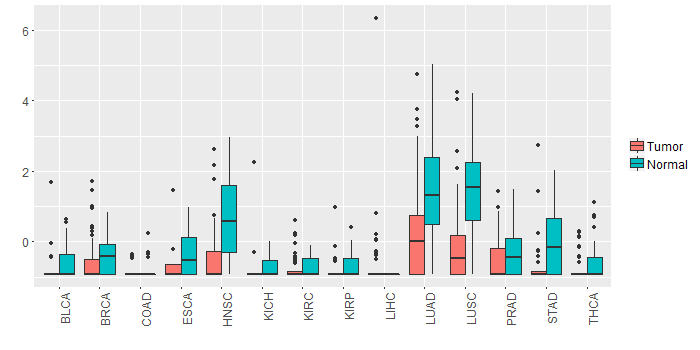 |
| - Significantly differentially expressed cancer types and information. (|Fold change|>1 and FDR<0.05) |
| Cancer type | Mean(exp) in tumor | Mean(exp) in matched normal | Log2FC | P-val. | FDR |
| LUAD | 0.274960509 | 1.464486371 | -1.189525862 | 8.63E-06 | 2.55E-05 |
| LUSC | -0.079591418 | 1.489912503 | -1.569503922 | 6.97E-09 | 2.23E-08 |
| HNSC | -0.383874455 | 0.618190661 | -1.002065116 | 2.46E-05 | 0.000127829 |
| Top |
| TissGene-miRNA for SERPINI2 |
| Significantly anti-correlated miRNAs of TissGene across 28 cancer types (Gene-miRNA relations from TargetScanHuman Relsease 7.1, Conserved_Site_Context_Scores.txt.zip, 06.01.2016) (TCGA IlluminaHiSeq_miRNASeq, log2(RPM+1) data, version 2016-11-21) (TCGA IlluminaHiSeq_RNASeqV2, log2(normalized_count+1) data, version 2016-08-16) (Spearman’s Rank Correlation (p-value<0.05 and coefficient<-0.25)) |
| Cancer type | miRNA id | miRNA accession | P-val. | Coeff. | # samples |
| Top |
| TissGeneMut for SERPINI2 |
| TissGeneSNV for SERPINI2 |
| nsSNV counts per each loci. Different colors of circles represent different cancer types. Circle size denotes number of samples. (TCGA somatic mutation (SNPs and small INDELs) data, version 2016-04-25) * Click on the image to enlarge it in a new window. |
 |
 |
| Somatic nucleotide variants of TissGene across 28 cancer types (X-axis: cancer type and Y-axis: % of mutated samples) The numbers in parentheses are numbers of samples with mutation (nsSNVs). (TCGA somatic mutation (SNPs and small INDELs) data, version 2016-04-25) |
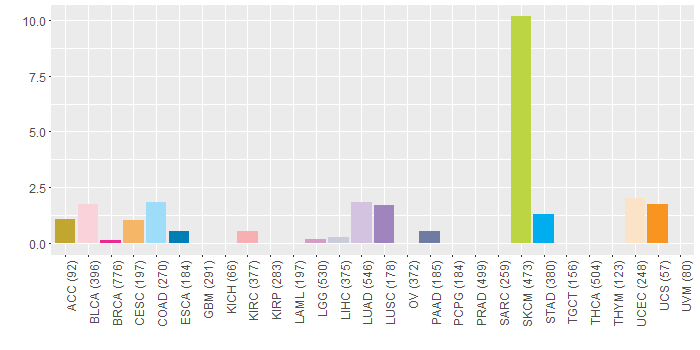 |
| - nsSNVs sorted by frequency. |
| AAchange | Cancer type | # samples |
| p.E102K | SKCM | 2 |
| p.P392S | SKCM | 2 |
| p.S323L | SKCM | 2 |
| p.G387E | SKCM | 2 |
| p.D316N | SKCM | 2 |
| p.P214S | SKCM | 2 |
| p.G399E | SKCM | 2 |
| p.G399R | SKCM | 2 |
| p.E112K | SKCM | 2 |
| p.E169K | SKCM | 2 |
| p.E94D | STAD | 1 |
| p.S228C | HNSC | 1 |
| p.Q330K | KIRC | 1 |
| p.G15R | UCEC | 1 |
| p.L262F | SKCM | 1 |
| p.S230F | SKCM | 1 |
| p.E28K | UCEC | 1 |
| p.Q330* | HNSC | 1 |
| p.G187V | HNSC | 1 |
| p.S81L | BLCA | 1 |
| p.L89P | CESC | 1 |
| p.A120S | KIRC | 1 |
| p.N202K | STAD | 1 |
| p.D411Y | PAAD | 1 |
| p.A264P | LUSC | 1 |
| p.G329E | SKCM | 1 |
| p.S333L | SKCM | 1 |
| p.E139K | SKCM | 1 |
| p.E293Q | LUAD | 1 |
| p.K291* | SKCM | 1 |
| p.Q24* | SKCM | 1 |
| p.T321A | COAD | 1 |
| p.S363N | READ | 1 |
| p.E263K | READ | 1 |
| p.R400K | SKCM | 1 |
| p.Q269* | SKCM | 1 |
| p.G319R | SKCM | 1 |
| p.E148G | COAD | 1 |
| p.G329R | SKCM | 1 |
| p.E38K | SKCM | 1 |
| p.Q78P | BLCA | 1 |
| p.N207I | SKCM | 1 |
| p.L252F | SKCM | 1 |
| p.E355K | SKCM | 1 |
| p.F96C | ESCA | 1 |
| p.P173S | SKCM | 1 |
| p.S228F | SKCM | 1 |
| p.K25T | READ | 1 |
| p.T348I | LUAD | 1 |
| p.Q45X | SKCM | 1 |
| p.G61E | STAD | 1 |
| p.D401N | SKCM | 1 |
| p.E139G | SKCM | 1 |
| p.E325K | SKCM | 1 |
| p.G51E | STAD | 1 |
| p.F14L | SKCM | 1 |
| p.E319Q | SKCM | 1 |
| p.Q68K | HNSC | 1 |
| p.Q34X | STAD | 1 |
| p.E129K | SKCM | 1 |
| p.P49L | SKCM | 1 |
| p.K144N | UCEC | 1 |
| p.E335K | SKCM | 1 |
| p.F336L | UCEC | 1 |
| p.E263K | SKCM | 1 |
| p.P59H | LUSC | 1 |
| p.G319E | SKCM | 1 |
| p.E255Q | BLCA | 1 |
| p.Q201L | LIHC | 1 |
| p.E129G | SKCM | 1 |
| p.L384M | UCEC | 1 |
| p.E28K | SKCM | 1 |
| p.H41Y | LUAD | 1 |
| p.G15E | SKCM | 1 |
| p.M215I | LUAD | 1 |
| p.E238K | SKCM | 1 |
| p.I366T | LUAD | 1 |
| p.S304Y | BLCA | 1 |
| p.Q24* | STAD | 1 |
| p.A110S | KIRC | 1 |
| p.G409R | SKCM | 1 |
| p.E57K | SKCM | 1 |
| p.L174V | BLCA | 1 |
| p.L6V | COAD | 1 |
| p.P224S | SKCM | 1 |
| p.K154E | LUSC | 1 |
| p.S48L | SKCM | 1 |
| p.M226I | STAD | 1 |
| p.G170R | ACC | 1 |
| p.E284K | SKCM | 1 |
| p.S324F | BLCA | 1 |
| p.L124V | BRCA | 1 |
| p.Q191L | LIHC | 1 |
| p.P392S | COAD | 1 |
| p.A347S | LUAD | 1 |
| p.E271K | SKCM | 1 |
| p.E84D | STAD | 1 |
| p.E261K | SKCM | 1 |
| p.R194K | SKCM | 1 |
| p.M216I | COAD | 1 |
| p.A218D | LUAD | 1 |
| p.M216I | STAD | 1 |
| p.F86C | ESCA | 1 |
| p.Q70R | UCEC | 1 |
| p.V211I | CESC | 1 |
| p.P370T | LUAD | 1 |
| p.Q24H | COAD | 1 |
| p.D401Y | PAAD | 1 |
| p.P59L | SKCM | 1 |
| p.Q80R | UCEC | 1 |
| p.S404L | SKCM | 1 |
| p.A346D | LUAD | 1 |
| p.E36D | LGG | 1 |
| p.E263D | SKCM | 1 |
| p.S38F | SKCM | 1 |
| p.S167L | LUAD | 1 |
| p.E273K | SKCM | 1 |
| p.E67K | SKCM | 1 |
| p.S58L | SKCM | 1 |
| p.S382L | BLCA | 1 |
| p.S382L | SKCM | 1 |
| p.Q35* | SKCM | 1 |
| p.E85* | UCS | 1 |
| p.E309Q | SKCM | 1 |
| p.I393V | DLBC | 1 |
| Top |
| TissGeneCNV for SERPINI2 |
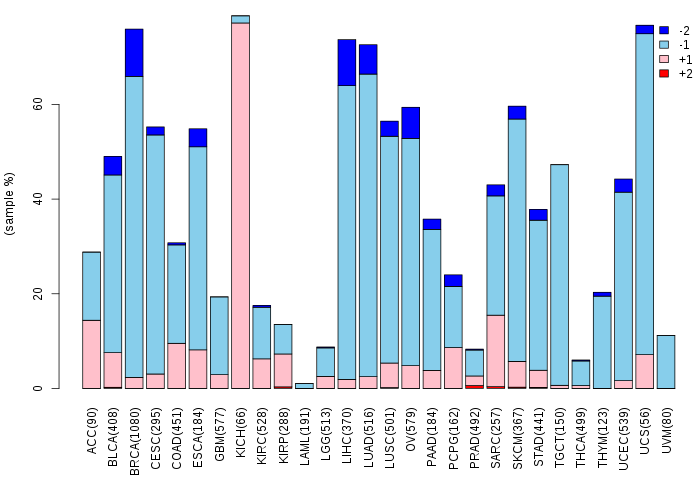
| Copy number variations of TissGene across 28 cancer types (X-axis: cancer type and Y-axis: % of CNV samples) (TCGA Gistic2_CopyNumber_Gistic2_all_data_by_genes, Gistic2 copy number data, version 2016-08-16) |
 |
| Top |
| TissGeneFusions for SERPINI2 |
| Fusion genes including TissGene (ChimerDB 3.0, 2016-12-01 and TCGA fusion Portal 2015-12-01) |
| Database | Src | Cancer type | Sample | Fusion gene | ORF | 5'-gene BP | 3'-gene BP |
| Chimerdb3.0 | ChiTaRs | NA | CK824479 | SERPINI2-MED13L | chr3:167173955 | chr12:116558166 | |
| Chimerdb3.0 | ChiTaRs | NA | CK824480 | MED13L-SERPINI2 | chr12:116558273 | chr3:167173569 |
| Top |
| TissGeneNet for SERPINI2 |
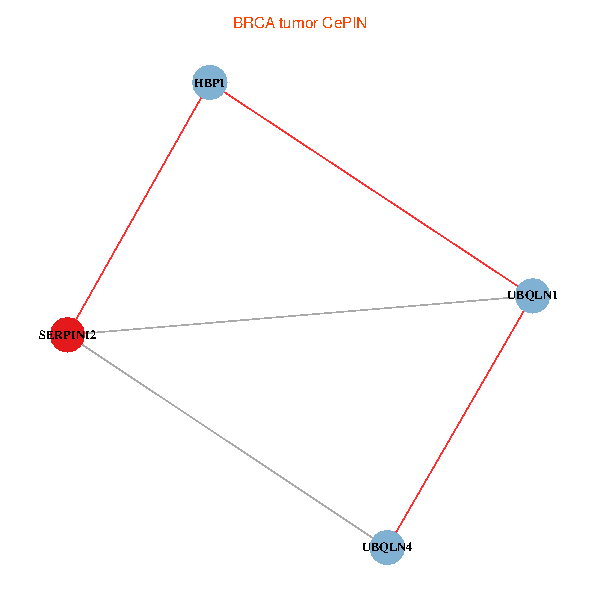
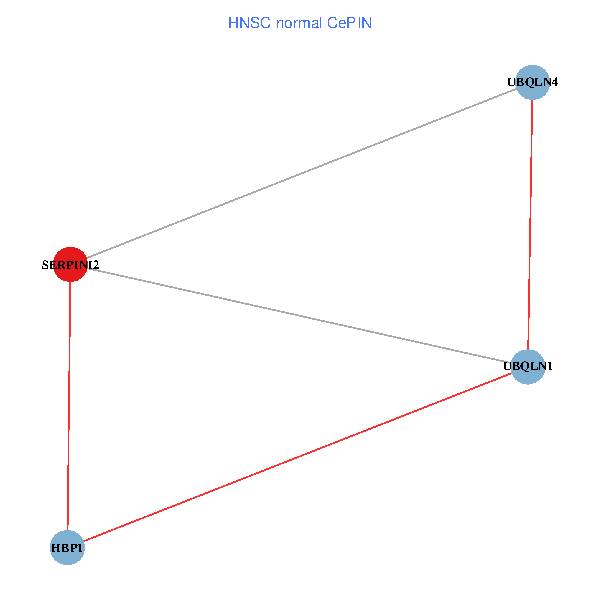
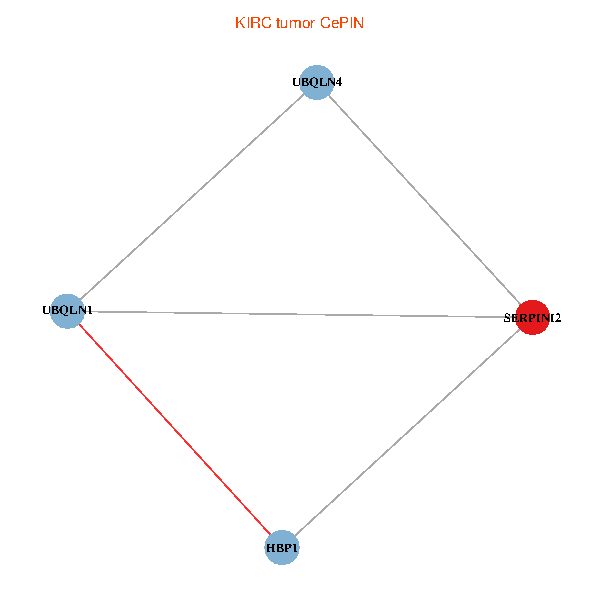
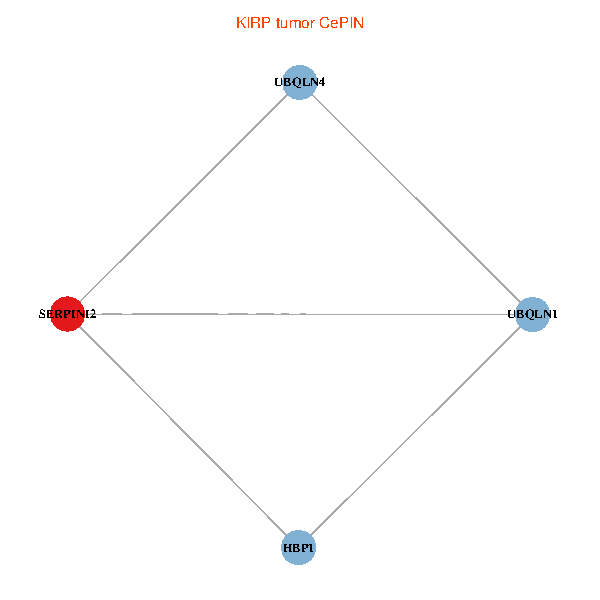
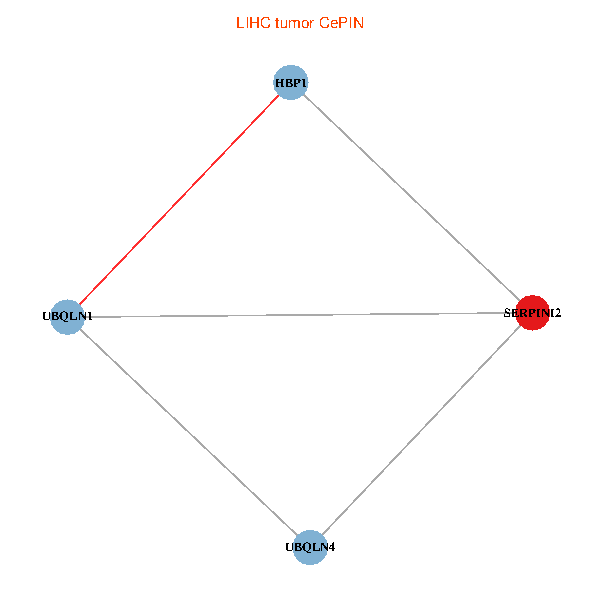
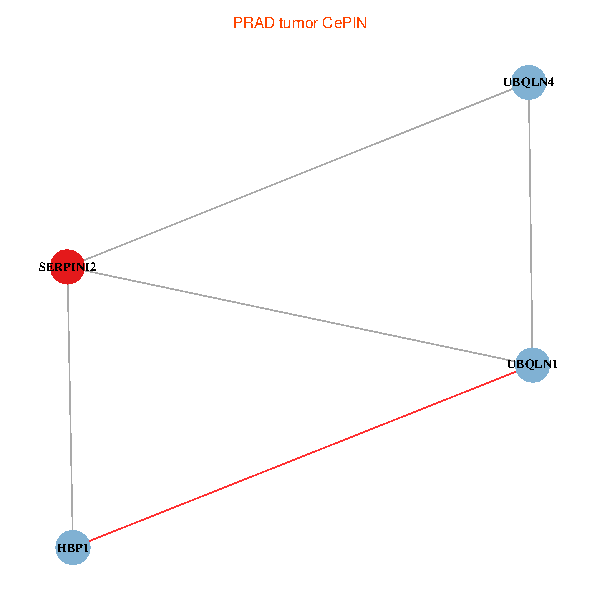
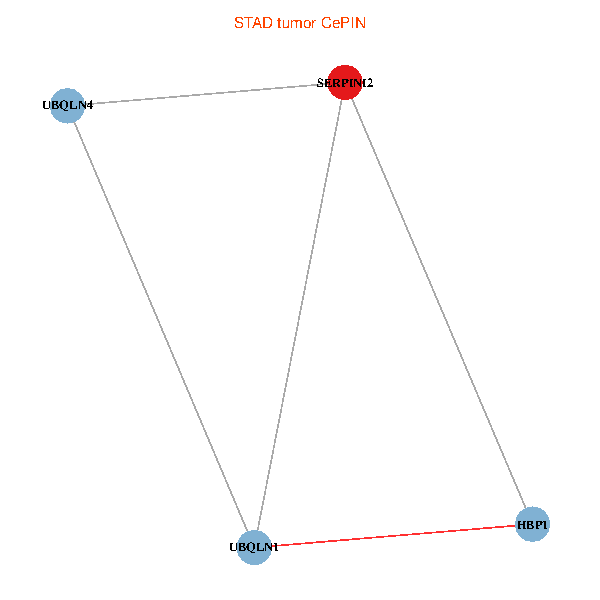
| Co-expressed gene networks based on protein-protein interaction data (CePIN) (TCGA IlluminaHiSeq_RNASeqV2, pan-cancer normalized log2(norm_counts+1) data, version 2016-08-16) (PINA2 ppi data) |
| BRCA (tumor) | BRCA (normal) |
| SERPINI2, HBP1, UBQLN1, UBQLN4 (tumor) | SERPINI2, HBP1, UBQLN1, UBQLN4 (normal) |
 |  |
| COAD (tumor) | COAD (normal) |
| SERPINI2, HBP1, UBQLN1, UBQLN4 (tumor) | SERPINI2, HBP1, UBQLN1, UBQLN4 (normal) |
 |  |
| HNSC (tumor) | HNSC (normal) |
| SERPINI2, HBP1, UBQLN1, UBQLN4 (tumor) | SERPINI2, HBP1, UBQLN1, UBQLN4 (normal) |
 |  |
| KICH (tumor) | KICH (normal) |
| SERPINI2, HBP1, UBQLN1, UBQLN4 (tumor) | SERPINI2, HBP1, UBQLN1, UBQLN4 (normal) |
 |  |
| KIRC (tumor) | KIRC (normal) |
| SERPINI2, HBP1, UBQLN1, UBQLN4 (tumor) | SERPINI2, HBP1, UBQLN1, UBQLN4 (normal) |
 |  |
| KIRP (tumor) | KIRP (normal) |
| SERPINI2, HBP1, UBQLN1, UBQLN4 (tumor) | SERPINI2, HBP1, UBQLN1, UBQLN4 (normal) |
 |  |
| LIHC (tumor) | LIHC (normal) |
| SERPINI2, HBP1, UBQLN1, UBQLN4 (tumor) | SERPINI2, HBP1, UBQLN1, UBQLN4 (normal) |
 |  |
| LUAD (tumor) | LUAD (normal) |
| SERPINI2, HBP1, UBQLN1, UBQLN4 (tumor) | SERPINI2, HBP1, UBQLN1, UBQLN4 (normal) |
 |  |
| LUSC (tumor) | LUSC (normal) |
| SERPINI2, HBP1, UBQLN1, UBQLN4 (tumor) | SERPINI2, HBP1, UBQLN1, UBQLN4 (normal) |
 |  |
| PRAD (tumor) | PRAD (normal) |
| SERPINI2, HBP1, UBQLN1, UBQLN4 (tumor) | SERPINI2, HBP1, UBQLN1, UBQLN4 (normal) |
 |  |
| STAD (tumor) | STAD (normal) |
| SERPINI2, HBP1, UBQLN1, UBQLN4 (tumor) | SERPINI2, HBP1, UBQLN1, UBQLN4 (normal) |
 |  |
| THCA (tumor) | THCA (normal) |
| SERPINI2, HBP1, UBQLN1, UBQLN4 (tumor) | SERPINI2, HBP1, UBQLN1, UBQLN4 (normal) |
 |  |
| Top |
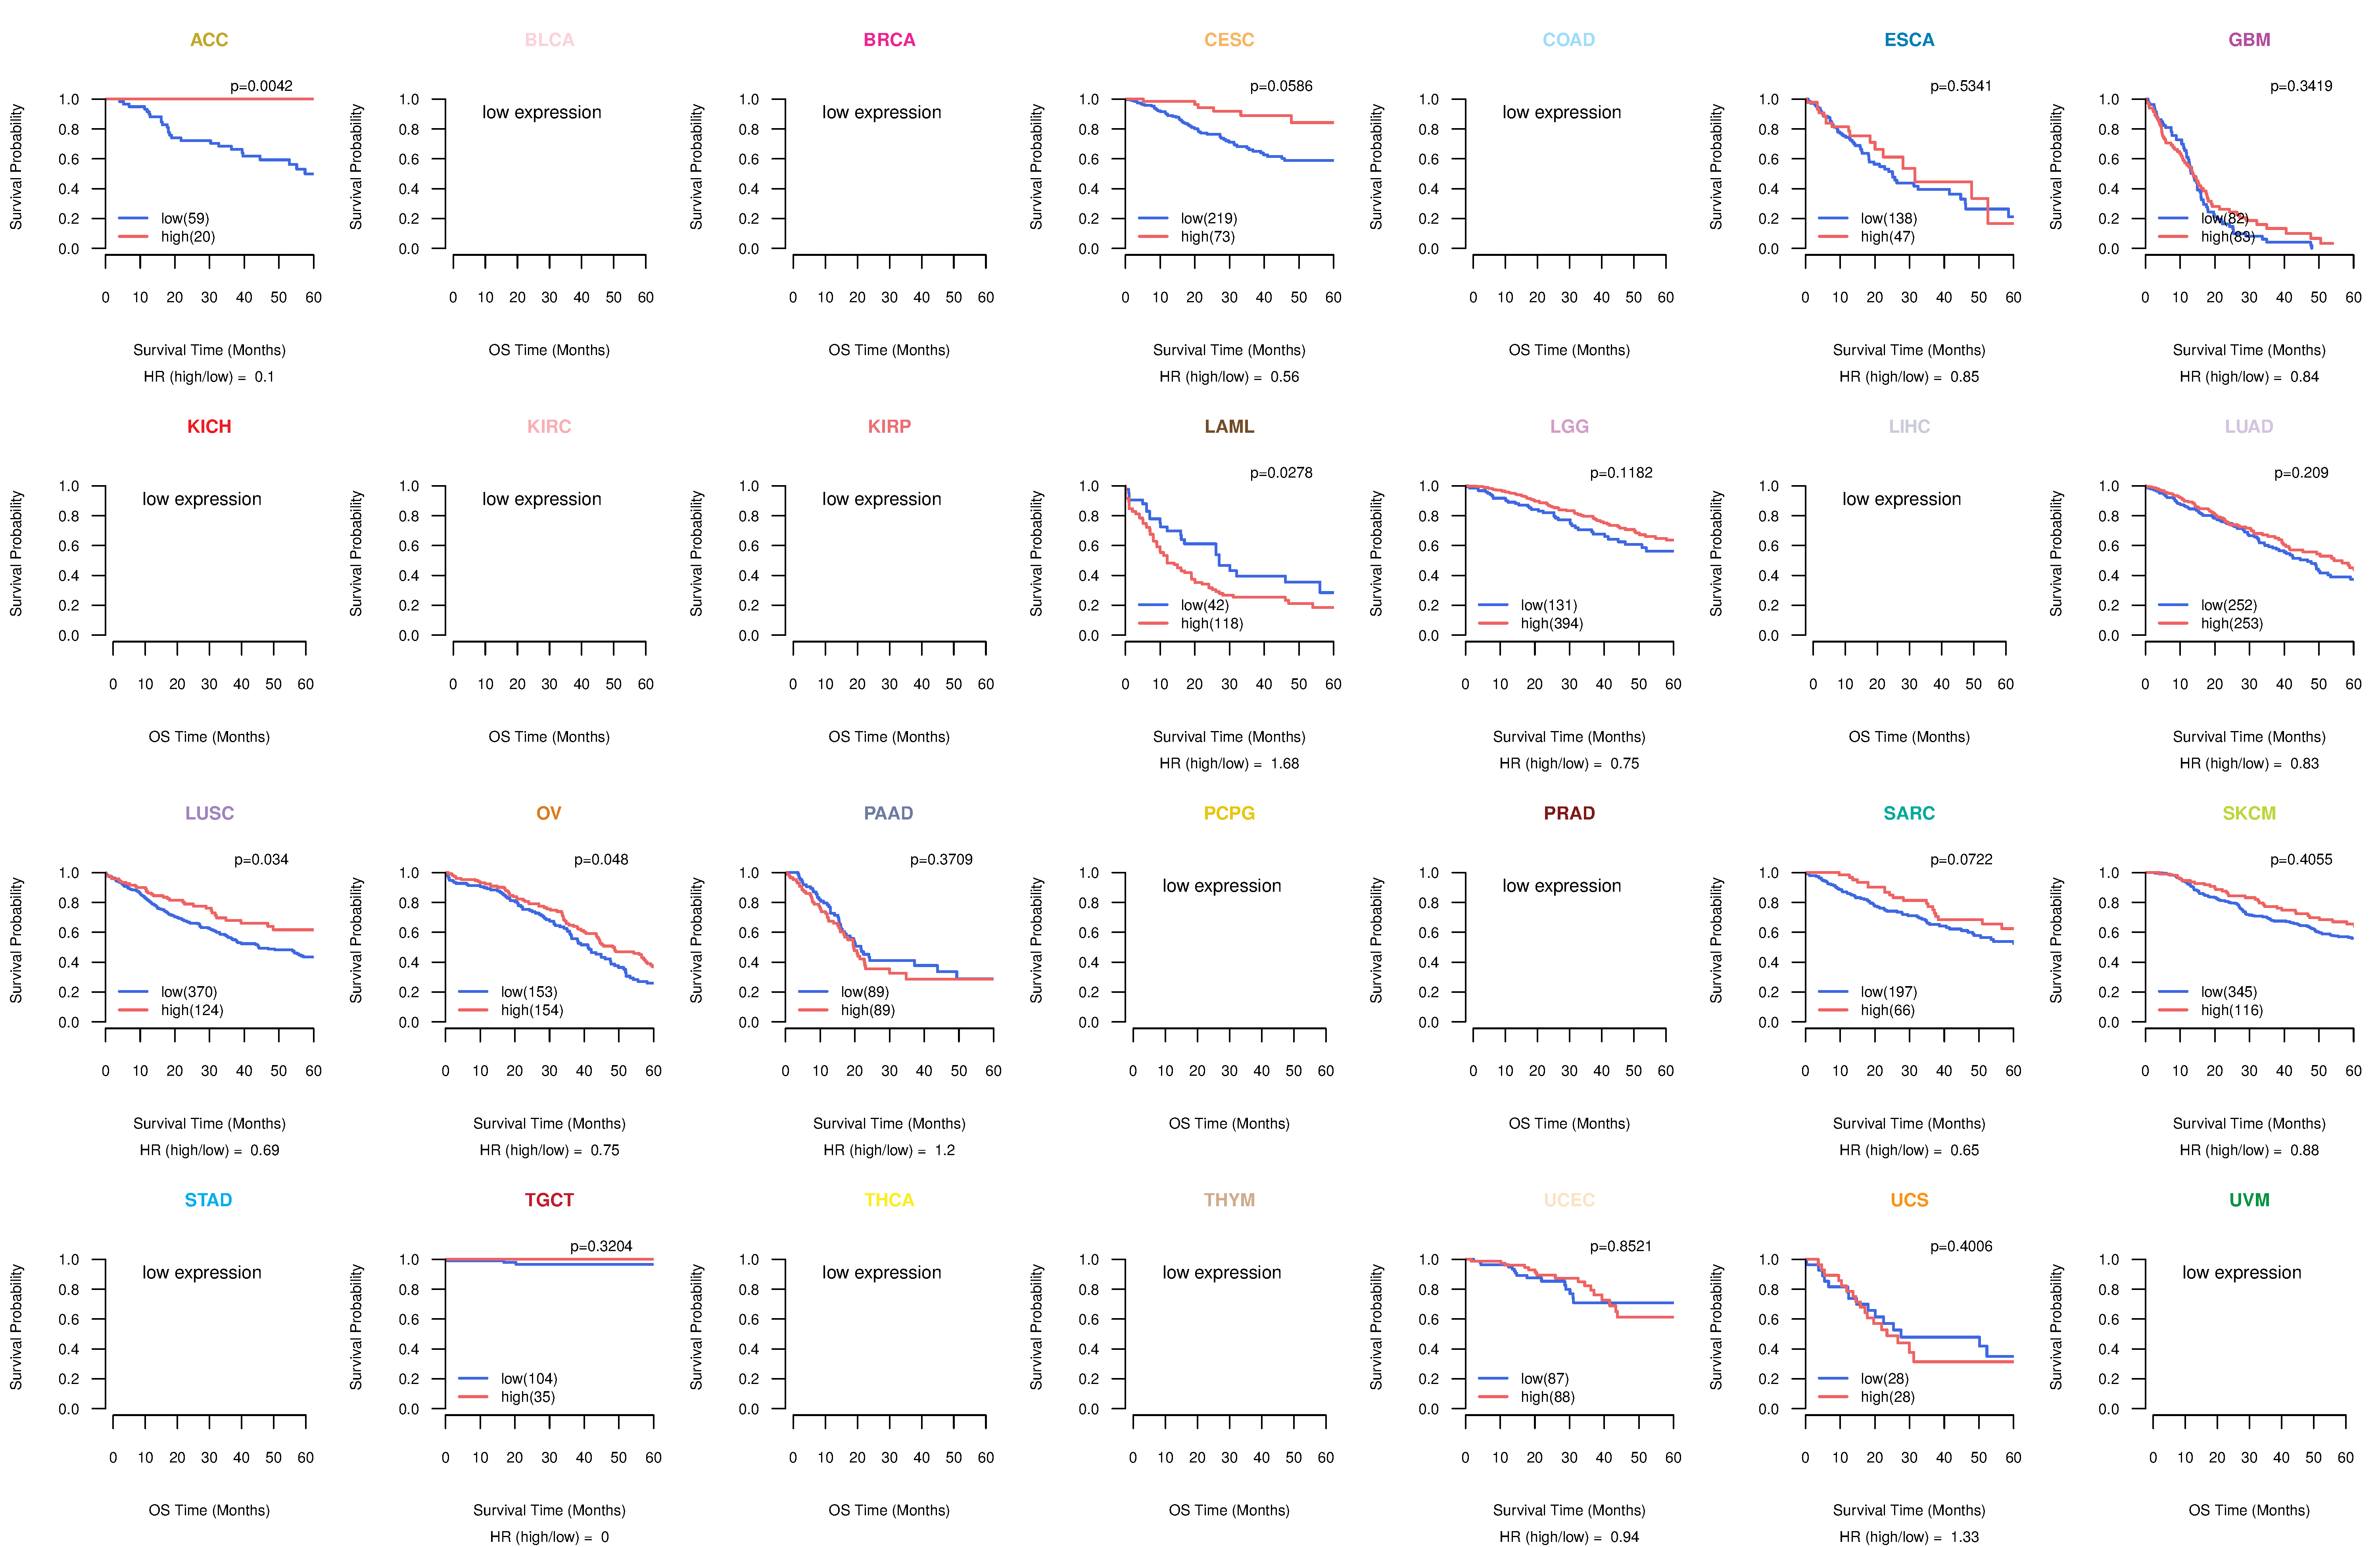
| TissGeneProg for SERPINI2 |
| Kaplan-Meier plots with logrank tests of overall survival (OS) using 28 cancer types (TCGA IlluminaHiSeq_RNASeqV2, pan-cancer normalized log2(norm_counts+1) data, version 2016-08-16) (TCGA clinicalMatrix, phenotype data, version 2016-04-27) * Click on the image to enlarge it in a new window. |
 |
| Kaplan-Meier plots with logrank test of relapse free survival (RFS) using 28 cancer types (TCGA IlluminaHiSeq_RNASeqV2, pan-cancer normalized log2(norm_counts+1) data, version 2016-08-16) (TCGA clinicalMatrix, phenotype data, version 2016-04-27) * Click on the image enlarge it in a new window. |
 |
| Forest plot of Cox proportional hazard ratio (HR) and 95% CI of overall survival (OS) using 28 cancer types (TCGA IlluminaHiSeq_RNASeqV2, pan-cancer normalized log2(norm_counts+1) data, version 2016-08-16) (TCGA clinicalMatrix, phenotype data, version 2016-04-27) * Click on the image enlarge it in a new window. |
 |
| Forest plot of Cox proportional hazard ratio (HR) and 95% CI of relapse free survival (RFS) using 28 cancer types (TCGA IlluminaHiSeq_RNASeqV2, pan-cancer normalized log2(norm_counts+1) data, version 2016-08-16) (TCGA clinicalMatrix, phenotype data, version 2016-04-27) * Click on the image enlarge it in a new window. |
 |
| Top |
| TissGeneClin for SERPINI2 |
| TissGeneDrug for SERPINI2 |
| Drug information targeting TissGene (DrugBank Version 5.0.6, 2017-04-01) |
| DrugBank ID | Drug name | Drug activity | Drug type | Drug status |
| Top |
| TissGeneDisease for SERPINI2 |
| Disease information associated with TissGene (DisGeNet, 2016-06-01) |
| Disease ID | Disease name | # pubmeds | Source |
| umls:C0027092 | Myopia | 1 | BeFree |
| umls:C0034951 | Refractive Errors | 1 | BeFree |
| umls:C0272170 | Shwachman syndrome | 0 | MGD |
| umls:C1850081 | Pancreatic Insufficiency, Combined Exocrine | 0 | MGD |
|
Copyright 2016-Present - The University of Texas Health Science Center at Houston (UTHealth) Web File Viewing | How to Report, Fraud, Waste and Abuse | State of Texas | Statewide Search | Texas Homeland Security | Site Policies |