 |
| |
| |
| |
| |
| |
| |
|

| TissGeneSummary for PLA2G5 |
 Gene summary Gene summary |
| Basic gene information | Gene symbol | PLA2G5 |
| Gene name | phospholipase A2, group V | |
| Synonyms | FRFB|GV-PLA2|PLA2-10|hVPLA(2) | |
| Cytomap | UCSC genome browser: 1p36-p34 | |
| Type of gene | protein-coding | |
| RefGenes | NM_000929.2, | |
| Description | Ca2+-dependent phospholipase A2calcium-dependent phospholipase A2phosphatidylcholine 2-acylhydrolase 5 | |
| Modification date | 20141207 | |
| dbXrefs | MIM : 601192 | |
| HGNC : HGNC | ||
| Ensembl : ENSG00000127472 | ||
| HPRD : 03117 | ||
| Vega : OTTHUMG00000002698 | ||
| Protein | UniProt: go to UniProt's Cross Reference DB Table | |
| Expression | CleanEX: HS_PLA2G5 | |
| BioGPS: 5322 | ||
| Pathway | NCI Pathway Interaction Database: PLA2G5 | |
| KEGG: PLA2G5 | ||
| REACTOME: PLA2G5 | ||
| Pathway Commons: PLA2G5 | ||
| Context | iHOP: PLA2G5 | |
| ligand binding site mutation search in PubMed: PLA2G5 | ||
| UCL Cancer Institute: PLA2G5 | ||
| Assigned class in TissGDB* | C | |
| Included tissue-specific gene expression resources | TiGER,GTEx | |
| Specific-tissues in normal samples (assigned by TissGDB using HPA, TiGER, and GTEx) | OvaryEye | |
| Cancer types related to the specific-tissues in cancer samples (assigned by TissGDB using TCGA) | OVUVM | |
| Reference showing the relevant tissue of PLA2G5 | ||
| Description by TissGene annotations | ||
| * Class A consists of genes with literature evidence and is part of the cTissGenes. Class B consists of only cTissGenes without additional evidence. The remaining genes belong to Class C. |
| Gene ontology having evidence of Inferred from Direct Assay (IDA) from Entrez |
| GO ID | GO term | PubMed ID |
| Top |
| TissGeneExp for PLA2G5 |
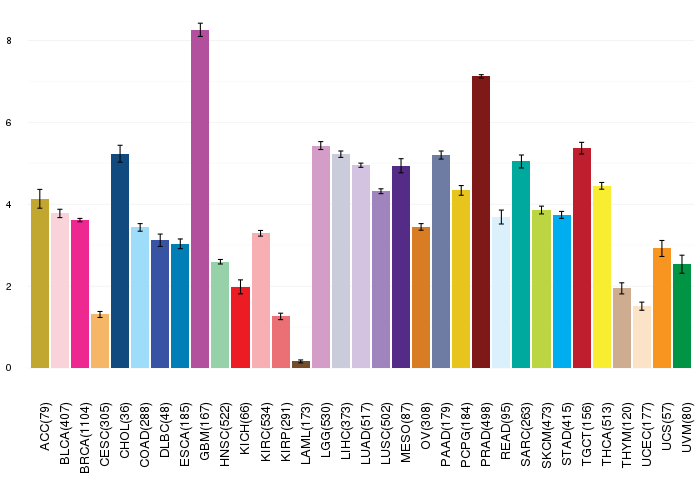
| Gene expressions across 28 cancer types (X-axis: cancer type and Y-axis: log2(norm_counts+1)) (TCGA IlluminaHiSeq_RNASeqV2, pan-cancer normalized log2(norm_counts+1) data, version 2016-08-16) |
 |
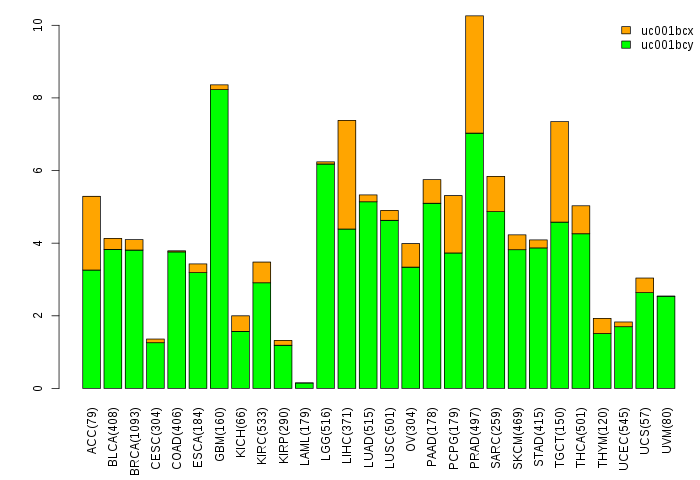
| Gene isoform expressions across 28 cancer types (X-axis: cancer type and Y-axis: log2(norm_counts+1)) (TCGA pan-cancer tcga_rsem_isoform_tpm, version 2016-09-01) |
 |
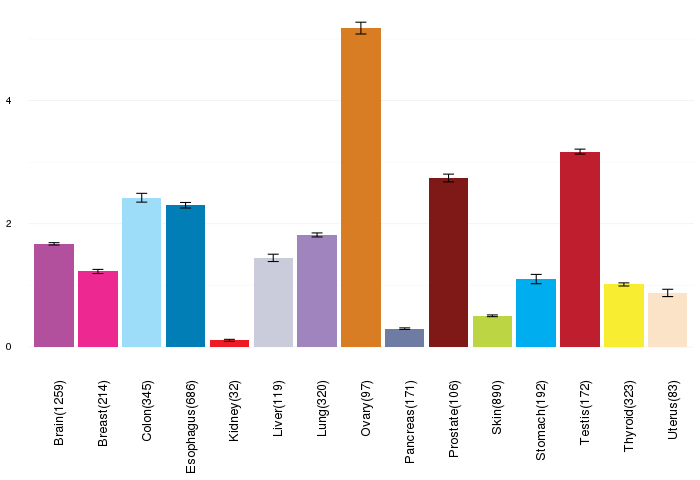
| Gene expressions across normal tissues of GTEx data (GTEx GTEx_Analysis_v6_RNA-seq_RNA-SeQCv1.1.8_gene_rpkm.gct) - Here, we shows the matched tissue types only among our 28 cancer types. |
 |
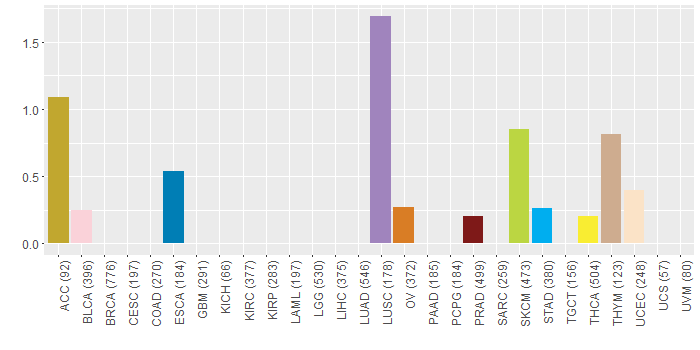
| Different expressions across 14 cancer types with more than 10 samples between matched tumors and normals (X-axis: cancer type and Y-axis: log2(norm_counts+1)) (TCGA IlluminaHiSeq_RNASeqV2, pan-cancer normalized log2(norm_counts+1) data, version 2016-08-16) |
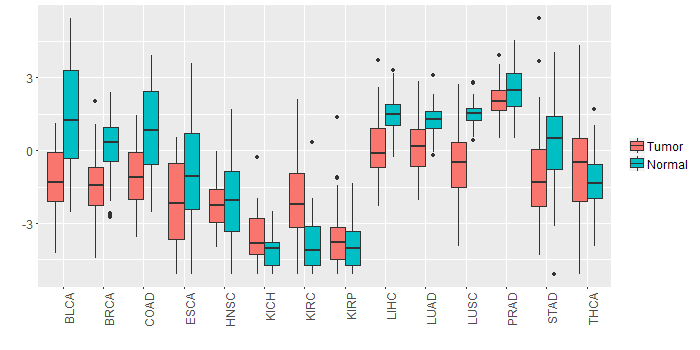 |
| - Significantly differentially expressed cancer types and information. (|Fold change|>1 and FDR<0.05) |
| Cancer type | Mean(exp) in tumor | Mean(exp) in matched normal | Log2FC | P-val. | FDR |
| LUSC | -0.605267483 | 1.479197223 | -2.084464706 | 1.01E-13 | 5.25E-13 |
| LUAD | 0.138475553 | 1.294456588 | -1.155981034 | 5.11E-10 | 2.82E-09 |
| LIHC | 0.121252243 | 1.471894243 | -1.350642 | 2.08E-08 | 1.70E-07 |
| BRCA | -1.449616038 | 0.228249751 | -1.677865789 | 1.49E-22 | 1.28E-21 |
| KIRC | -2.062787091 | -3.954342646 | 1.891555556 | 2.41E-14 | 1.16E-13 |
| BLCA | -1.250080073 | 1.470767295 | -2.720847368 | 0.00035 | 0.003034295 |
| COAD | -1.11518068 | 0.837323166 | -1.952503846 | 5.91E-05 | 0.000229182 |
| Top |
| TissGene-miRNA for PLA2G5 |
| Significantly anti-correlated miRNAs of TissGene across 28 cancer types (Gene-miRNA relations from TargetScanHuman Relsease 7.1, Conserved_Site_Context_Scores.txt.zip, 06.01.2016) (TCGA IlluminaHiSeq_miRNASeq, log2(RPM+1) data, version 2016-11-21) (TCGA IlluminaHiSeq_RNASeqV2, log2(normalized_count+1) data, version 2016-08-16) (Spearman’s Rank Correlation (p-value<0.05 and coefficient<-0.25)) |
| Cancer type | miRNA id | miRNA accession | P-val. | Coeff. | # samples |
| Top |
| TissGeneMut for PLA2G5 |
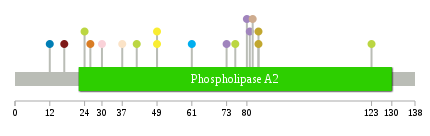
| TissGeneSNV for PLA2G5 |
| nsSNV counts per each loci. Different colors of circles represent different cancer types. Circle size denotes number of samples. (TCGA somatic mutation (SNPs and small INDELs) data, version 2016-04-25) * Click on the image to enlarge it in a new window. |
 |
 |
| Somatic nucleotide variants of TissGene across 28 cancer types (X-axis: cancer type and Y-axis: % of mutated samples) The numbers in parentheses are numbers of samples with mutation (nsSNVs). (TCGA somatic mutation (SNPs and small INDELs) data, version 2016-04-25) |
 |
| - nsSNVs sorted by frequency. |
| AAchange | Cancer type | # samples |
| p.A17V | PRAD | 1 |
| p.A12T | ESCA | 1 |
| p.W81* | LUSC | 1 |
| p.D61N | STAD | 1 |
| p.V94M | READ | 1 |
| p.Q84X | ACC | 1 |
| p.R123Q | SKCM | 1 |
| p.G100R | DLBC | 1 |
| p.E76K | SKCM | 1 |
| p.G73S | LUSC | 1 |
| p.G42R | SKCM | 1 |
| p.A37T | UCEC | 1 |
| p.K26R | OV | 1 |
| p.D24E | SKCM | 1 |
| p.Q84* | ACC | 1 |
| p.G80S | LUSC | 1 |
| p.G49R | THCA | 1 |
| p.R82L | THYM | 1 |
| p.E30Q | BLCA | 1 |
| p.L122P | READ | 1 |
| p.G49V | THCA | 1 |
| Top |
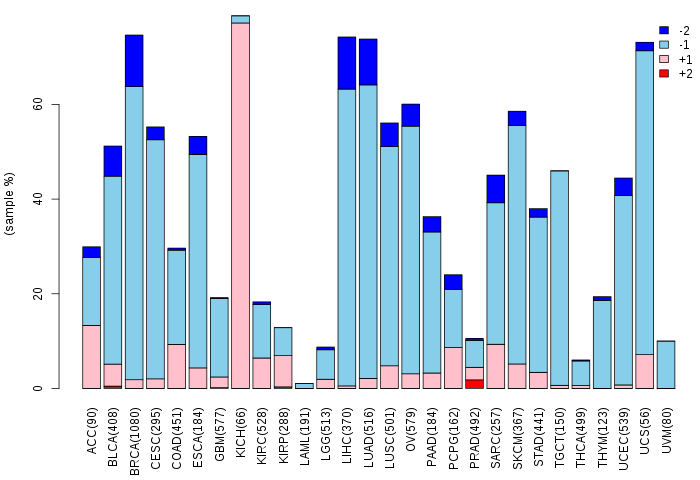
| TissGeneCNV for PLA2G5 |
| Copy number variations of TissGene across 28 cancer types (X-axis: cancer type and Y-axis: % of CNV samples) (TCGA Gistic2_CopyNumber_Gistic2_all_data_by_genes, Gistic2 copy number data, version 2016-08-16) |
 |
| Top |
| TissGeneFusions for PLA2G5 |
| Fusion genes including TissGene (ChimerDB 3.0, 2016-12-01 and TCGA fusion Portal 2015-12-01) |
| Database | Src | Cancer type | Sample | Fusion gene | ORF | 5'-gene BP | 3'-gene BP |
| TCGAfusionPortal | PRADA | SKCM | TCGA-EB-A42Z-01A | ECE1-PLA2G5 | CDS-5UTR | Chr1:21616563 | Chr1:20411314 |
| Top |
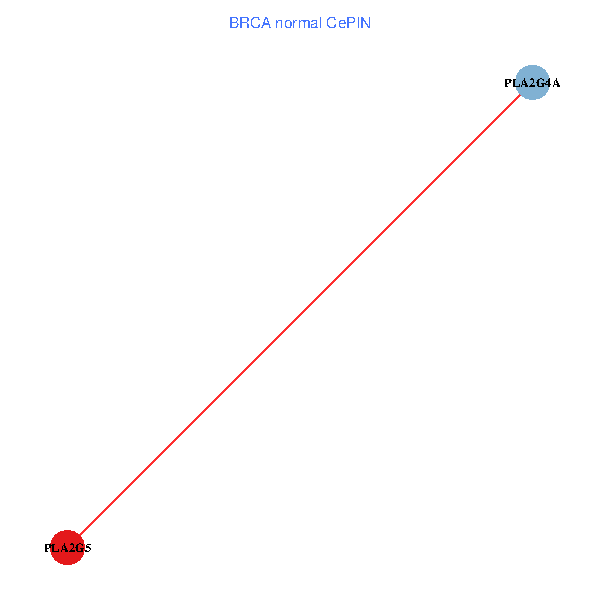
| TissGeneNet for PLA2G5 |
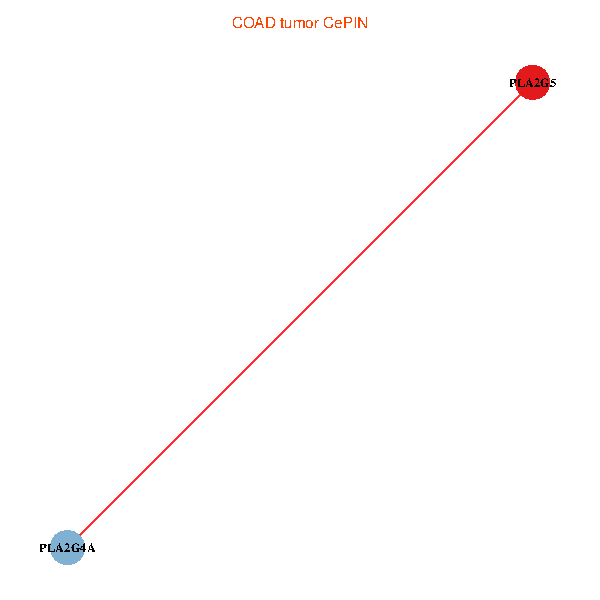
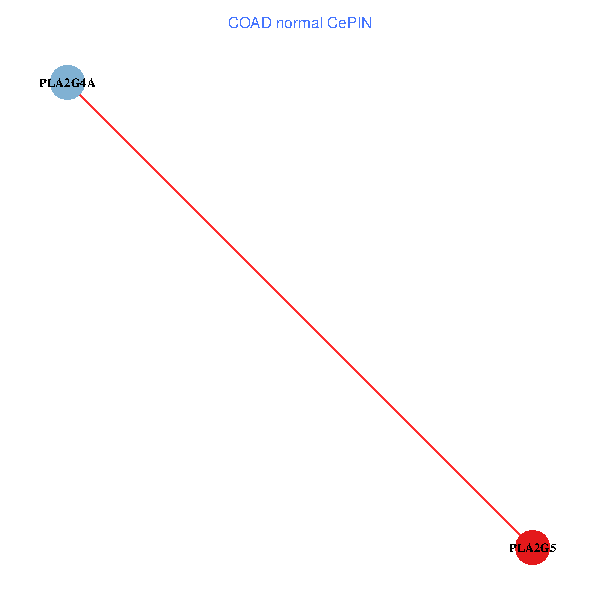
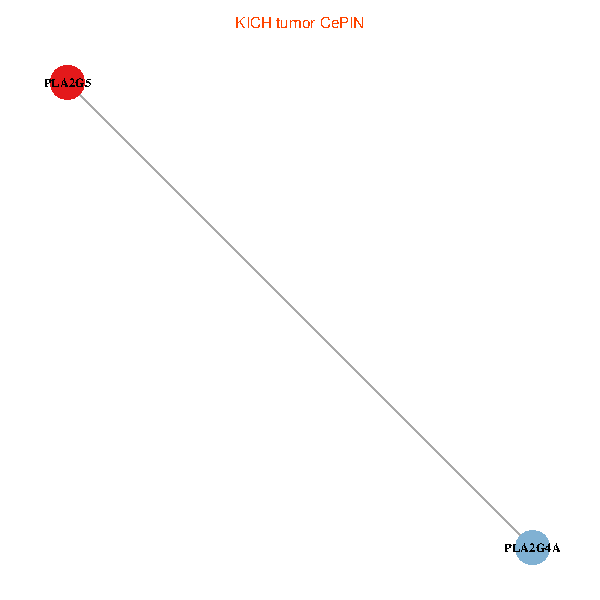
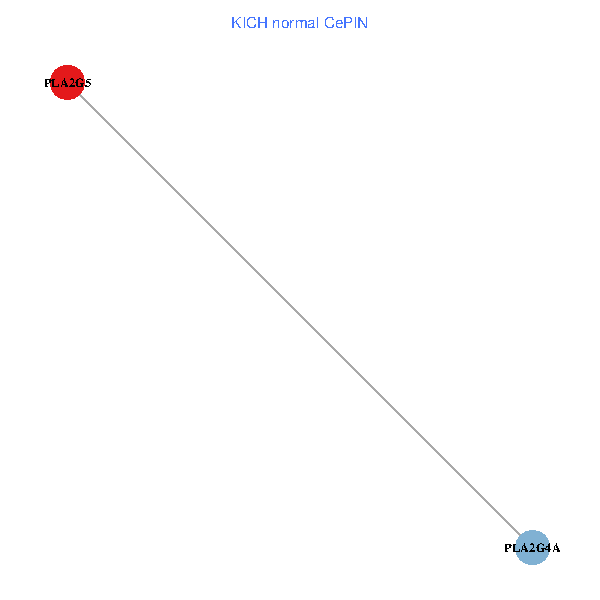
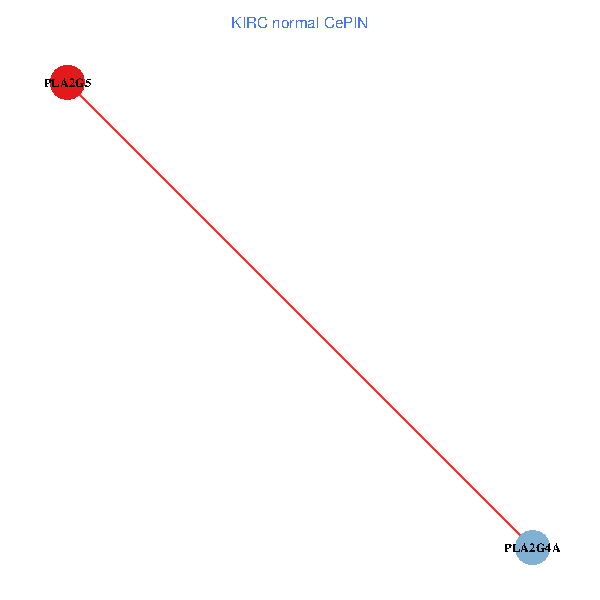
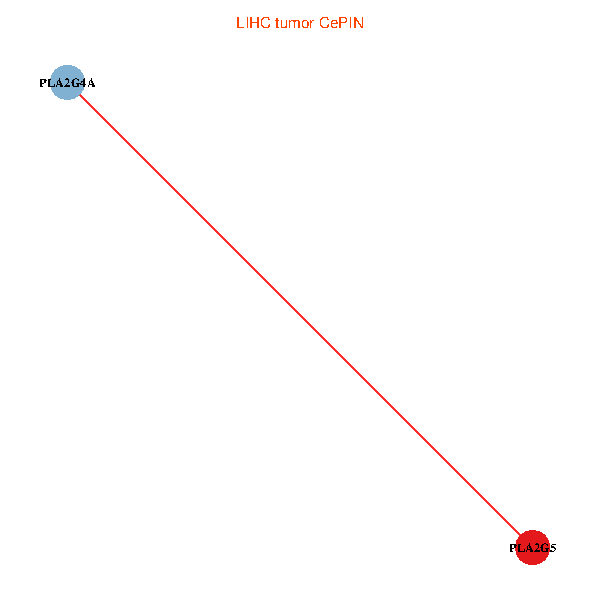
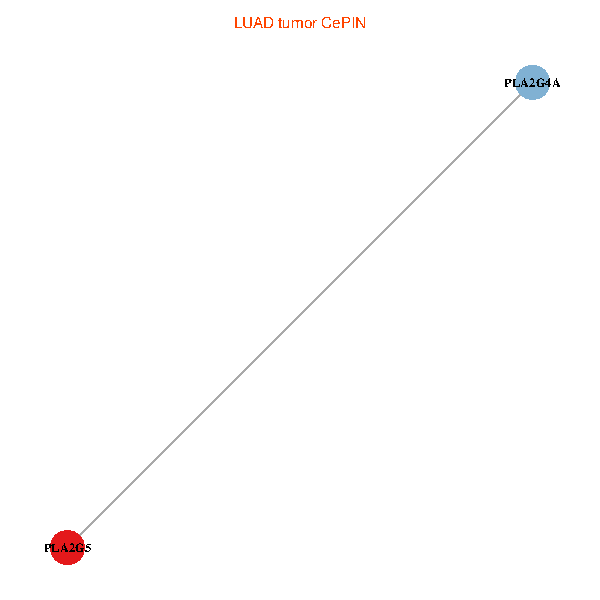
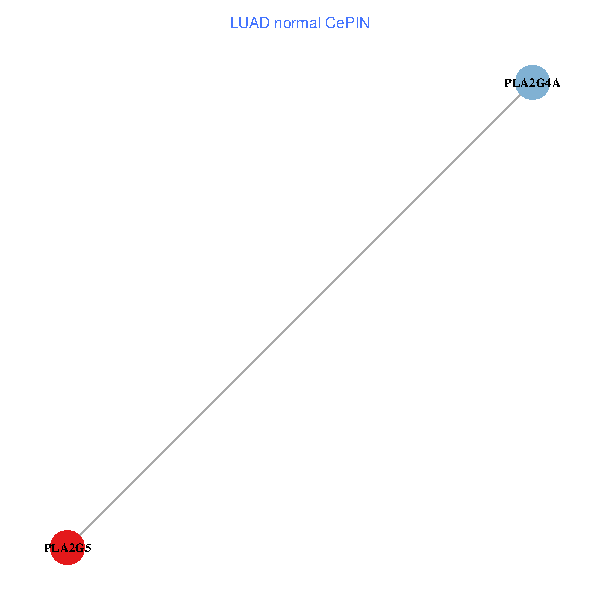
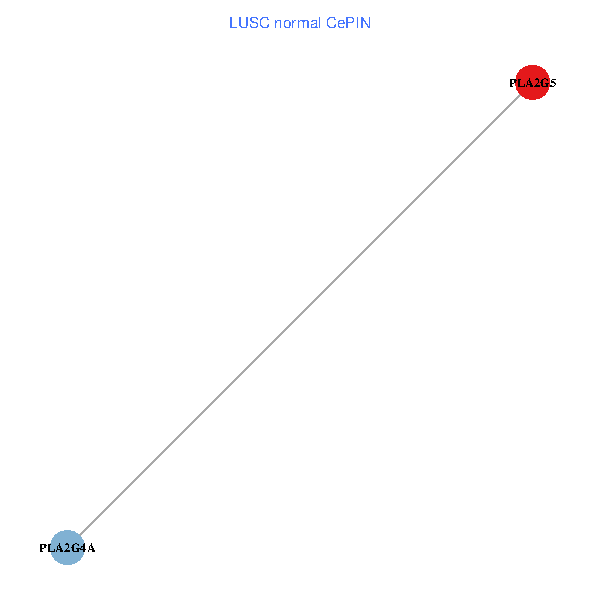
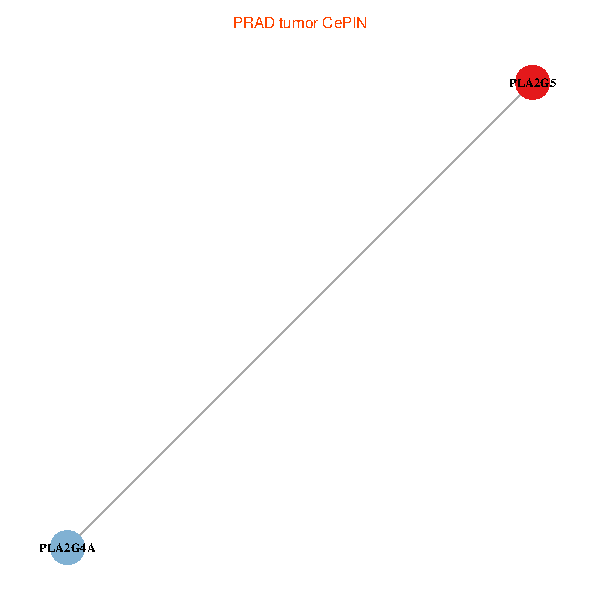
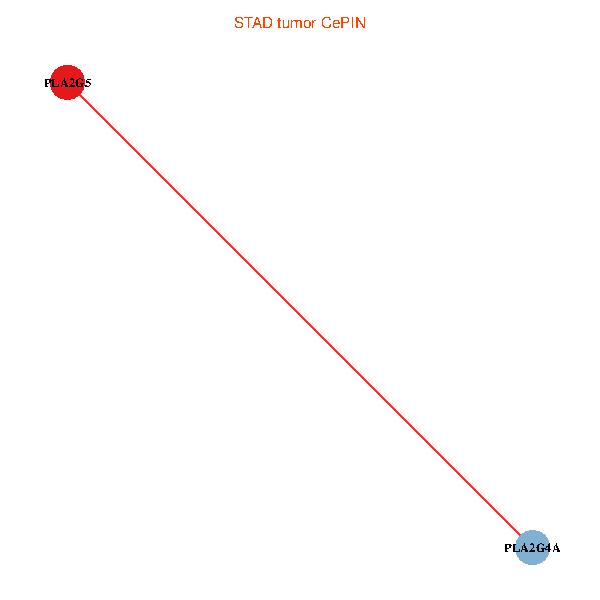
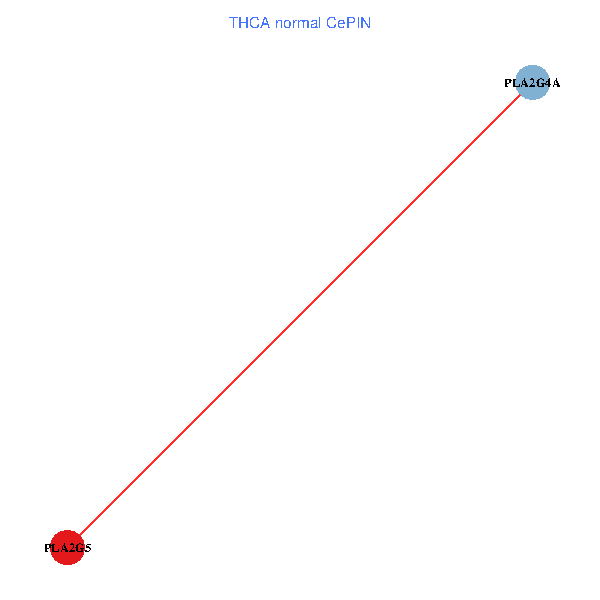
| Co-expressed gene networks based on protein-protein interaction data (CePIN) (TCGA IlluminaHiSeq_RNASeqV2, pan-cancer normalized log2(norm_counts+1) data, version 2016-08-16) (PINA2 ppi data) |
| BRCA (tumor) | BRCA (normal) |
| PLA2G5, PLA2G4A (tumor) | PLA2G5, PLA2G4A (normal) |
 |  |
| COAD (tumor) | COAD (normal) |
| PLA2G5, PLA2G4A (tumor) | PLA2G5, PLA2G4A (normal) |
 |  |
| HNSC (tumor) | HNSC (normal) |
| PLA2G5, PLA2G4A (tumor) | PLA2G5, PLA2G4A (normal) |
 |  |
| KICH (tumor) | KICH (normal) |
| PLA2G5, PLA2G4A (tumor) | PLA2G5, PLA2G4A (normal) |
 |  |
| KIRC (tumor) | KIRC (normal) |
| PLA2G5, PLA2G4A (tumor) | PLA2G5, PLA2G4A (normal) |
 |  |
| KIRP (tumor) | KIRP (normal) |
| PLA2G5, PLA2G4A (tumor) | PLA2G5, PLA2G4A (normal) |
 |  |
| LIHC (tumor) | LIHC (normal) |
| PLA2G5, PLA2G4A (tumor) | PLA2G5, PLA2G4A (normal) |
 |  |
| LUAD (tumor) | LUAD (normal) |
| PLA2G5, PLA2G4A (tumor) | PLA2G5, PLA2G4A (normal) |
 |  |
| LUSC (tumor) | LUSC (normal) |
| PLA2G5, PLA2G4A (tumor) | PLA2G5, PLA2G4A (normal) |
 |  |
| PRAD (tumor) | PRAD (normal) |
| PLA2G5, PLA2G4A (tumor) | PLA2G5, PLA2G4A (normal) |
 |  |
| STAD (tumor) | STAD (normal) |
| PLA2G5, PLA2G4A (tumor) | PLA2G5, PLA2G4A (normal) |
 |  |
| THCA (tumor) | THCA (normal) |
| PLA2G5, PLA2G4A (tumor) | PLA2G5, PLA2G4A (normal) |
 |  |
| Top |
| TissGeneProg for PLA2G5 |
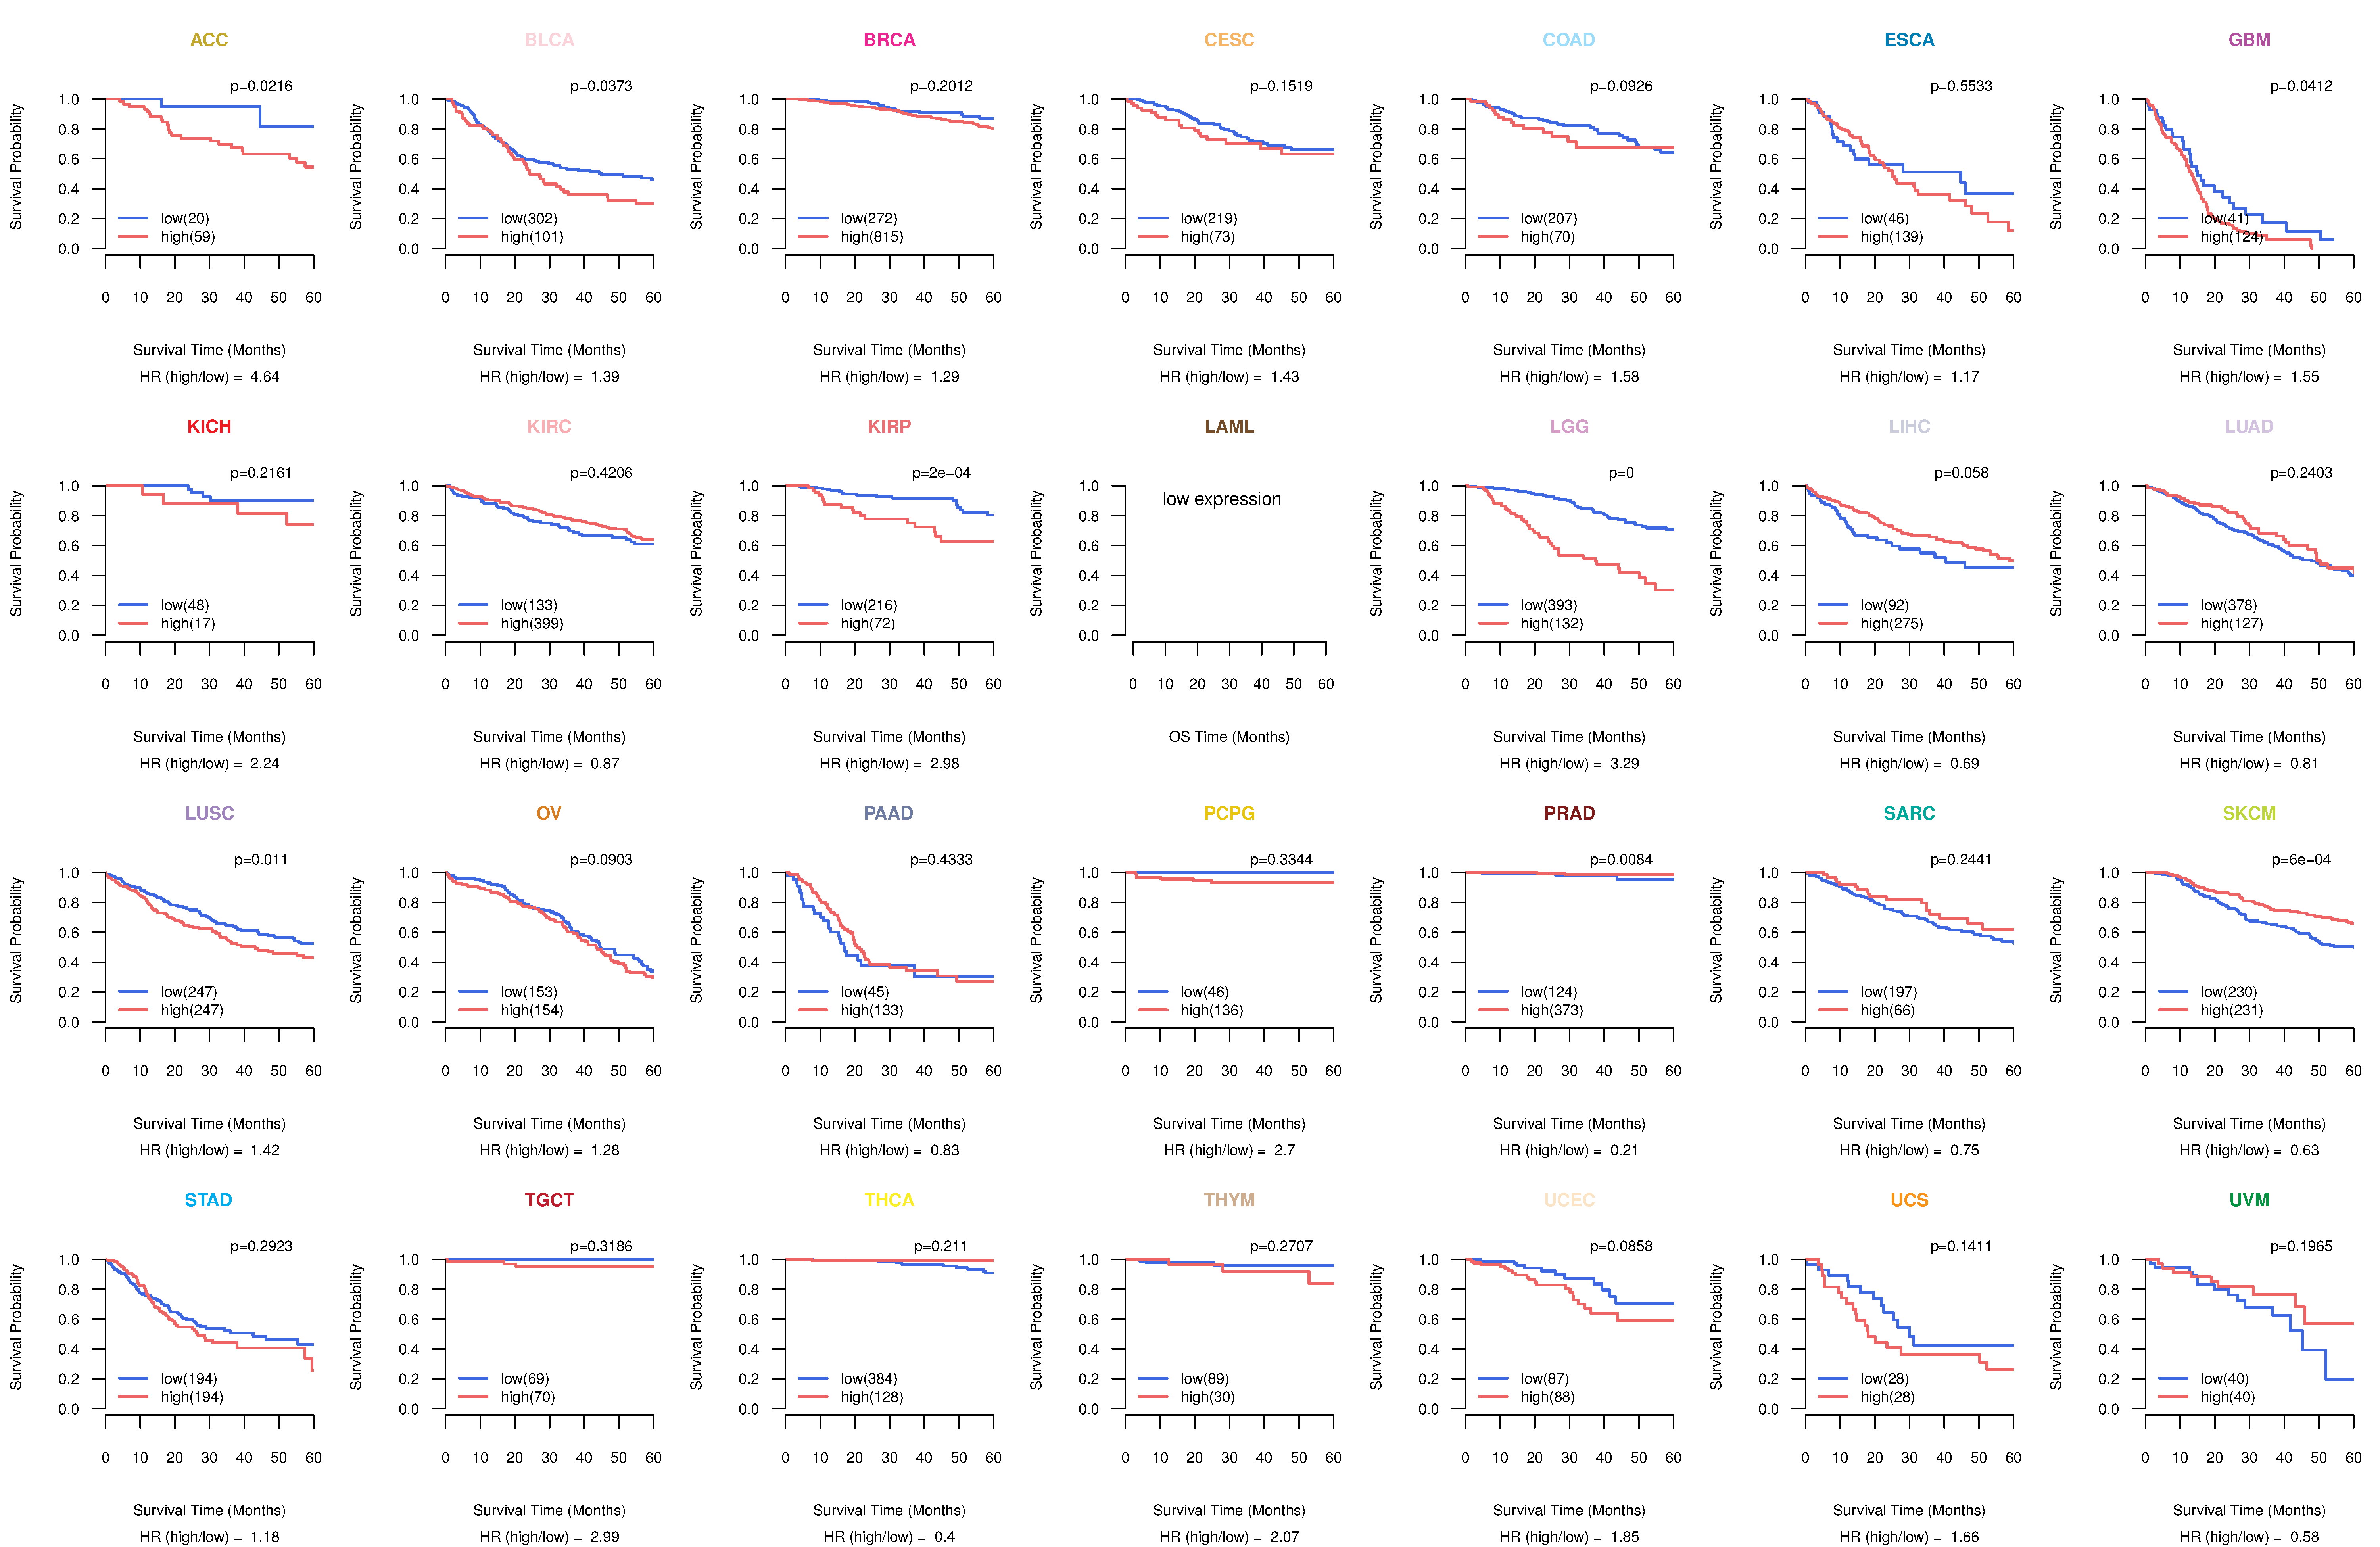
| Kaplan-Meier plots with logrank tests of overall survival (OS) using 28 cancer types (TCGA IlluminaHiSeq_RNASeqV2, pan-cancer normalized log2(norm_counts+1) data, version 2016-08-16) (TCGA clinicalMatrix, phenotype data, version 2016-04-27) * Click on the image to enlarge it in a new window. |
 |
| Kaplan-Meier plots with logrank test of relapse free survival (RFS) using 28 cancer types (TCGA IlluminaHiSeq_RNASeqV2, pan-cancer normalized log2(norm_counts+1) data, version 2016-08-16) (TCGA clinicalMatrix, phenotype data, version 2016-04-27) * Click on the image enlarge it in a new window. |
 |
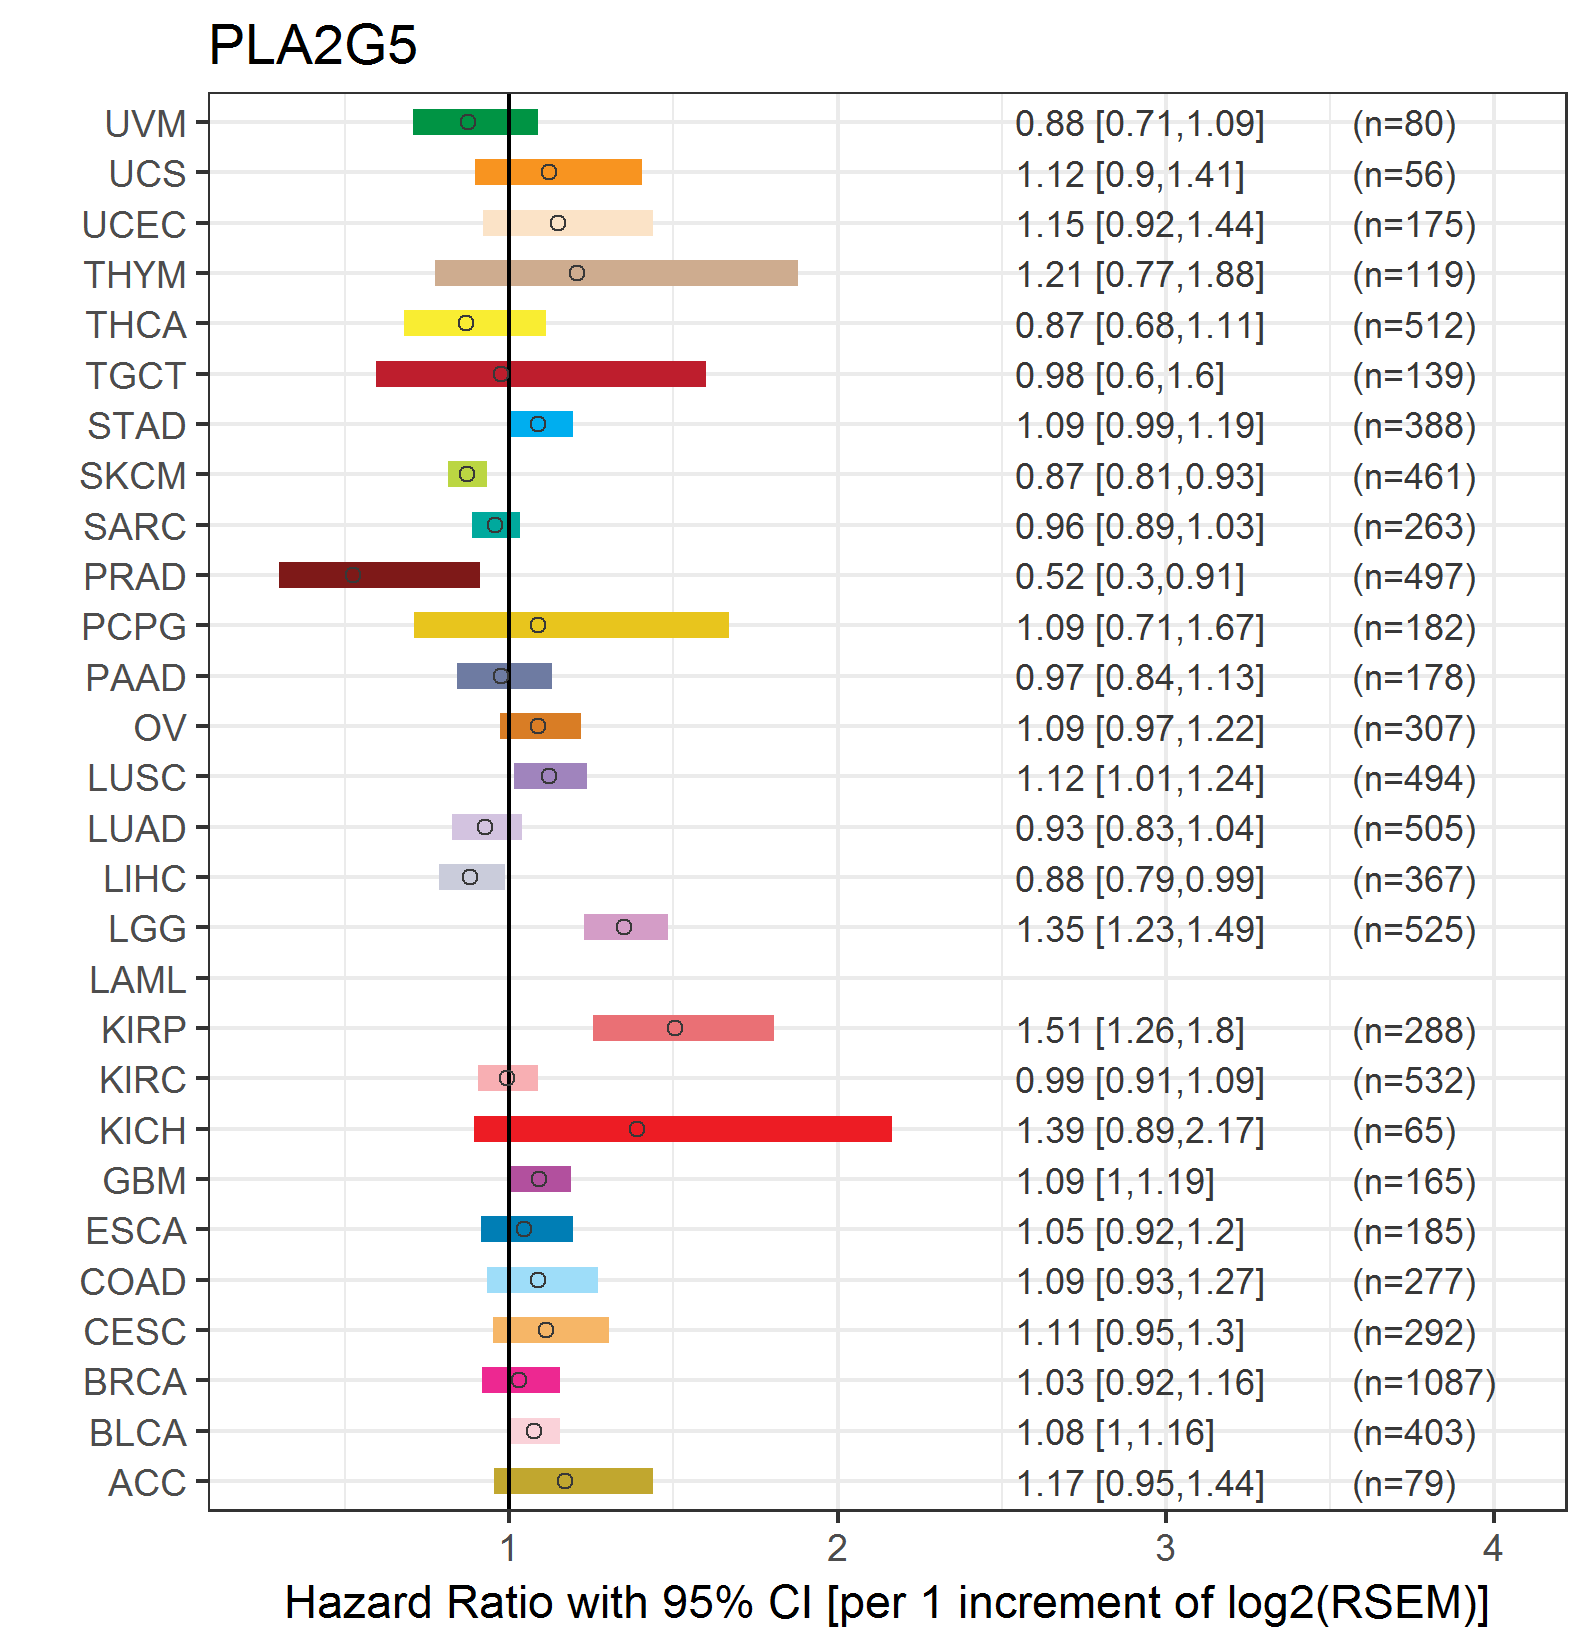
| Forest plot of Cox proportional hazard ratio (HR) and 95% CI of overall survival (OS) using 28 cancer types (TCGA IlluminaHiSeq_RNASeqV2, pan-cancer normalized log2(norm_counts+1) data, version 2016-08-16) (TCGA clinicalMatrix, phenotype data, version 2016-04-27) * Click on the image enlarge it in a new window. |
 |
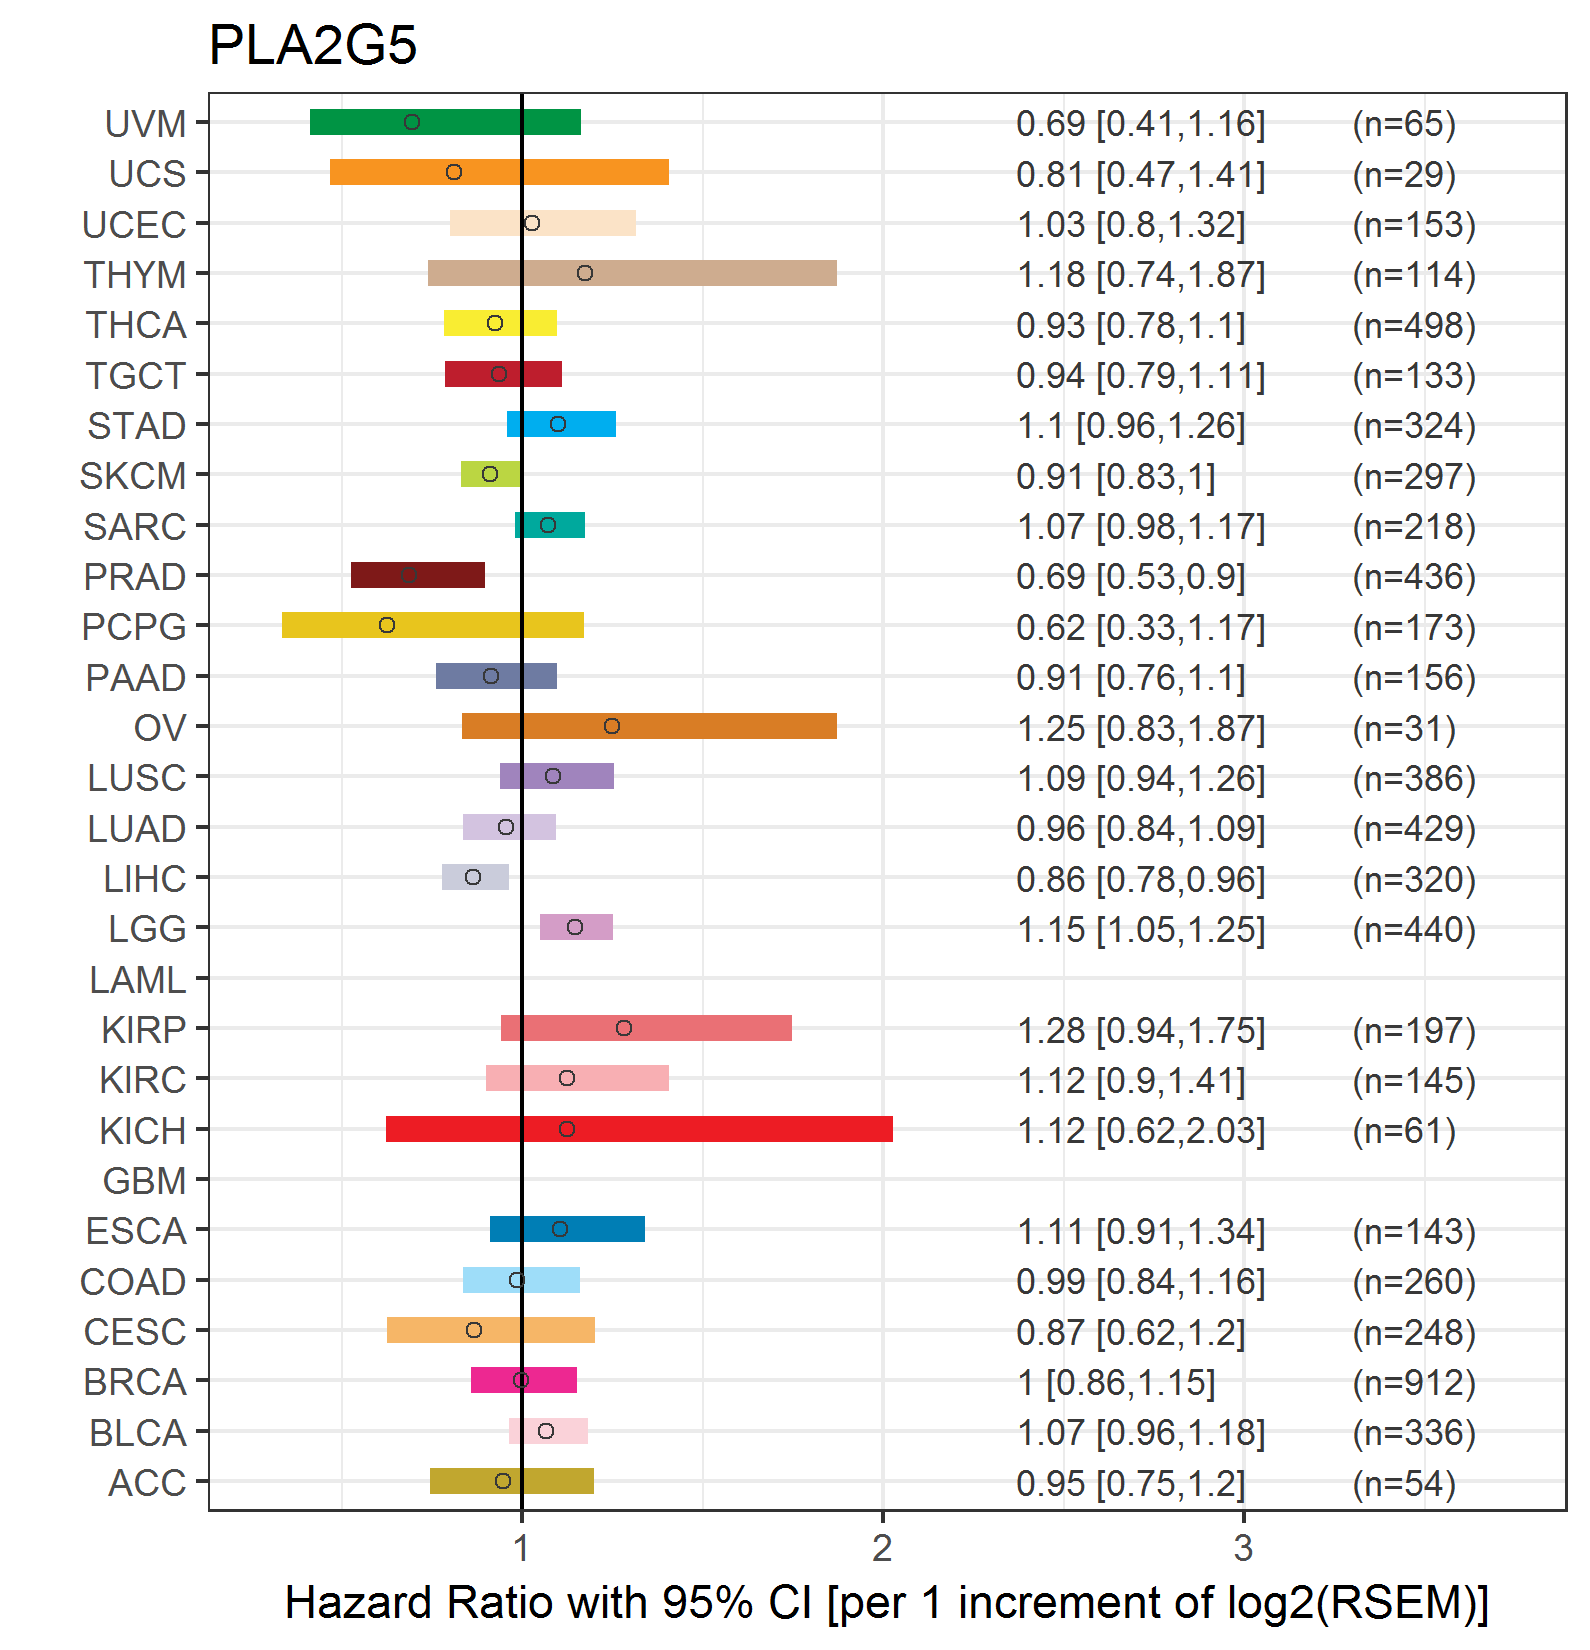
| Forest plot of Cox proportional hazard ratio (HR) and 95% CI of relapse free survival (RFS) using 28 cancer types (TCGA IlluminaHiSeq_RNASeqV2, pan-cancer normalized log2(norm_counts+1) data, version 2016-08-16) (TCGA clinicalMatrix, phenotype data, version 2016-04-27) * Click on the image enlarge it in a new window. |
 |
| Top |
| TissGeneClin for PLA2G5 |
| TissGeneDrug for PLA2G5 |
| Drug information targeting TissGene (DrugBank Version 5.0.6, 2017-04-01) |
| DrugBank ID | Drug name | Drug activity | Drug type | Drug status |
| Top |
| TissGeneDisease for PLA2G5 |
| Disease information associated with TissGene (DisGeNet, 2016-06-01) |
| Disease ID | Disease name | # pubmeds | Source |
| umls:C0010054 | Coronary Arteriosclerosis | 2 | BeFree |
| umls:C0010068 | Coronary heart disease | 2 | BeFree |
| umls:C3714514 | Infection | 2 | LHGDN |
| umls:C0016059 | Fibrosis | 1 | LHGDN |
| umls:C0023895 | Liver diseases | 1 | LHGDN |
| umls:C0028754 | Obesity | 1 | BeFree |
| umls:C0524851 | Neurodegenerative Disorders | 1 | BeFree |
| umls:C0850572 | Adenomatous polyp of colon | 1 | BeFree |
| umls:C1856718 | Fleck Retina, Familial Benign | 1 | CLINVAR,ORPHANET,UNIPROT |
|
Copyright 2016-Present - The University of Texas Health Science Center at Houston (UTHealth) Web File Viewing | How to Report, Fraud, Waste and Abuse | State of Texas | Statewide Search | Texas Homeland Security | Site Policies |