 |
| |
| |
| |
| |
| |
| |
|

| TissGeneSummary for LRRC36 |
 Gene summary Gene summary |
| Basic gene information | Gene symbol | LRRC36 |
| Gene name | leucine rich repeat containing 36 | |
| Synonyms | RORBP70|XLHSRF2 | |
| Cytomap | UCSC genome browser: 16q22.1 | |
| Type of gene | protein-coding | |
| RefGenes | NM_001161575.1, NM_018296.5, | |
| Description | ROR gamma binding protein 70ROR gamma-binding protein 70heat shock regulated 2leucine-rich repeat-containing protein 36 | |
| Modification date | 20141207 | |
| dbXrefs | HGNC : HGNC | |
| Ensembl : ENSG00000159708 | ||
| HPRD : 08558 | ||
| Vega : OTTHUMG00000173030 | ||
| Protein | UniProt: go to UniProt's Cross Reference DB Table | |
| Expression | CleanEX: HS_LRRC36 | |
| BioGPS: 55282 | ||
| Pathway | NCI Pathway Interaction Database: LRRC36 | |
| KEGG: LRRC36 | ||
| REACTOME: LRRC36 | ||
| Pathway Commons: LRRC36 | ||
| Context | iHOP: LRRC36 | |
| ligand binding site mutation search in PubMed: LRRC36 | ||
| UCL Cancer Institute: LRRC36 | ||
| Assigned class in TissGDB* | B | |
| Included tissue-specific gene expression resources | HPA,TiGER,GTEx | |
| Specific-tissues in normal samples (assigned by TissGDB using HPA, TiGER, and GTEx) | Testis | |
| Cancer types related to the specific-tissues in cancer samples (assigned by TissGDB using TCGA) | TGCT | |
| Reference showing the relevant tissue of LRRC36 | ||
| Description by TissGene annotations | ||
| * Class A consists of genes with literature evidence and is part of the cTissGenes. Class B consists of only cTissGenes without additional evidence. The remaining genes belong to Class C. |
| Gene ontology having evidence of Inferred from Direct Assay (IDA) from Entrez |
| GO ID | GO term | PubMed ID |
| Top |
| TissGeneExp for LRRC36 |
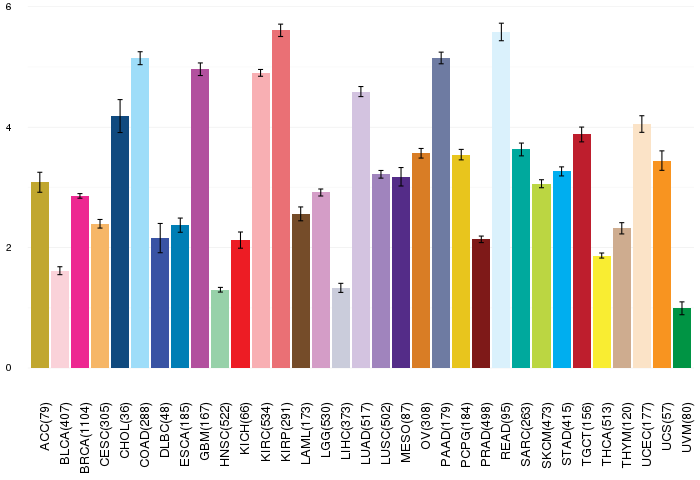
| Gene expressions across 28 cancer types (X-axis: cancer type and Y-axis: log2(norm_counts+1)) (TCGA IlluminaHiSeq_RNASeqV2, pan-cancer normalized log2(norm_counts+1) data, version 2016-08-16) |
 |
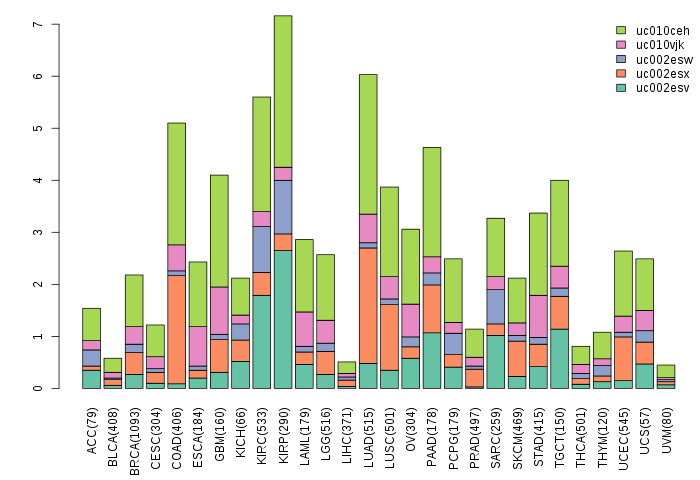
| Gene isoform expressions across 28 cancer types (X-axis: cancer type and Y-axis: log2(norm_counts+1)) (TCGA pan-cancer tcga_rsem_isoform_tpm, version 2016-09-01) |
 |
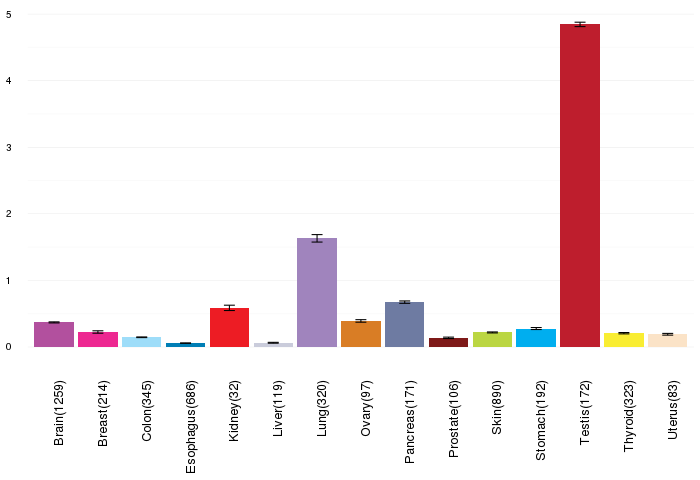
| Gene expressions across normal tissues of GTEx data (GTEx GTEx_Analysis_v6_RNA-seq_RNA-SeQCv1.1.8_gene_rpkm.gct) - Here, we shows the matched tissue types only among our 28 cancer types. |
 |
| Different expressions across 14 cancer types with more than 10 samples between matched tumors and normals (X-axis: cancer type and Y-axis: log2(norm_counts+1)) (TCGA IlluminaHiSeq_RNASeqV2, pan-cancer normalized log2(norm_counts+1) data, version 2016-08-16) |
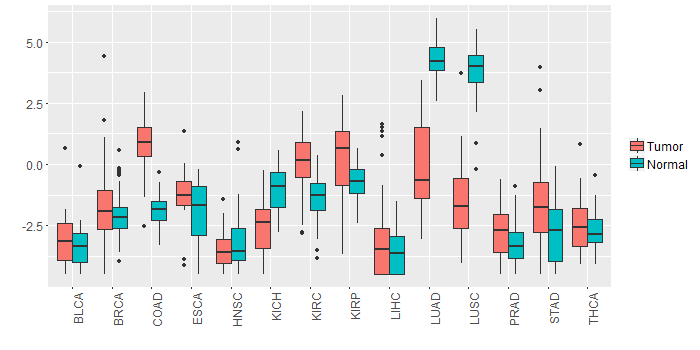 |
| - Significantly differentially expressed cancer types and information. (|Fold change|>1 and FDR<0.05) |
| Cancer type | Mean(exp) in tumor | Mean(exp) in matched normal | Log2FC | P-val. | FDR |
| KIRC | 0.072879977 | -1.385514468 | 1.458394444 | 2.14E-13 | 9.59E-13 |
| LUAD | -0.113645885 | 4.255078252 | -4.368724138 | 7.48E-29 | 6.21E-27 |
| LUSC | -1.541374925 | 3.742881937 | -5.284256863 | 1.01E-36 | 2.07E-34 |
| COAD | 0.810245361 | -1.86442387 | 2.674669231 | 9.25E-12 | 1.84E-10 |
| STAD | -1.411407523 | -2.768151273 | 1.35674375 | 0.00125 | 0.006303251 |
| KICH | -2.403328023 | -0.998028023 | -1.4053 | 3.51E-05 | 0.000100078 |
| Top |
| TissGene-miRNA for LRRC36 |
| Significantly anti-correlated miRNAs of TissGene across 28 cancer types (Gene-miRNA relations from TargetScanHuman Relsease 7.1, Conserved_Site_Context_Scores.txt.zip, 06.01.2016) (TCGA IlluminaHiSeq_miRNASeq, log2(RPM+1) data, version 2016-11-21) (TCGA IlluminaHiSeq_RNASeqV2, log2(normalized_count+1) data, version 2016-08-16) (Spearman’s Rank Correlation (p-value<0.05 and coefficient<-0.25)) |
| Cancer type | miRNA id | miRNA accession | P-val. | Coeff. | # samples |
| Top |
| TissGeneMut for LRRC36 |
| TissGeneSNV for LRRC36 |
| nsSNV counts per each loci. Different colors of circles represent different cancer types. Circle size denotes number of samples. (TCGA somatic mutation (SNPs and small INDELs) data, version 2016-04-25) * Click on the image to enlarge it in a new window. |
 |
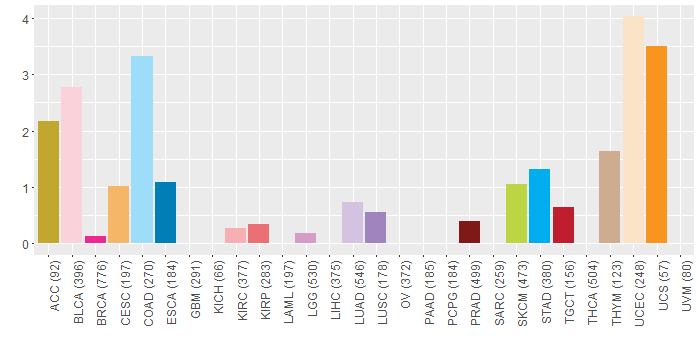
| Somatic nucleotide variants of TissGene across 28 cancer types (X-axis: cancer type and Y-axis: % of mutated samples) The numbers in parentheses are numbers of samples with mutation (nsSNVs). (TCGA somatic mutation (SNPs and small INDELs) data, version 2016-04-25) |
 |
| - nsSNVs sorted by frequency. |
| AAchange | Cancer type | # samples |
| p.S306* | UCEC | 1 |
| p.S471L | UCEC | 1 |
| p.H678Q | TGCT | 1 |
| p.P710H | STAD | 1 |
| p.V276A | BLCA | 1 |
| p.S389C | THYM | 1 |
| p.L104F | BLCA | 1 |
| p.S497T | BLCA | 1 |
| p.R448W | STAD | 1 |
| p.F406Y | UCS | 1 |
| p.E10* | CESC | 1 |
| p.M655L | COAD | 1 |
| p.G441V | BLCA | 1 |
| p.S261P | UCS | 1 |
| p.E237K | SKCM | 1 |
| p.E711K | HNSC | 1 |
| p.A494D | UCEC | 1 |
| p.S317G | COAD | 1 |
| p.R264* | BLCA | 1 |
| p.L52I | UCEC | 1 |
| p.N332I | COAD | 1 |
| p.H301Y | SKCM | 1 |
| p.H374R | BLCA | 1 |
| p.A372T | LUAD | 1 |
| p.P95L | ACC | 1 |
| p.S188I | UCEC | 1 |
| p.S728Y | UCEC | 1 |
| p.R59S | UCEC | 1 |
| p.Q570* | CESC | 1 |
| p.L589I | LUAD | 1 |
| p.Y690* | SKCM | 1 |
| p.K606E | KIRC | 1 |
| p.S30L | READ | 1 |
| p.D115N | BLCA | 1 |
| p.G67E | SKCM | 1 |
| p.P517H | HNSC | 1 |
| p.C573Y | STAD | 1 |
| p.G197R | HNSC | 1 |
| p.H489N | COAD | 1 |
| p.E27Q | BLCA | 1 |
| p.M269I | HNSC | 1 |
| p.E154D | UCEC | 1 |
| p.E159V | BRCA | 1 |
| p.P266S | ACC | 1 |
| p.V276A | UCEC | 1 |
| p.V412A | HNSC | 1 |
| p.S50* | STAD | 1 |
| p.K309T | COAD | 1 |
| p.S265F | COAD | 1 |
| p.I190T | PRAD | 1 |
| p.E417Q | BLCA | 1 |
| p.G43V | ESCA | 1 |
| p.R473T | HNSC | 1 |
| p.V745I | UCEC | 1 |
| p.N356Y | UCEC | 1 |
| p.K295N | UCEC | 1 |
| p.A734T | THYM | 1 |
| p.M192V | KIRP | 1 |
| p.S545C | LUSC | 1 |
| p.F147I | SKCM | 1 |
| p.S382F | COAD | 1 |
| p.R350K | LGG | 1 |
| p.G138D | HNSC | 1 |
| p.L292F | LUAD | 1 |
| p.S178C | BLCA | 1 |
| p.I623N | STAD | 1 |
| p.Q234R | COAD | 1 |
| p.A411V | ESCA | 1 |
| p.W477S | PRAD | 1 |
| p.S306L | BLCA | 1 |
| p.F49L | LUAD | 1 |
| p.L157I | COAD | 1 |
| Top |
| TissGeneCNV for LRRC36 |
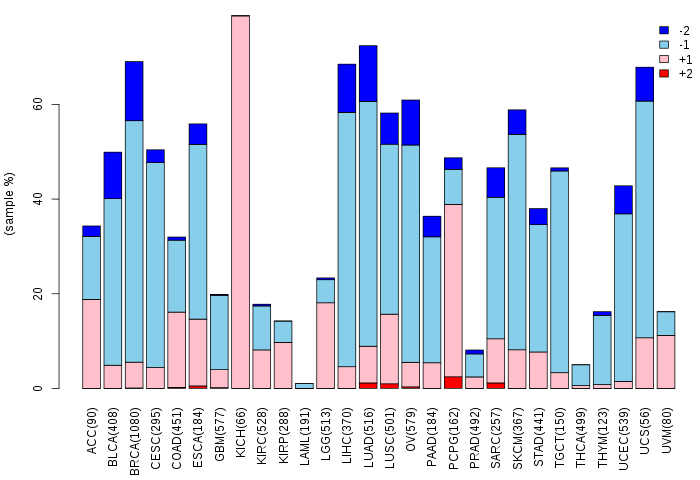
| Copy number variations of TissGene across 28 cancer types (X-axis: cancer type and Y-axis: % of CNV samples) (TCGA Gistic2_CopyNumber_Gistic2_all_data_by_genes, Gistic2 copy number data, version 2016-08-16) |
 |
| Top |
| TissGeneFusions for LRRC36 |
| Fusion genes including TissGene (ChimerDB 3.0, 2016-12-01 and TCGA fusion Portal 2015-12-01) |
| Database | Src | Cancer type | Sample | Fusion gene | ORF | 5'-gene BP | 3'-gene BP |
| TCGAfusionPortal | PRADA | LUAD | TCGA-91-A4BC-01A | FAM65A-LRRC36 | 5UTR-CDS | Chr16:67562817 | Chr16:67375860 |
| Top |
| TissGeneNet for LRRC36 |
| Co-expressed gene networks based on protein-protein interaction data (CePIN) (TCGA IlluminaHiSeq_RNASeqV2, pan-cancer normalized log2(norm_counts+1) data, version 2016-08-16) (PINA2 ppi data) |
| Top |
| TissGeneProg for LRRC36 |
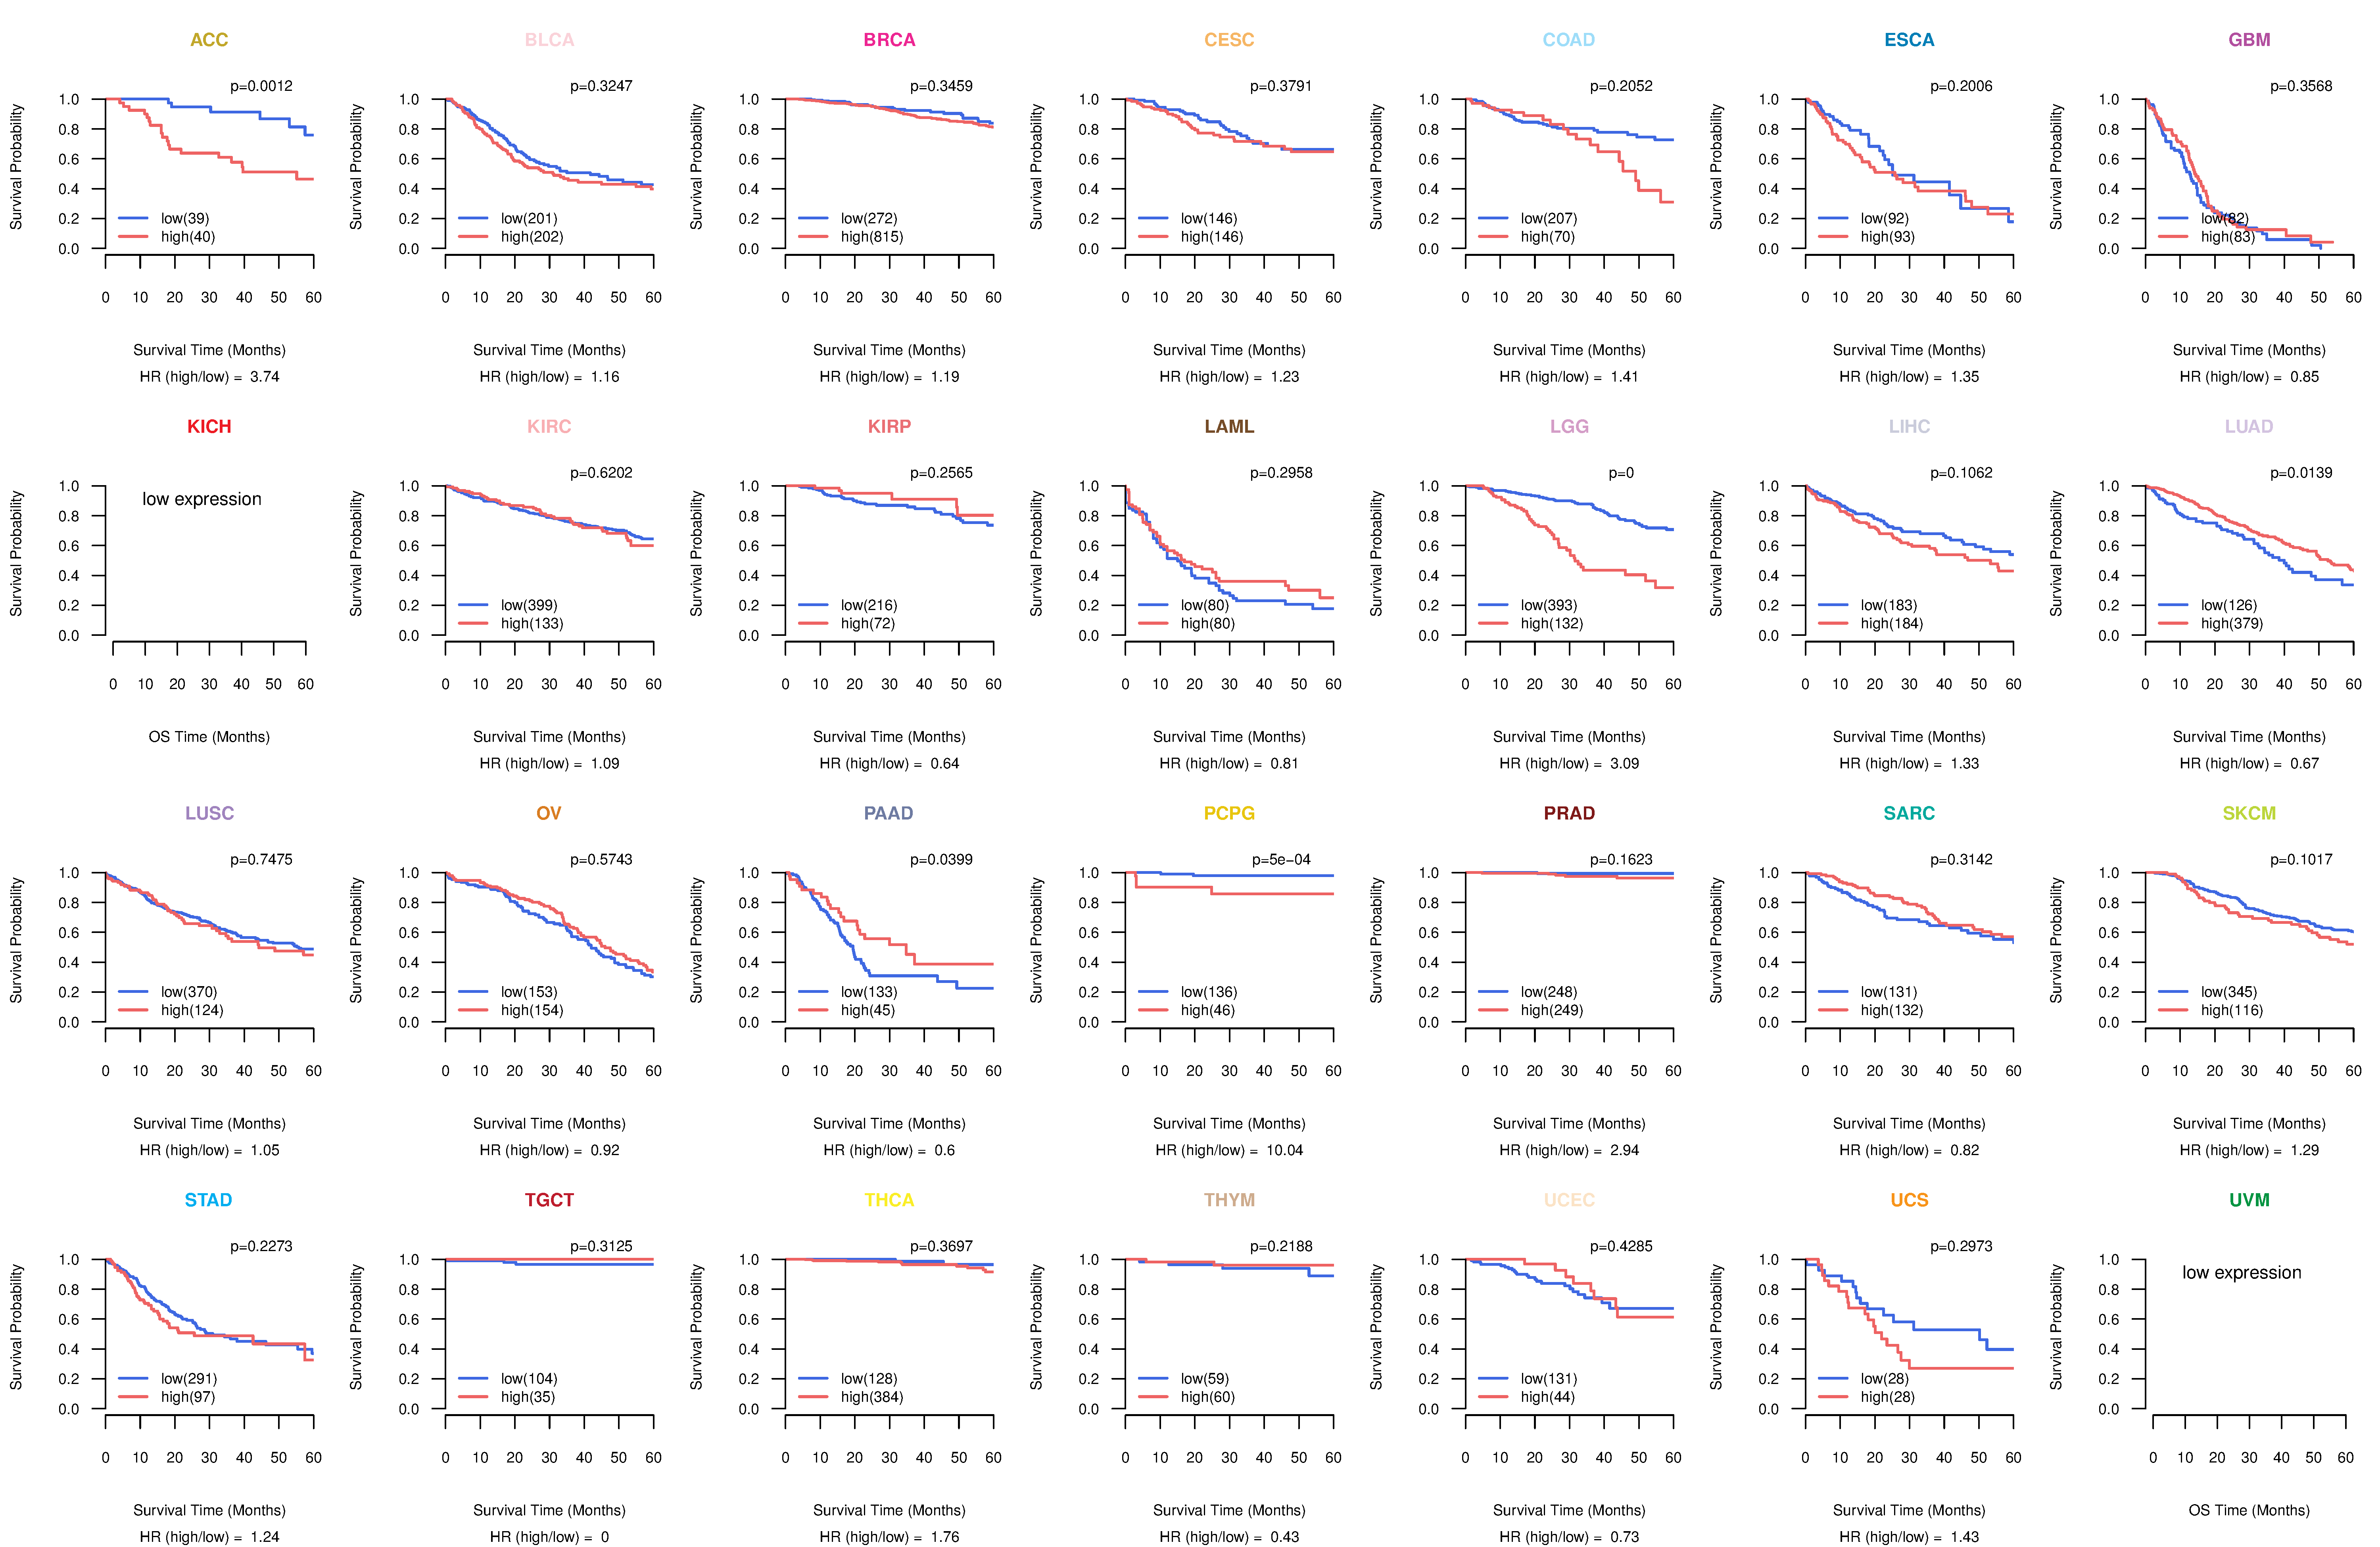
| Kaplan-Meier plots with logrank tests of overall survival (OS) using 28 cancer types (TCGA IlluminaHiSeq_RNASeqV2, pan-cancer normalized log2(norm_counts+1) data, version 2016-08-16) (TCGA clinicalMatrix, phenotype data, version 2016-04-27) * Click on the image to enlarge it in a new window. |
 |
| Kaplan-Meier plots with logrank test of relapse free survival (RFS) using 28 cancer types (TCGA IlluminaHiSeq_RNASeqV2, pan-cancer normalized log2(norm_counts+1) data, version 2016-08-16) (TCGA clinicalMatrix, phenotype data, version 2016-04-27) * Click on the image enlarge it in a new window. |
 |
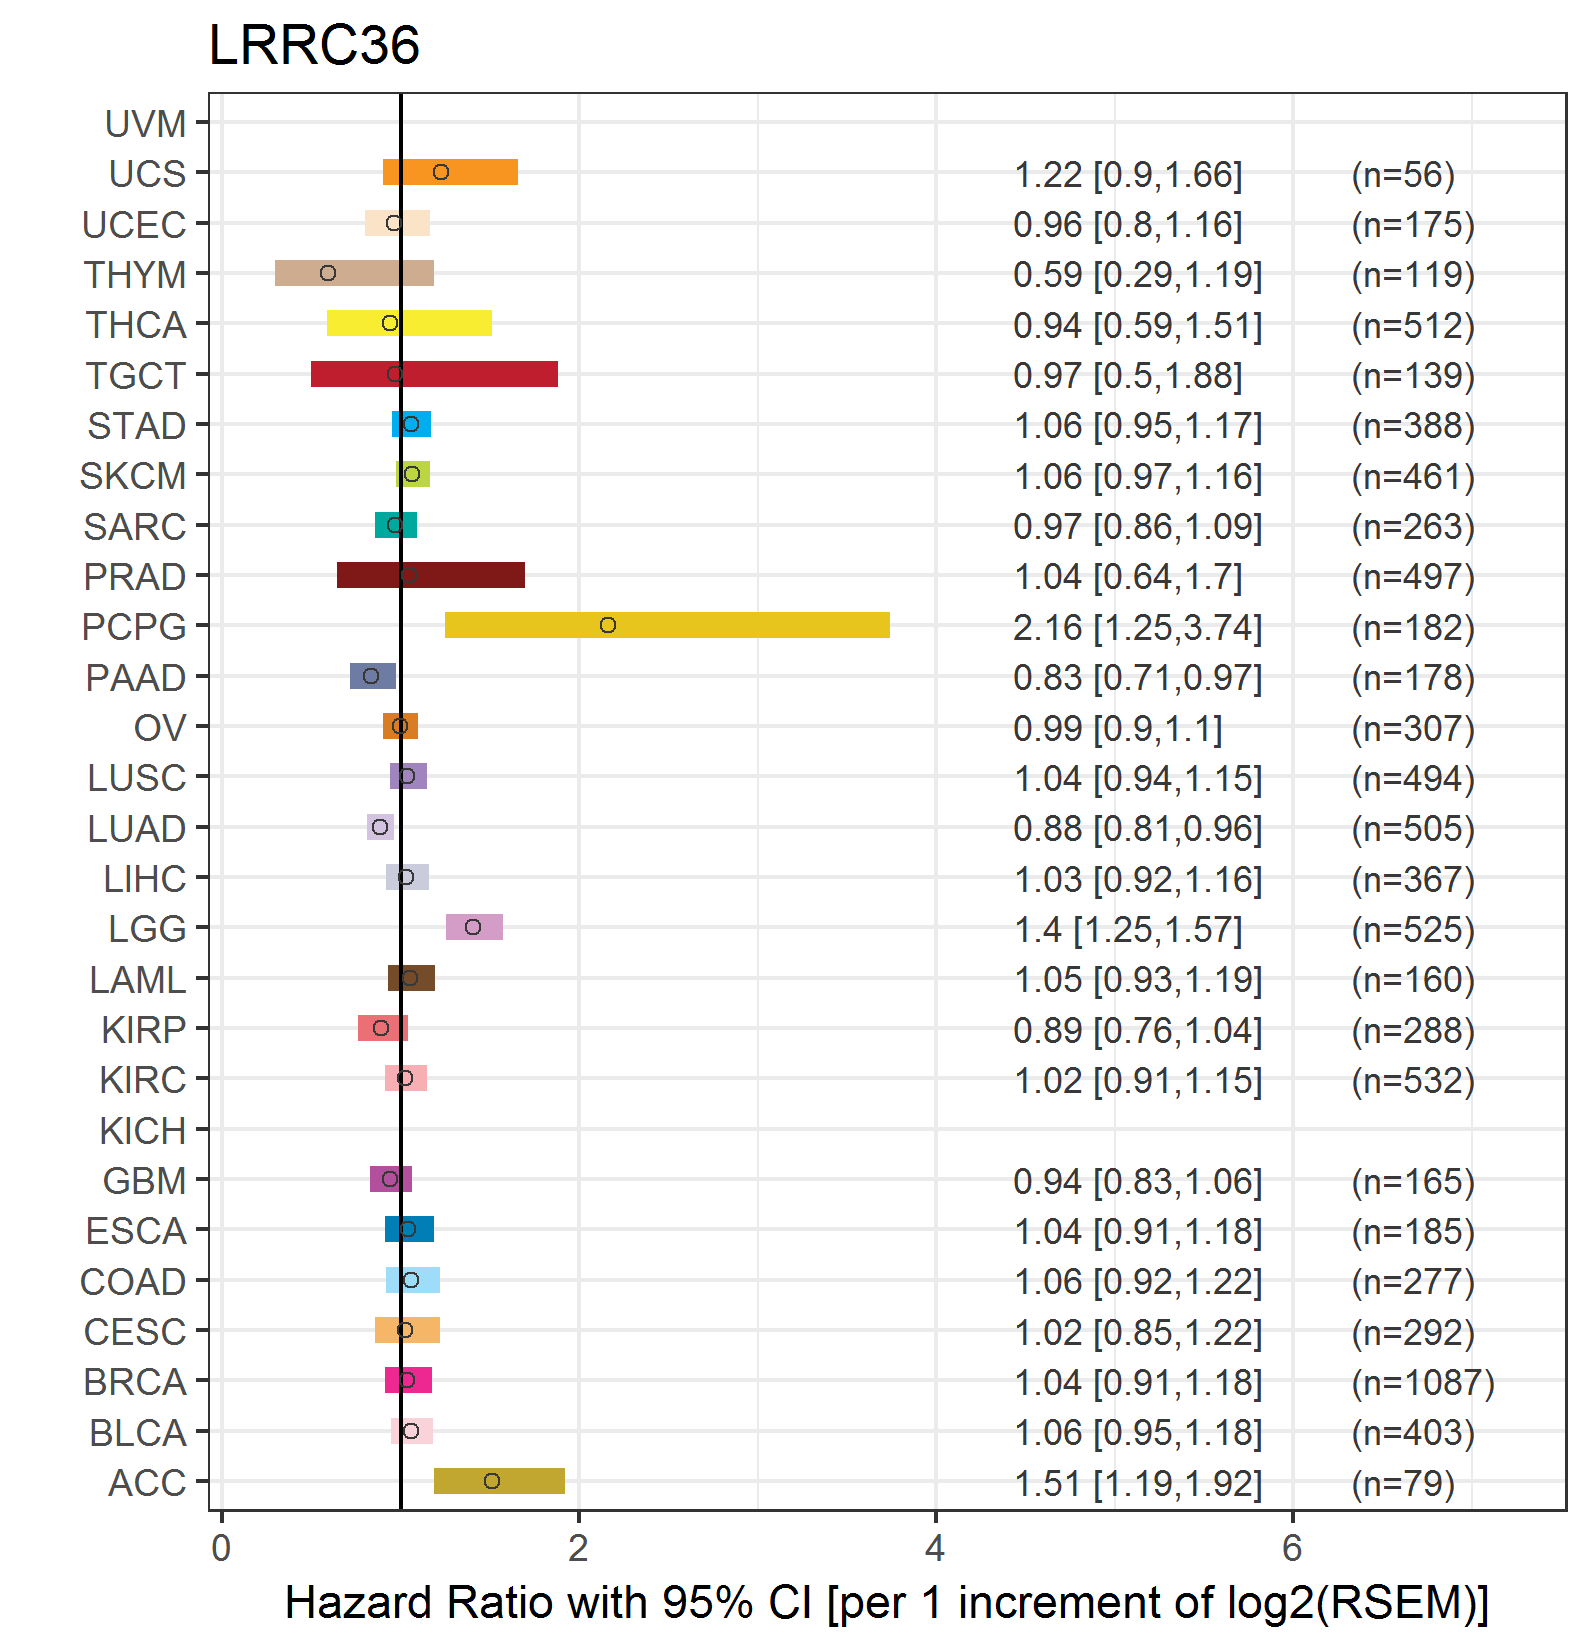
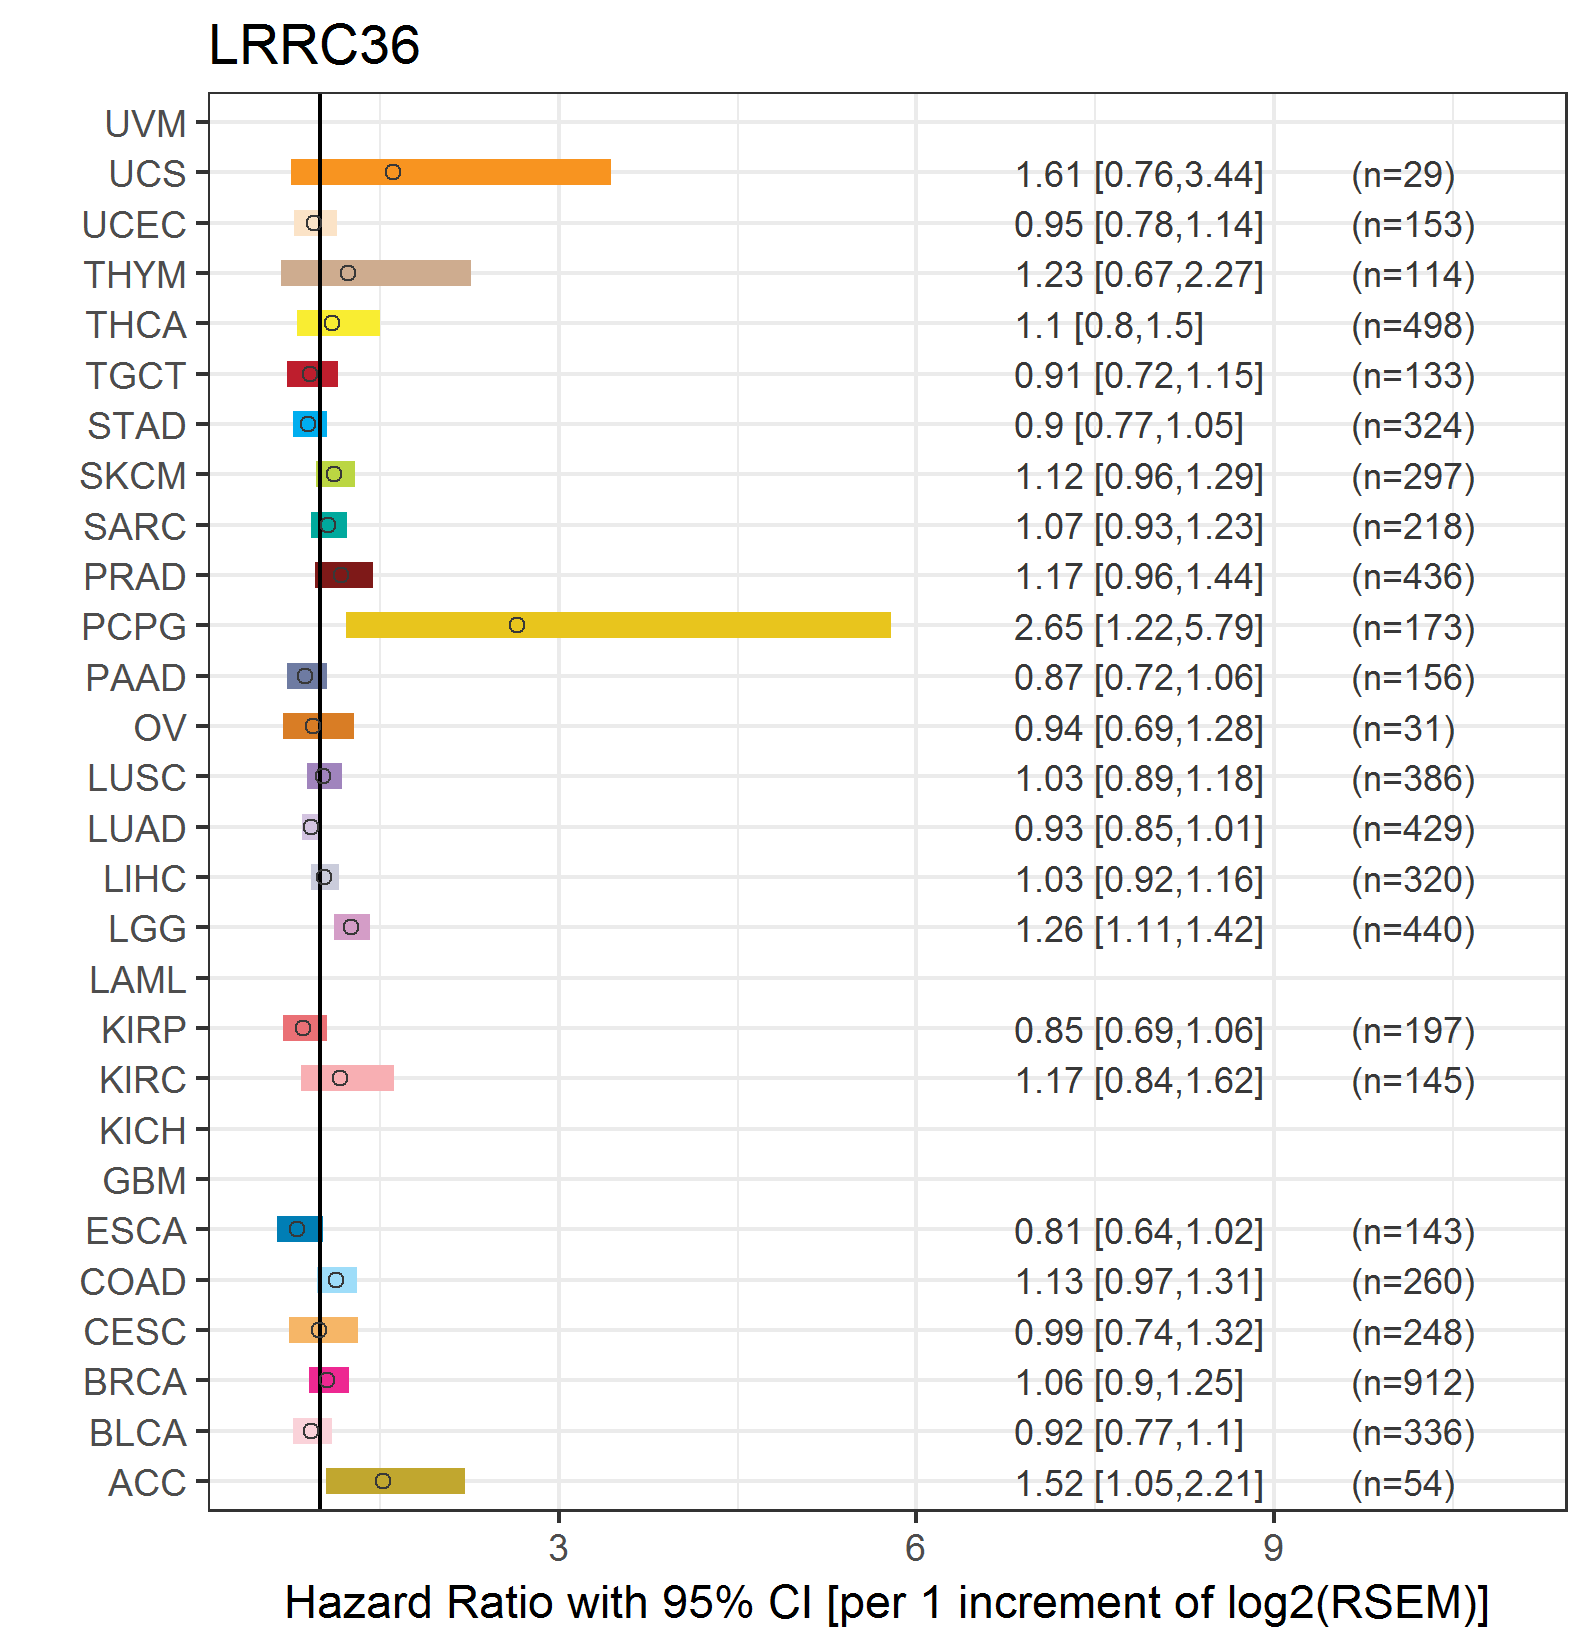
| Forest plot of Cox proportional hazard ratio (HR) and 95% CI of overall survival (OS) using 28 cancer types (TCGA IlluminaHiSeq_RNASeqV2, pan-cancer normalized log2(norm_counts+1) data, version 2016-08-16) (TCGA clinicalMatrix, phenotype data, version 2016-04-27) * Click on the image enlarge it in a new window. |
 |
| Forest plot of Cox proportional hazard ratio (HR) and 95% CI of relapse free survival (RFS) using 28 cancer types (TCGA IlluminaHiSeq_RNASeqV2, pan-cancer normalized log2(norm_counts+1) data, version 2016-08-16) (TCGA clinicalMatrix, phenotype data, version 2016-04-27) * Click on the image enlarge it in a new window. |
 |
| Top |
| TissGeneClin for LRRC36 |
| TissGeneDrug for LRRC36 |
| Drug information targeting TissGene (DrugBank Version 5.0.6, 2017-04-01) |
| DrugBank ID | Drug name | Drug activity | Drug type | Drug status |
| Top |
| TissGeneDisease for LRRC36 |
| Disease information associated with TissGene (DisGeNet, 2016-06-01) |
| Disease ID | Disease name | # pubmeds | Source |
|
Copyright 2016-Present - The University of Texas Health Science Center at Houston (UTHealth) Web File Viewing | How to Report, Fraud, Waste and Abuse | State of Texas | Statewide Search | Texas Homeland Security | Site Policies |