 |
| |
| |
| |
| |
| |
| |
|

| TissGeneSummary for TSNAXIP1 |
 Gene summary Gene summary |
| Basic gene information | Gene symbol | TSNAXIP1 |
| Gene name | translin-associated factor X interacting protein 1 | |
| Synonyms | TXI1 | |
| Cytomap | UCSC genome browser: 16q22.1 | |
| Type of gene | protein-coding | |
| RefGenes | NM_001288990.1, NM_001288991.1,NM_001288992.1,NM_001288993.1,NM_001288994.1, NM_018430.3, | |
| Description | translin-associated factor X-interacting protein 1trax-interacting protein 1 | |
| Modification date | 20141207 | |
| dbXrefs | MIM : 607720 | |
| HGNC : HGNC | ||
| Ensembl : ENSG00000102904 | ||
| HPRD : 09656 | ||
| Vega : OTTHUMG00000137545 | ||
| Protein | UniProt: go to UniProt's Cross Reference DB Table | |
| Expression | CleanEX: HS_TSNAXIP1 | |
| BioGPS: 55815 | ||
| Pathway | NCI Pathway Interaction Database: TSNAXIP1 | |
| KEGG: TSNAXIP1 | ||
| REACTOME: TSNAXIP1 | ||
| Pathway Commons: TSNAXIP1 | ||
| Context | iHOP: TSNAXIP1 | |
| ligand binding site mutation search in PubMed: TSNAXIP1 | ||
| UCL Cancer Institute: TSNAXIP1 | ||
| Assigned class in TissGDB* | C | |
| Included tissue-specific gene expression resources | TiGER,GTEx | |
| Specific-tissues in normal samples (assigned by TissGDB using HPA, TiGER, and GTEx) | Testis | |
| Cancer types related to the specific-tissues in cancer samples (assigned by TissGDB using TCGA) | TGCT | |
| Reference showing the relevant tissue of TSNAXIP1 | ||
| Description by TissGene annotations | ||
| * Class A consists of genes with literature evidence and is part of the cTissGenes. Class B consists of only cTissGenes without additional evidence. The remaining genes belong to Class C. |
| Gene ontology having evidence of Inferred from Direct Assay (IDA) from Entrez |
| GO ID | GO term | PubMed ID |
| Top |
| TissGeneExp for TSNAXIP1 |
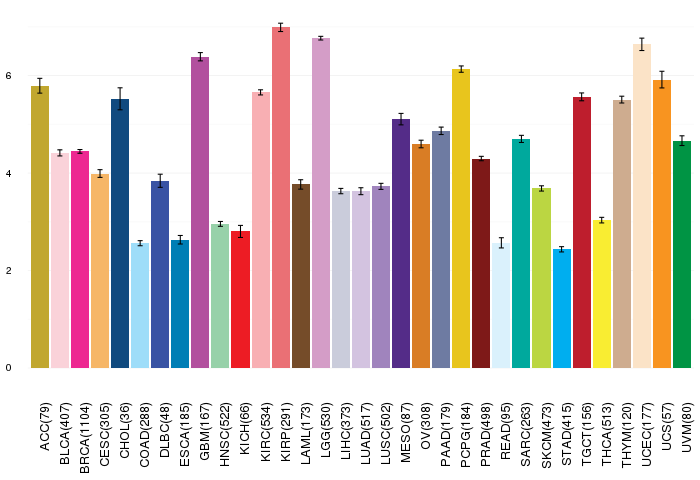
| Gene expressions across 28 cancer types (X-axis: cancer type and Y-axis: log2(norm_counts+1)) (TCGA IlluminaHiSeq_RNASeqV2, pan-cancer normalized log2(norm_counts+1) data, version 2016-08-16) |
 |
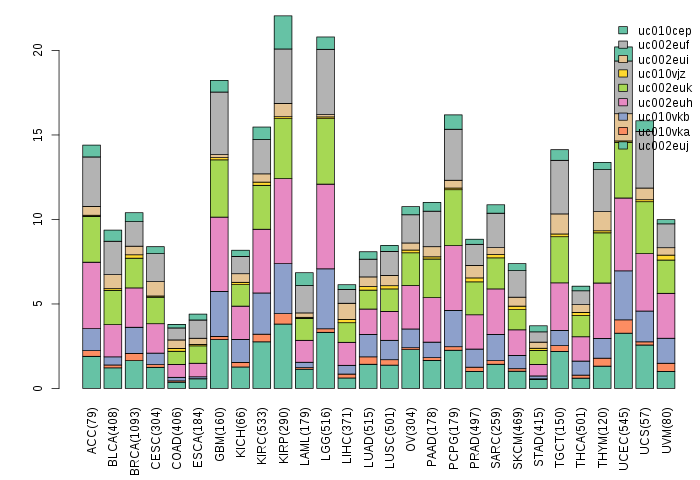
| Gene isoform expressions across 28 cancer types (X-axis: cancer type and Y-axis: log2(norm_counts+1)) (TCGA pan-cancer tcga_rsem_isoform_tpm, version 2016-09-01) |
 |
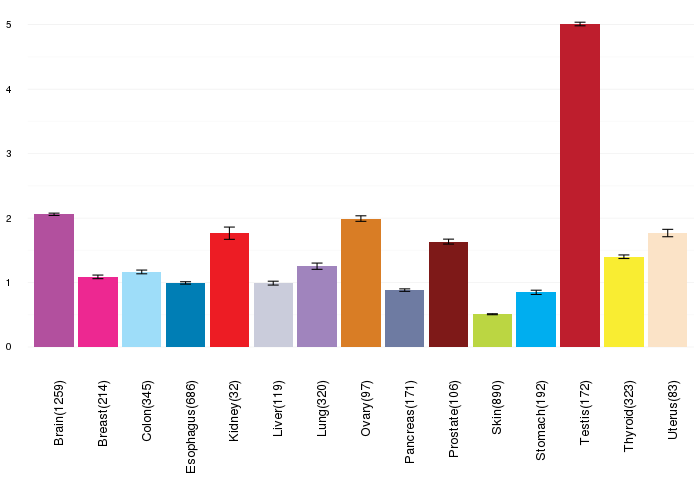
| Gene expressions across normal tissues of GTEx data (GTEx GTEx_Analysis_v6_RNA-seq_RNA-SeQCv1.1.8_gene_rpkm.gct) - Here, we shows the matched tissue types only among our 28 cancer types. |
 |
| Different expressions across 14 cancer types with more than 10 samples between matched tumors and normals (X-axis: cancer type and Y-axis: log2(norm_counts+1)) (TCGA IlluminaHiSeq_RNASeqV2, pan-cancer normalized log2(norm_counts+1) data, version 2016-08-16) |
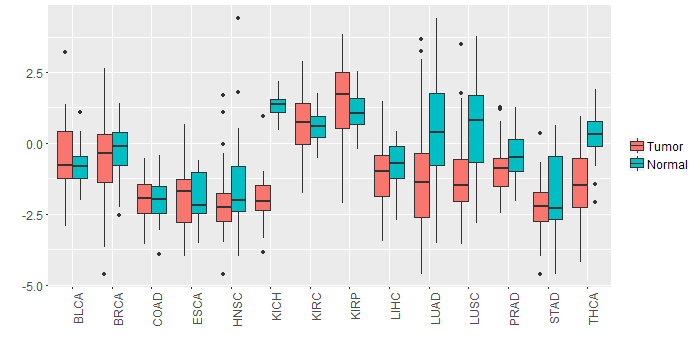 |
| - Significantly differentially expressed cancer types and information. (|Fold change|>1 and FDR<0.05) |
| Cancer type | Mean(exp) in tumor | Mean(exp) in matched normal | Log2FC | P-val. | FDR |
| KICH | -1.948449572 | 1.313730428 | -3.26218 | 2.02E-17 | 8.40E-16 |
| THCA | -1.460463538 | 0.30147714 | -1.761940678 | 2.29E-15 | 3.09E-14 |
| LUAD | -1.250982123 | 0.468879946 | -1.719862069 | 7.60E-07 | 2.59E-06 |
| LUSC | -1.312273807 | 0.517200703 | -1.82947451 | 4.16E-08 | 1.22E-07 |
| Top |
| TissGene-miRNA for TSNAXIP1 |
| Significantly anti-correlated miRNAs of TissGene across 28 cancer types (Gene-miRNA relations from TargetScanHuman Relsease 7.1, Conserved_Site_Context_Scores.txt.zip, 06.01.2016) (TCGA IlluminaHiSeq_miRNASeq, log2(RPM+1) data, version 2016-11-21) (TCGA IlluminaHiSeq_RNASeqV2, log2(normalized_count+1) data, version 2016-08-16) (Spearman’s Rank Correlation (p-value<0.05 and coefficient<-0.25)) |
| Cancer type | miRNA id | miRNA accession | P-val. | Coeff. | # samples |
| Top |
| TissGeneMut for TSNAXIP1 |
| TissGeneSNV for TSNAXIP1 |
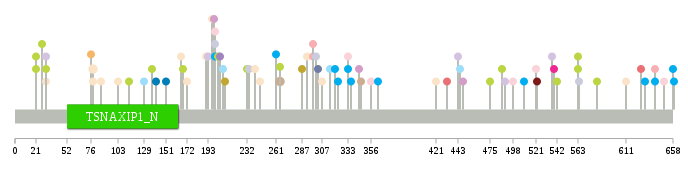
| nsSNV counts per each loci. Different colors of circles represent different cancer types. Circle size denotes number of samples. (TCGA somatic mutation (SNPs and small INDELs) data, version 2016-04-25) * Click on the image to enlarge it in a new window. |
 |
 |
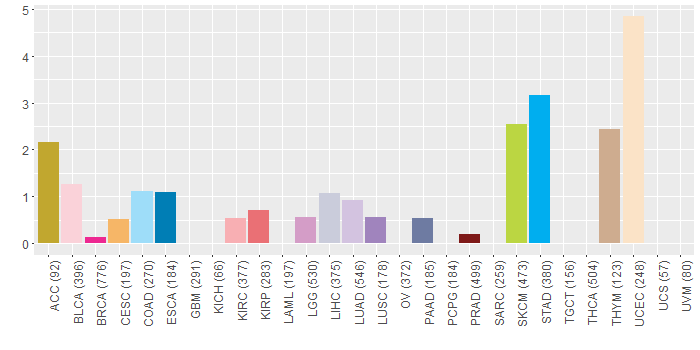
| Somatic nucleotide variants of TissGene across 28 cancer types (X-axis: cancer type and Y-axis: % of mutated samples) The numbers in parentheses are numbers of samples with mutation (nsSNVs). (TCGA somatic mutation (SNPs and small INDELs) data, version 2016-04-25) |
 |
| - nsSNVs sorted by frequency. |
| AAchange | Cancer type | # samples |
| p.R78I | UCEC | 2 |
| p.E265K | THYM | 2 |
| p.L292R | UCEC | 1 |
| p.M137I | SKCM | 1 |
| p.A487T | SKCM | 1 |
| p.R21X | SKCM | 1 |
| p.S539* | BRCA | 1 |
| p.K344N | LGG | 1 |
| p.K166N | UCEC | 1 |
| p.E356K | BLCA | 1 |
| p.K287N | ACC | 1 |
| p.L197I | UCEC | 1 |
| p.E141D | ESCA | 1 |
| p.R652G | HNSC | 1 |
| p.R114W | SKCM | 1 |
| p.S168L | SKCM | 1 |
| p.R640Q | KIRC | 1 |
| p.F261S | STAD | 1 |
| p.E151X | ESCA | 1 |
| p.K626Q | KIRP | 1 |
| p.D200N | BLCA | 1 |
| p.E563X | SKCM | 1 |
| p.R363W | STAD | 1 |
| p.R315H | COAD | 1 |
| p.A193T | LUAD | 1 |
| p.Q15H | HNSC | 1 |
| p.R245* | UCEC | 1 |
| p.D210E | ACC | 1 |
| p.T416K | HNSC | 1 |
| p.P509T | STAD | 1 |
| p.E265K | SKCM | 1 |
| p.X659Q | STAD | 1 |
| p.S298N | KIRC | 1 |
| p.F307L | UCEC | 1 |
| p.E498Q | BLCA | 1 |
| p.Y537* | LUAD | 1 |
| p.E475K | SKCM | 1 |
| p.R31L | LUAD | 1 |
| p.P86T | UCEC | 1 |
| p.Q490* | LUAD | 1 |
| p.R240C | UCEC | 1 |
| p.G524S | HNSC | 1 |
| p.D27N | SKCM | 1 |
| p.V649M | BLCA | 1 |
| p.K301R | LIHC | 1 |
| p.R336H | STAD | 1 |
| p.D200E | LIHC | 1 |
| p.D200H | STAD | 1 |
| p.P76A | CESC | 1 |
| p.S346I | THYM | 1 |
| p.F421C | UCEC | 1 |
| p.I445M | COAD | 1 |
| p.A78V | UCEC | 1 |
| p.G333C | BLCA | 1 |
| p.E443* | LUAD | 1 |
| p.R21* | SKCM | 1 |
| p.G333D | STAD | 1 |
| p.E172K | UCEC | 1 |
| p.E563* | SKCM | 1 |
| p.K232Q | SKCM | 1 |
| p.A199T | LGG | 1 |
| p.E521K | BLCA | 1 |
| p.R208W | COAD | 1 |
| p.M542I | SKCM | 1 |
| p.R31* | UCEC | 1 |
| p.R320Q | STAD | 1 |
| p.E205Q | LUSC | 1 |
| p.E203K | SKCM | 1 |
| p.F88L | HNSC | 1 |
| p.T234A | LIHC | 1 |
| p.K564E | LIHC | 1 |
| p.V630M | STAD | 1 |
| p.E582K | SKCM | 1 |
| p.D129G | COAD | 1 |
| p.S432N | KIRP | 1 |
| p.S298C | KIRC | 1 |
| p.S658R | STAD | 1 |
| p.F448V | LGG | 1 |
| p.R640L | STAD | 1 |
| p.R31Q | SKCM | 1 |
| p.W323R | STAD | 1 |
| p.R191* | UCEC | 1 |
| p.A611T | UCEC | 1 |
| p.A522E | PRAD | 1 |
| p.R303W | PAAD | 1 |
| p.L292P | READ | 1 |
| p.E103D | UCEC | 1 |
| Top |
| TissGeneCNV for TSNAXIP1 |
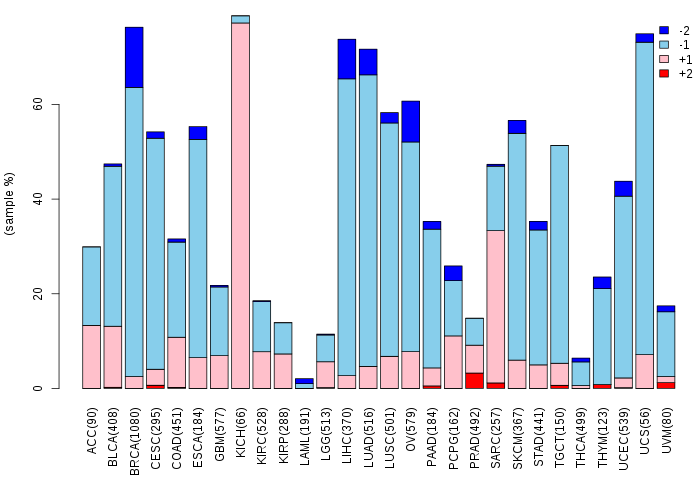
| Copy number variations of TissGene across 28 cancer types (X-axis: cancer type and Y-axis: % of CNV samples) (TCGA Gistic2_CopyNumber_Gistic2_all_data_by_genes, Gistic2 copy number data, version 2016-08-16) |
 |
| Top |
| TissGeneFusions for TSNAXIP1 |
| Fusion genes including TissGene (ChimerDB 3.0, 2016-12-01 and TCGA fusion Portal 2015-12-01) |
| Database | Src | Cancer type | Sample | Fusion gene | ORF | 5'-gene BP | 3'-gene BP |
| Chimerdb3.0 | ChiTaRs | NA | AI286092 | TSNAXIP1-GPSM1 | chr16:67861970 | chr9:139244244 | |
| Chimerdb3.0 | FusionScan | ACC | TCGA-OR-A5K2-01A | NUTF2-TSNAXIP1 | 5'UTR-CDS | chr16:67880888 | chr16:67861151 |
| Chimerdb3.0 | FusionScan | ACC | TCGA-OR-A5K2-01A | NUTF2-TSNAXIP1 | 5'UTR-CDS | chr16:67880888 | chr16:67860865 |
| Chimerdb3.0 | TopHat-Fusion | ACC | TCGA-OR-A5K2-01A | TSNAXIP1-CENPT | CDS-5'UTR | chr16:67860865 | chr16:67880887 |
| Chimerdb3.0 | TopHat-Fusion | ACC | TCGA-OR-A5K2-01A | TSNAXIP1-CENPT | CDS-5'UTR | chr16:67861151 | chr16:67881358 |
| Top |
| TissGeneNet for TSNAXIP1 |
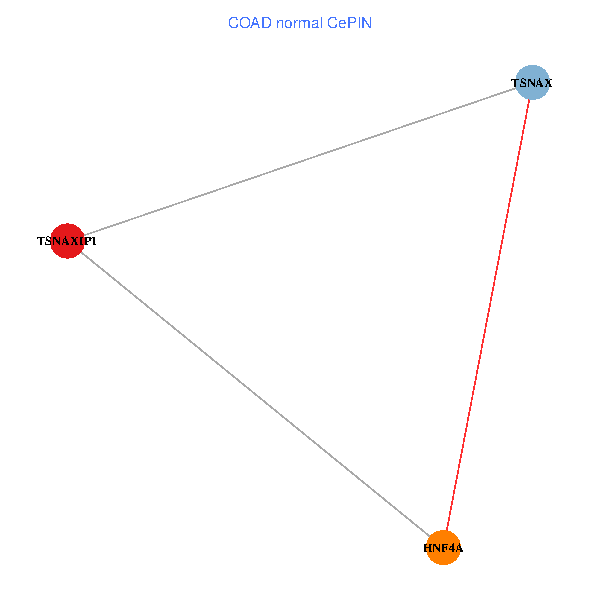
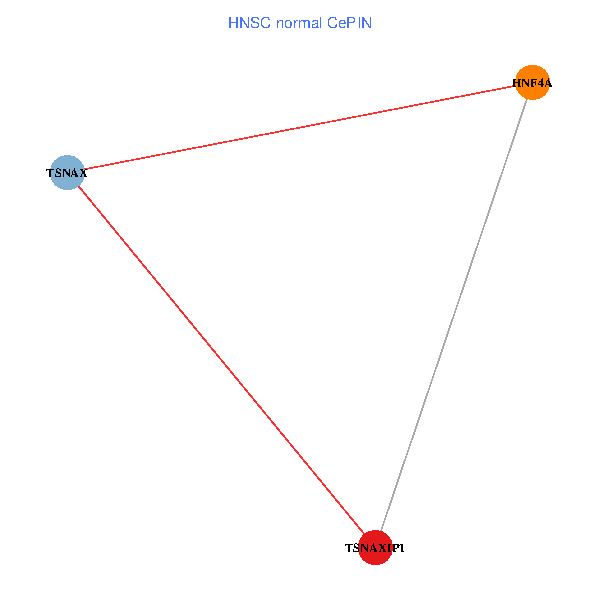
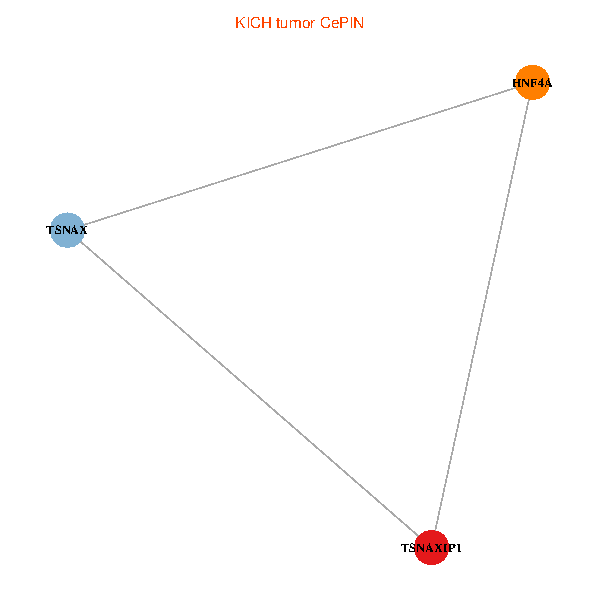
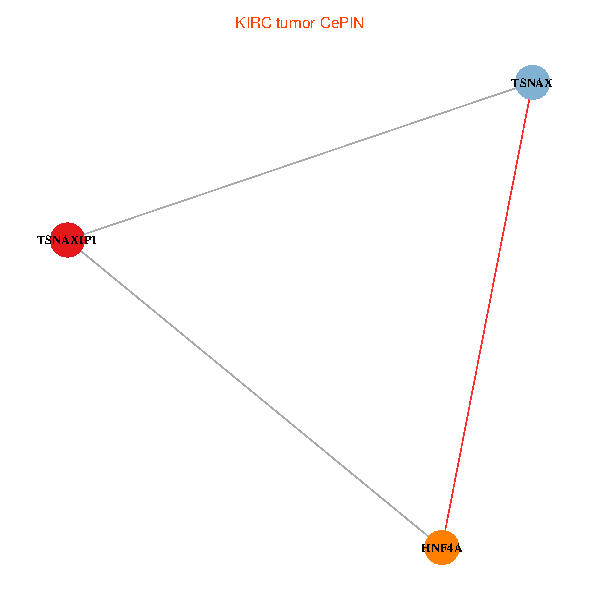
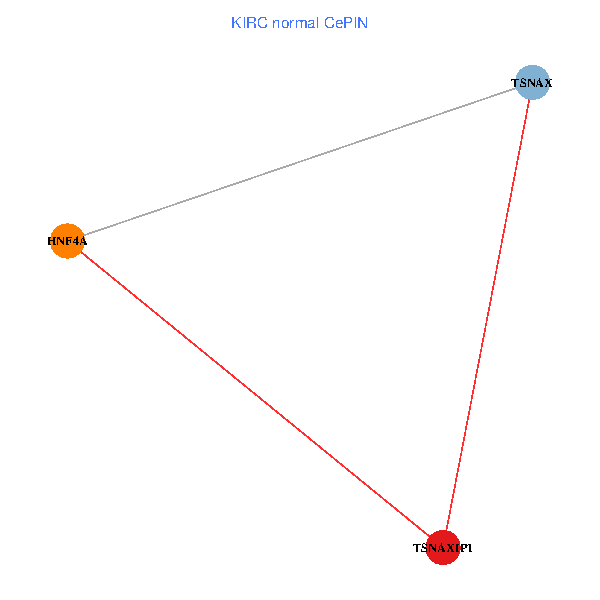
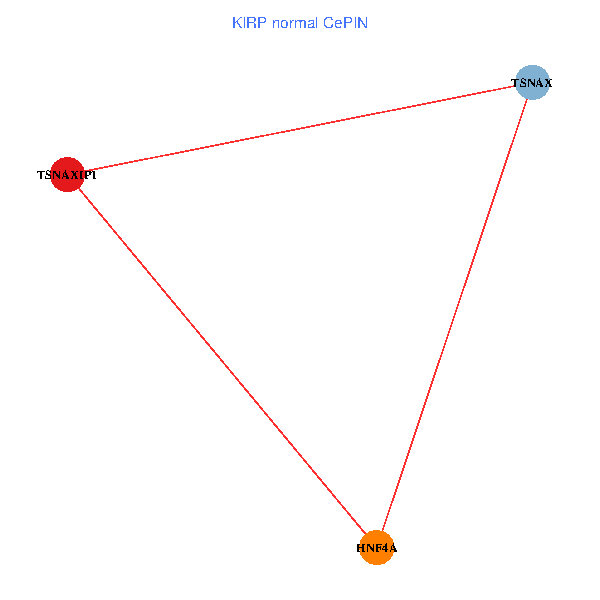
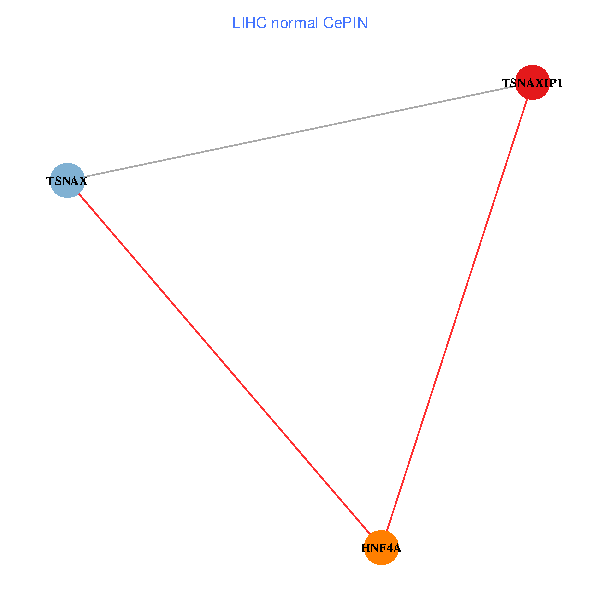
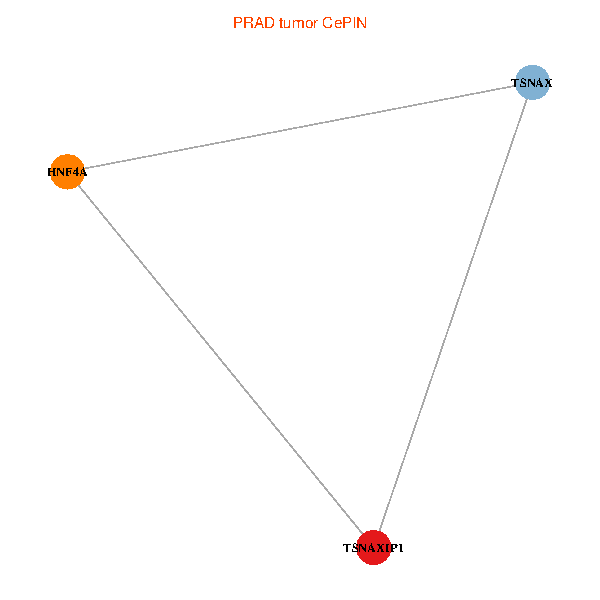
| Co-expressed gene networks based on protein-protein interaction data (CePIN) (TCGA IlluminaHiSeq_RNASeqV2, pan-cancer normalized log2(norm_counts+1) data, version 2016-08-16) (PINA2 ppi data) |
| BRCA (tumor) | BRCA (normal) |
| TSNAXIP1, HNF4A, TSNAX (tumor) | TSNAXIP1, HNF4A, TSNAX (normal) |
 |  |
| COAD (tumor) | COAD (normal) |
| TSNAXIP1, HNF4A, TSNAX (tumor) | TSNAXIP1, HNF4A, TSNAX (normal) |
 |  |
| HNSC (tumor) | HNSC (normal) |
| TSNAXIP1, HNF4A, TSNAX (tumor) | TSNAXIP1, HNF4A, TSNAX (normal) |
 |  |
| KICH (tumor) | KICH (normal) |
| TSNAXIP1, HNF4A, TSNAX (tumor) | TSNAXIP1, HNF4A, TSNAX (normal) |
 |  |
| KIRC (tumor) | KIRC (normal) |
| TSNAXIP1, HNF4A, TSNAX (tumor) | TSNAXIP1, HNF4A, TSNAX (normal) |
 |  |
| KIRP (tumor) | KIRP (normal) |
| TSNAXIP1, HNF4A, TSNAX (tumor) | TSNAXIP1, HNF4A, TSNAX (normal) |
 |  |
| LIHC (tumor) | LIHC (normal) |
| TSNAXIP1, HNF4A, TSNAX (tumor) | TSNAXIP1, HNF4A, TSNAX (normal) |
 |  |
| LUAD (tumor) | LUAD (normal) |
| TSNAXIP1, HNF4A, TSNAX (tumor) | TSNAXIP1, HNF4A, TSNAX (normal) |
 |  |
| LUSC (tumor) | LUSC (normal) |
| TSNAXIP1, HNF4A, TSNAX (tumor) | TSNAXIP1, HNF4A, TSNAX (normal) |
 |  |
| PRAD (tumor) | PRAD (normal) |
| TSNAXIP1, HNF4A, TSNAX (tumor) | TSNAXIP1, HNF4A, TSNAX (normal) |
 |  |
| STAD (tumor) | STAD (normal) |
| TSNAXIP1, HNF4A, TSNAX (tumor) | TSNAXIP1, HNF4A, TSNAX (normal) |
 |  |
| THCA (tumor) | THCA (normal) |
| TSNAXIP1, HNF4A, TSNAX (tumor) | TSNAXIP1, HNF4A, TSNAX (normal) |
 |  |
| Top |
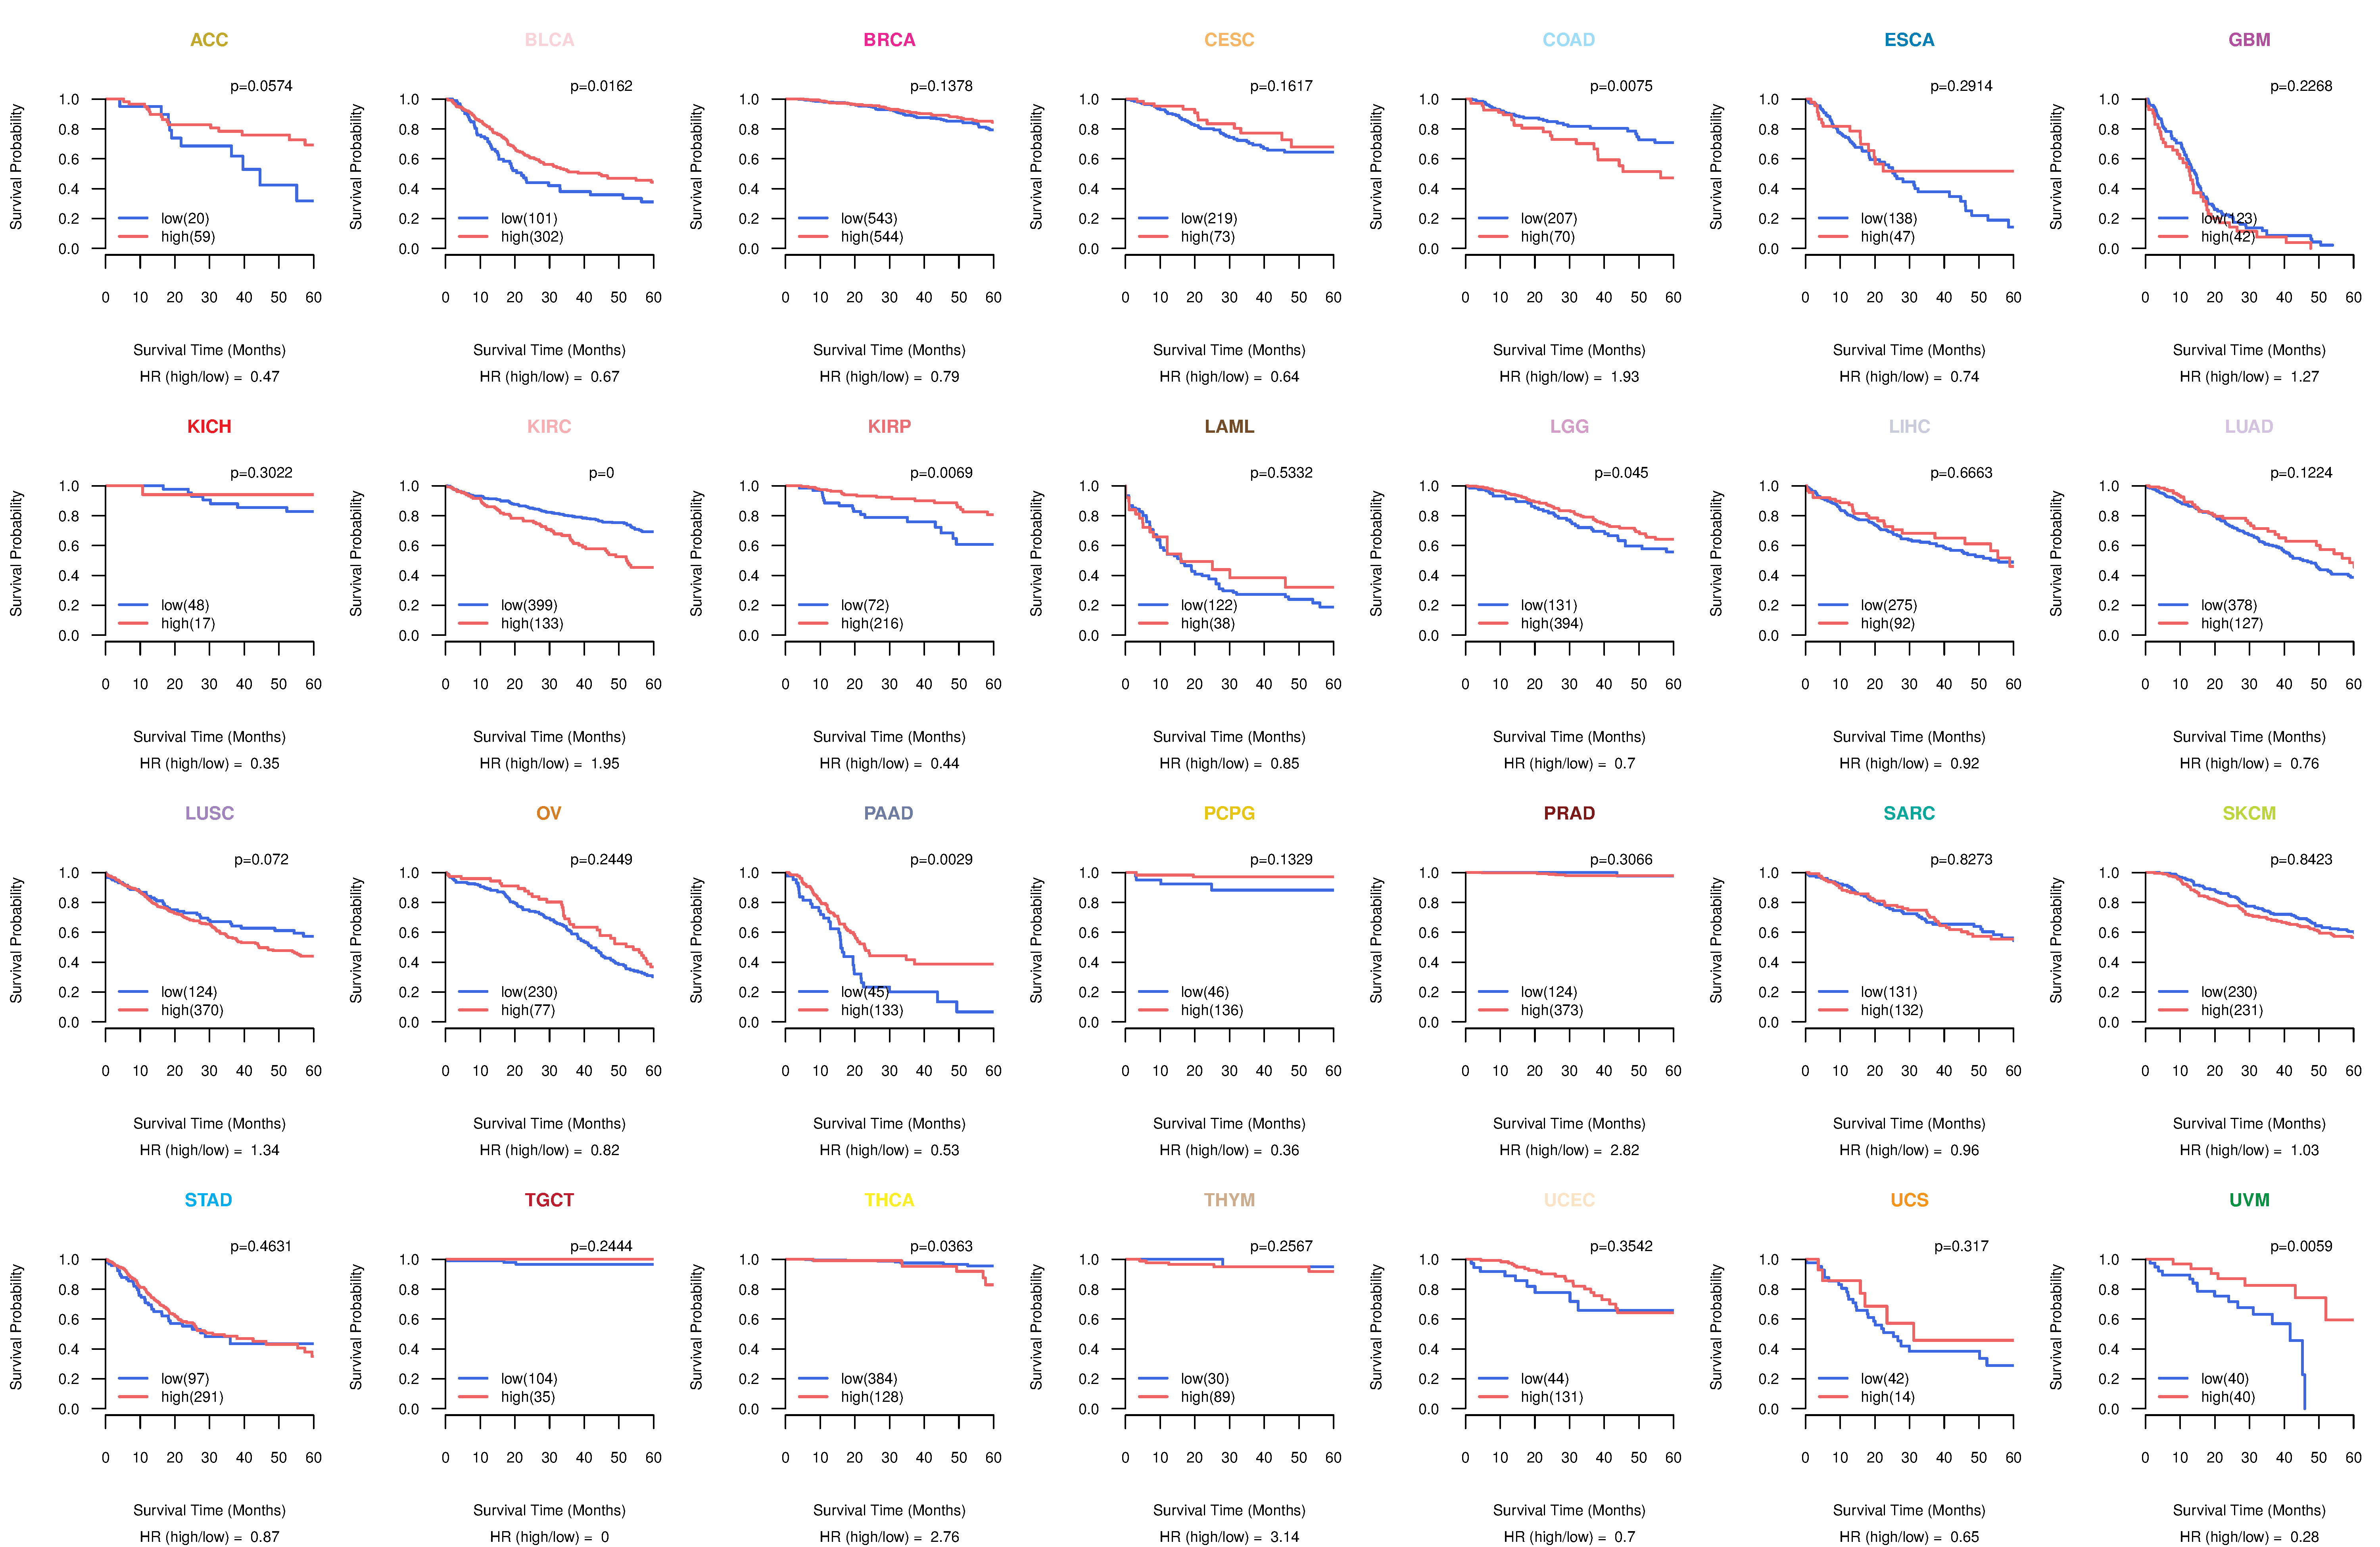
| TissGeneProg for TSNAXIP1 |
| Kaplan-Meier plots with logrank tests of overall survival (OS) using 28 cancer types (TCGA IlluminaHiSeq_RNASeqV2, pan-cancer normalized log2(norm_counts+1) data, version 2016-08-16) (TCGA clinicalMatrix, phenotype data, version 2016-04-27) * Click on the image to enlarge it in a new window. |
 |
| Kaplan-Meier plots with logrank test of relapse free survival (RFS) using 28 cancer types (TCGA IlluminaHiSeq_RNASeqV2, pan-cancer normalized log2(norm_counts+1) data, version 2016-08-16) (TCGA clinicalMatrix, phenotype data, version 2016-04-27) * Click on the image enlarge it in a new window. |
 |
| Forest plot of Cox proportional hazard ratio (HR) and 95% CI of overall survival (OS) using 28 cancer types (TCGA IlluminaHiSeq_RNASeqV2, pan-cancer normalized log2(norm_counts+1) data, version 2016-08-16) (TCGA clinicalMatrix, phenotype data, version 2016-04-27) * Click on the image enlarge it in a new window. |
 |
| Forest plot of Cox proportional hazard ratio (HR) and 95% CI of relapse free survival (RFS) using 28 cancer types (TCGA IlluminaHiSeq_RNASeqV2, pan-cancer normalized log2(norm_counts+1) data, version 2016-08-16) (TCGA clinicalMatrix, phenotype data, version 2016-04-27) * Click on the image enlarge it in a new window. |
 |
| Top |
| TissGeneClin for TSNAXIP1 |
| TissGeneDrug for TSNAXIP1 |
| Drug information targeting TissGene (DrugBank Version 5.0.6, 2017-04-01) |
| DrugBank ID | Drug name | Drug activity | Drug type | Drug status |
| Top |
| TissGeneDisease for TSNAXIP1 |
| Disease information associated with TissGene (DisGeNet, 2016-06-01) |
| Disease ID | Disease name | # pubmeds | Source |
|
Copyright 2016-Present - The University of Texas Health Science Center at Houston (UTHealth) Web File Viewing | How to Report, Fraud, Waste and Abuse | State of Texas | Statewide Search | Texas Homeland Security | Site Policies |