 |
| |
| |
| |
| |
| |
| |
|

| TissGeneSummary for TEX14 |
 Gene summary Gene summary |
| Basic gene information | Gene symbol | TEX14 |
| Gene name | testis expressed 14 | |
| Synonyms | CT113 | |
| Cytomap | UCSC genome browser: 17q22 | |
| Type of gene | protein-coding | |
| RefGenes | NM_001201457.1, NM_031272.4,NM_198393.3, | |
| Description | cancer/testis antigen 113inactive serine/threonine-protein kinase TEX14protein kinase-like protein SgK307sugen kinase 307testis expressed sequence 14testis-expressed protein 14testis-expressed sequence 14 protein | |
| Modification date | 20141207 | |
| dbXrefs | MIM : 605792 | |
| HGNC : HGNC | ||
| Ensembl : ENSG00000121101 | ||
| Vega : OTTHUMG00000179245 | ||
| Protein | UniProt: go to UniProt's Cross Reference DB Table | |
| Expression | CleanEX: HS_TEX14 | |
| BioGPS: 56155 | ||
| Pathway | NCI Pathway Interaction Database: TEX14 | |
| KEGG: TEX14 | ||
| REACTOME: TEX14 | ||
| Pathway Commons: TEX14 | ||
| Context | iHOP: TEX14 | |
| ligand binding site mutation search in PubMed: TEX14 | ||
| UCL Cancer Institute: TEX14 | ||
| Assigned class in TissGDB* | A | |
| Included tissue-specific gene expression resources | HPA,TiGER,GTEx | |
| Specific-tissues in normal samples (assigned by TissGDB using HPA, TiGER, and GTEx) | Testis | |
| Cancer types related to the specific-tissues in cancer samples (assigned by TissGDB using TCGA) | TGCT | |
| Reference showing the relevant tissue of TEX14 | Structural and biochemical insights into the role of testis-expressed gene 14 (TEX14) in forming the stable intercellular bridges of germ cells. Proc Natl Acad Sci U S A. 2015 Oct 6;112(40):12372-7. doi: (pmid:26392564 ) go to article | |
| Description by TissGene annotations | Cancer gene | |
| * Class A consists of genes with literature evidence and is part of the cTissGenes. Class B consists of only cTissGenes without additional evidence. The remaining genes belong to Class C. |
| Gene ontology having evidence of Inferred from Direct Assay (IDA) from Entrez |
| GO ID | GO term | PubMed ID |
| Top |
| TissGeneExp for TEX14 |
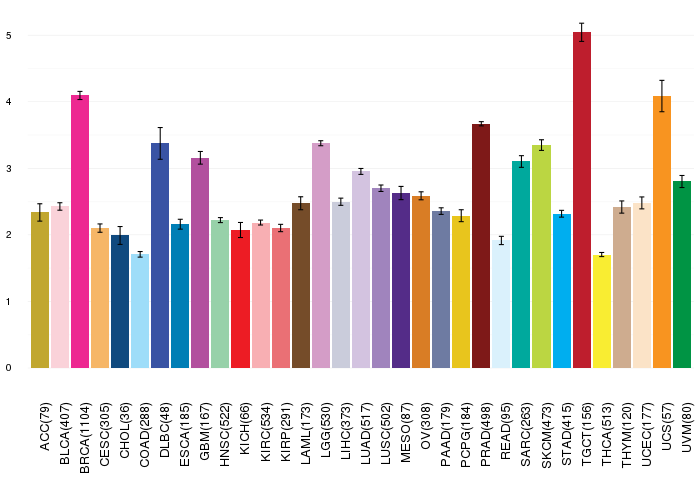
| Gene expressions across 28 cancer types (X-axis: cancer type and Y-axis: log2(norm_counts+1)) (TCGA IlluminaHiSeq_RNASeqV2, pan-cancer normalized log2(norm_counts+1) data, version 2016-08-16) |
 |
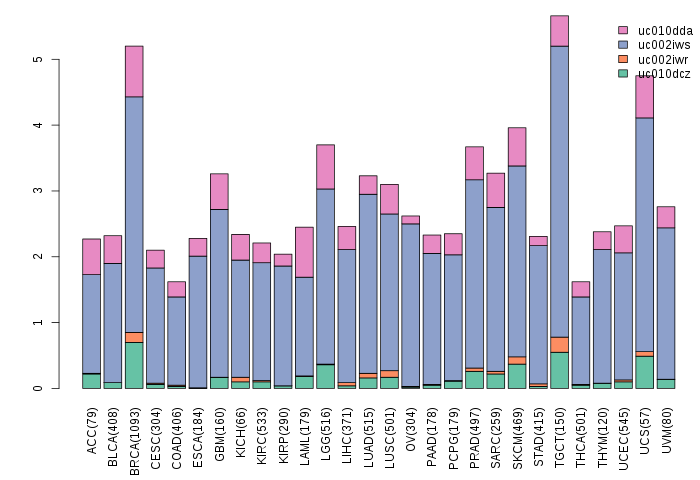
| Gene isoform expressions across 28 cancer types (X-axis: cancer type and Y-axis: log2(norm_counts+1)) (TCGA pan-cancer tcga_rsem_isoform_tpm, version 2016-09-01) |
 |
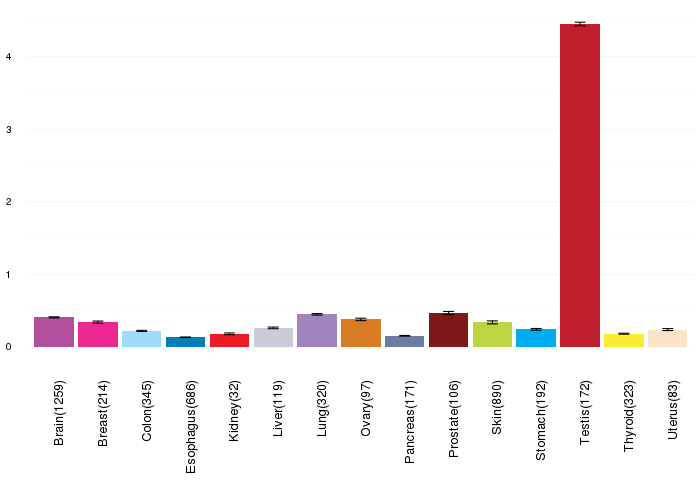
| Gene expressions across normal tissues of GTEx data (GTEx GTEx_Analysis_v6_RNA-seq_RNA-SeQCv1.1.8_gene_rpkm.gct) - Here, we shows the matched tissue types only among our 28 cancer types. |
 |
| Different expressions across 14 cancer types with more than 10 samples between matched tumors and normals (X-axis: cancer type and Y-axis: log2(norm_counts+1)) (TCGA IlluminaHiSeq_RNASeqV2, pan-cancer normalized log2(norm_counts+1) data, version 2016-08-16) |
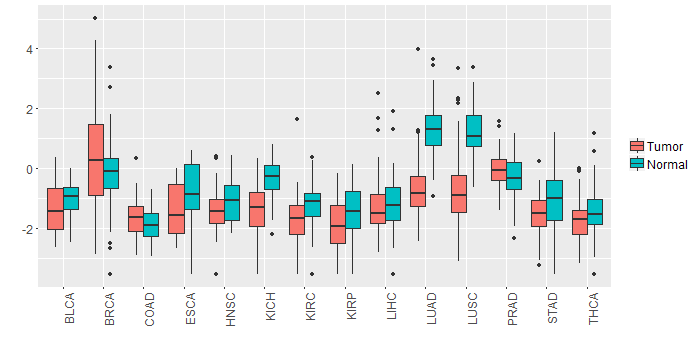 |
| - Significantly differentially expressed cancer types and information. (|Fold change|>1 and FDR<0.05) |
| Cancer type | Mean(exp) in tumor | Mean(exp) in matched normal | Log2FC | P-val. | FDR |
| LUSC | -0.62876855 | 1.236311842 | -1.865080392 | 1.73E-12 | 7.76E-12 |
| LUAD | -0.624479977 | 1.30705623 | -1.931536207 | 3.33E-19 | 5.88E-18 |
| KICH | -1.370256943 | -0.350796943 | -1.01946 | 4.28E-05 | 0.000120448 |
| Top |
| TissGene-miRNA for TEX14 |
| Significantly anti-correlated miRNAs of TissGene across 28 cancer types (Gene-miRNA relations from TargetScanHuman Relsease 7.1, Conserved_Site_Context_Scores.txt.zip, 06.01.2016) (TCGA IlluminaHiSeq_miRNASeq, log2(RPM+1) data, version 2016-11-21) (TCGA IlluminaHiSeq_RNASeqV2, log2(normalized_count+1) data, version 2016-08-16) (Spearman’s Rank Correlation (p-value<0.05 and coefficient<-0.25)) |
| Cancer type | miRNA id | miRNA accession | P-val. | Coeff. | # samples |
| Top |
| TissGeneMut for TEX14 |
| TissGeneSNV for TEX14 |
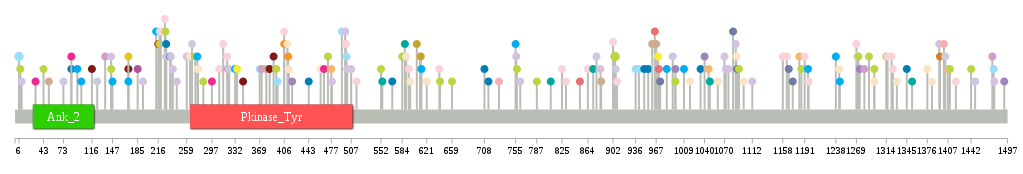
| nsSNV counts per each loci. Different colors of circles represent different cancer types. Circle size denotes number of samples. (TCGA somatic mutation (SNPs and small INDELs) data, version 2016-04-25) * Click on the image to enlarge it in a new window. |
 |
 |
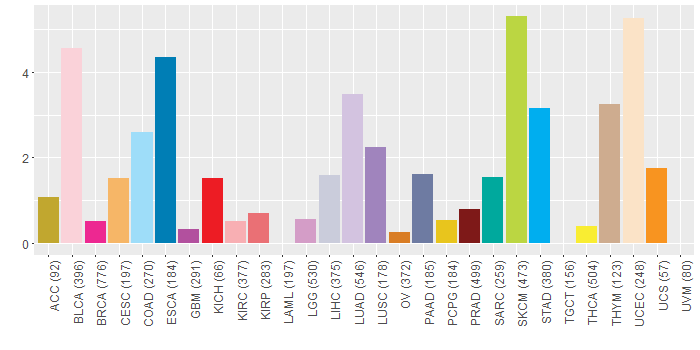
| Somatic nucleotide variants of TissGene across 28 cancer types (X-axis: cancer type and Y-axis: % of mutated samples) The numbers in parentheses are numbers of samples with mutation (nsSNVs). (TCGA somatic mutation (SNPs and small INDELs) data, version 2016-04-25) |
 |
| - nsSNVs sorted by frequency. |
| AAchange | Cancer type | # samples |
| p.R6C | COAD | 2 |
| p.E905K | SKCM | 2 |
| p.W928* | HNSC | 1 |
| p.S1060Y | UCEC | 1 |
| p.P532T | READ | 1 |
| p.L227F | SKCM | 1 |
| p.C1244Y | STAD | 1 |
| p.E1376A | READ | 1 |
| p.E743K | HNSC | 1 |
| p.W1476X | COAD | 1 |
| p.Q226H | BLCA | 1 |
| p.S1088L | UCEC | 1 |
| p.E1270Q | BLCA | 1 |
| p.M908I | BLCA | 1 |
| p.A238S | LUAD | 1 |
| p.S1183C | CESC | 1 |
| p.S1264Y | READ | 1 |
| p.A613V | STAD | 1 |
| p.E983Q | STAD | 1 |
| p.T906A | LIHC | 1 |
| p.I554T | SARC | 1 |
| p.K126* | HNSC | 1 |
| p.R406* | UCS | 1 |
| p.P569H | ESCA | 1 |
| p.Q970* | THCA | 1 |
| p.E1477K | LUAD | 1 |
| p.E394K | SKCM | 1 |
| p.E606V | ACC | 1 |
| p.S1186F | SKCM | 1 |
| p.D499H | BLCA | 1 |
| p.D1167Y | PAAD | 1 |
| p.D477N | CESC | 1 |
| p.R501Q | LUAD | 1 |
| p.S1383P | UCEC | 1 |
| p.L726H | READ | 1 |
| p.T941A | COAD | 1 |
| p.E396K | COAD | 1 |
| p.E1089Q | PAAD | 1 |
| p.R171Q | PCPG | 1 |
| p.C308R | BLCA | 1 |
| p.G267E | LIHC | 1 |
| p.E321K | LGG | 1 |
| p.F1322L | BLCA | 1 |
| p.S245Y | READ | 1 |
| p.F880L | READ | 1 |
| p.S379Y | THYM | 1 |
| p.S1345F | ESCA | 1 |
| p.Q220H | BLCA | 1 |
| p.S883R | LUAD | 1 |
| p.E320Q | BLCA | 1 |
| p.R412X | UCS | 1 |
| p.W955C | ESCA | 1 |
| p.I642V | HNSC | 1 |
| p.D284N | SKCM | 1 |
| p.L275M | STAD | 1 |
| p.S1274F | LUSC | 1 |
| p.W934* | HNSC | 1 |
| p.E730X | KIRC | 1 |
| p.P10L | HNSC | 1 |
| p.R1018M | UCEC | 1 |
| p.E1034A | ESCA | 1 |
| p.P8S | SKCM | 1 |
| p.A390V | PRAD | 1 |
| p.A461V | UCEC | 1 |
| p.E1376* | UCEC | 1 |
| p.S659F | SKCM | 1 |
| p.S708* | ESCA | 1 |
| p.E749K | HNSC | 1 |
| p.E996K | LUSC | 1 |
| p.P228L | LUAD | 1 |
| p.A872D | SARC | 1 |
| p.S714X | ESCA | 1 |
| p.R369C | COAD | 1 |
| p.Y478* | LUAD | 1 |
| p.E552K | SKCM | 1 |
| p.S1070T | LUAD | 1 |
| p.R136H | LGG | 1 |
| p.S443Y | ESCA | 1 |
| p.P808T | SARC | 1 |
| p.A884T | THYM | 1 |
| p.A213V | STAD | 1 |
| p.I500V | COAD | 1 |
| p.E1083Q | PAAD | 1 |
| p.R864T | BLCA | 1 |
| p.G641R | SKCM | 1 |
| p.S278N | READ | 1 |
| p.E1164* | BLCA | 1 |
| p.R755M | STAD | 1 |
| p.V472F | SKCM | 1 |
| p.T411M | UCEC | 1 |
| p.P584S | SKCM | 1 |
| p.E1040K | LUSC | 1 |
| p.E1330D | UCEC | 1 |
| p.Q594E | BLCA | 1 |
| p.D73V | LIHC | 1 |
| p.E1046* | CESC | 1 |
| p.N466I | BRCA | 1 |
| p.E621K | UCEC | 1 |
| p.S1197A | BLCA | 1 |
| p.A787V | SKCM | 1 |
| p.A51V | THYM | 1 |
| p.R1442K | SKCM | 1 |
| p.A244S | LUAD | 1 |
| p.A1296T | SKCM | 1 |
| p.E1158* | BLCA | 1 |
| p.P1272S | SKCM | 1 |
| p.R116Q | PRAD | 1 |
| p.E596D | UCEC | 1 |
| p.P234L | ESCA | 1 |
| p.Q1492H | LUSC | 1 |
| p.D1419Y | READ | 1 |
| p.M344I | PRAD | 1 |
| p.E1394D | LUAD | 1 |
| p.R1281I | LGG | 1 |
| p.Q418H | LUSC | 1 |
| p.P272L | SKCM | 1 |
| p.P1448Q | LUAD | 1 |
| p.A936T | COAD | 1 |
| p.S877R | LUAD | 1 |
| p.R406G | BLCA | 1 |
| p.R1395I | OV | 1 |
| p.S1269C | BLCA | 1 |
| p.P640A | BLCA | 1 |
| p.P228L | ESCA | 1 |
| p.G332S | STAD | 1 |
| p.T1048K | SARC | 1 |
| p.W259* | LUAD | 1 |
| p.E590D | UCEC | 1 |
| p.S1191A | BLCA | 1 |
| p.R171W | STAD | 1 |
| p.A1296T | UCEC | 1 |
| p.N276D | UCEC | 1 |
| p.A1196D | STAD | 1 |
| p.V31F | BRCA | 1 |
| p.A973T | PAAD | 1 |
| p.L1324P | BLCA | 1 |
| p.C147R | STAD | 1 |
| p.W216* | KICH | 1 |
| p.A1288S | SKCM | 1 |
| p.E1243* | UCEC | 1 |
| p.P1410L | SKCM | 1 |
| p.A967T | THYM | 1 |
| p.E1314K | SKCM | 1 |
| p.Q498E | LUAD | 1 |
| p.E612V | ACC | 1 |
| p.V264A | UCEC | 1 |
| p.R493X | COAD | 1 |
| p.P965A | KIRP | 1 |
| p.E757K | SKCM | 1 |
| p.E1076K | LUAD | 1 |
| p.K852N | KIRP | 1 |
| p.L413I | UCEC | 1 |
| p.A218V | READ | 1 |
| p.F1316L | BLCA | 1 |
| p.S1099L | UCEC | 1 |
| p.W949C | ESCA | 1 |
| p.M902I | BLCA | 1 |
| p.Q515H | BLCA | 1 |
| p.R193* | LUAD | 1 |
| p.A588D | SARC | 1 |
| p.E611Q | CESC | 1 |
| p.Q145H | SKCM | 1 |
| p.L43F | SKCM | 1 |
| p.D1419Y | BLCA | 1 |
| p.D756H | LUAD | 1 |
| p.G996E | SKCM | 1 |
| p.A1353E | SARC | 1 |
| p.P825S | BLCA | 1 |
| p.G185_splice | GBM | 1 |
| p.R507Q | LUAD | 1 |
| p.D762H | LUAD | 1 |
| p.R171W | PRAD | 1 |
| p.S372N | LGG | 1 |
| p.A218V | COAD | 1 |
| p.D1072N | LUAD | 1 |
| p.A384V | PRAD | 1 |
| p.I636V | HNSC | 1 |
| p.P831S | BLCA | 1 |
| p.G100D | STAD | 1 |
| p.S1087F | LUAD | 1 |
| p.N124K | LIHC | 1 |
| p.A218G | SKCM | 1 |
| p.P10H | LUAD | 1 |
| p.E992Q | LUAD | 1 |
| p.A1112V | LUAD | 1 |
| p.G181D | CHOL | 1 |
| p.R85P | BRCA | 1 |
| p.G1474C | LGG | 1 |
| p.D1401E | KIRC | 1 |
| p.C1238Y | STAD | 1 |
| p.T1009M | STAD | 1 |
| p.D1173Y | PAAD | 1 |
| p.H1403R | LIHC | 1 |
| p.E1092K | SKCM | 1 |
| p.R297Q | BRCA | 1 |
| p.A961T | THYM | 1 |
| p.D1407E | KIRC | 1 |
| p.R323S | LIHC | 1 |
| p.P971A | KIRP | 1 |
| p.H94R | STAD | 1 |
| p.V235E | LUAD | 1 |
| p.Q145L | LUAD | 1 |
| p.R335* | THCA | 1 |
| p.E314Q | BLCA | 1 |
| p.R85H | ESCA | 1 |
| p.L43I | READ | 1 |
| Top |
| TissGeneCNV for TEX14 |
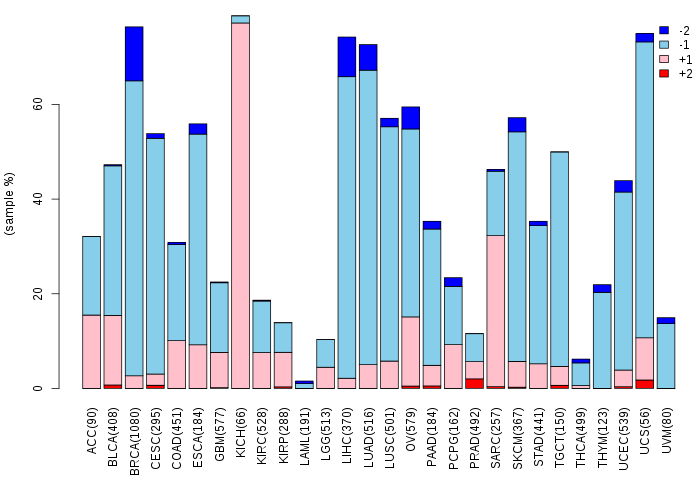
| Copy number variations of TissGene across 28 cancer types (X-axis: cancer type and Y-axis: % of CNV samples) (TCGA Gistic2_CopyNumber_Gistic2_all_data_by_genes, Gistic2 copy number data, version 2016-08-16) |
 |
| Top |
| TissGeneFusions for TEX14 |
| Fusion genes including TissGene (ChimerDB 3.0, 2016-12-01 and TCGA fusion Portal 2015-12-01) |
| Database | Src | Cancer type | Sample | Fusion gene | ORF | 5'-gene BP | 3'-gene BP |
| Chimerdb3.0 | FusionScan | BRCA | TCGA-C8-A1HO-01A | GRB2-TEX14 | 5'UTR-CDS | chr17:73401569 | chr17:56707915 |
| Chimerdb3.0 | FusionScan | BRCA | TCGA-A7-A2KD-01A | KIAA0100-TEX14 | Out-of-Frame | chr17:26965269 | chr17:56692706 |
| Chimerdb3.0 | FusionScan | ESCA | TCGA-L5-A8NJ-01A | PITPNC1-TEX14 | CDS-5'UTR | chr17:65529066 | chr17:56729363 |
| TCGAfusionPortal | PRADA | BRCA | TCGA-A7-A2KD-01A | KIAA0100-TEX14 | Out-of-frame | Chr17:26965270 | Chr17:56692706 |
| TCGAfusionPortal | PRADA | BRCA | TCGA-A8-A07I-01A | TEX14-SDK2 | Out-of-frame | Chr17:56661861 | Chr17:71387677 |
| TCGAfusionPortal | PRADA | BRCA | TCGA-EW-A1J1-01A | ARHGAP23-TEX14 | In-frame | Chr17:36642381 | Chr17:56707915 |
| Top |
| TissGeneNet for TEX14 |
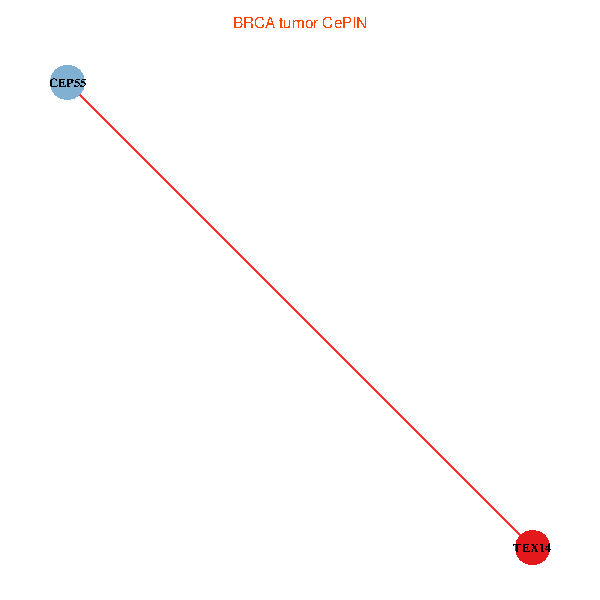
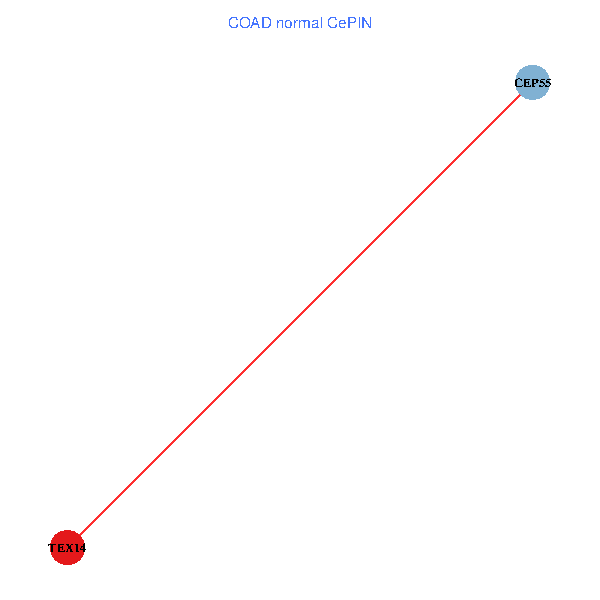
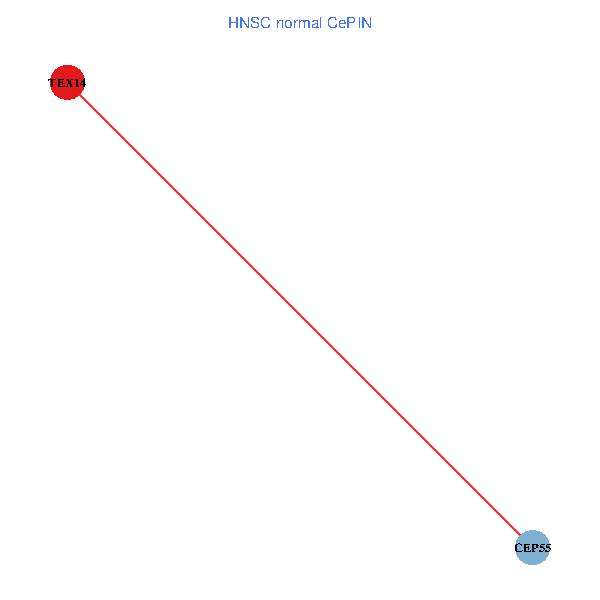
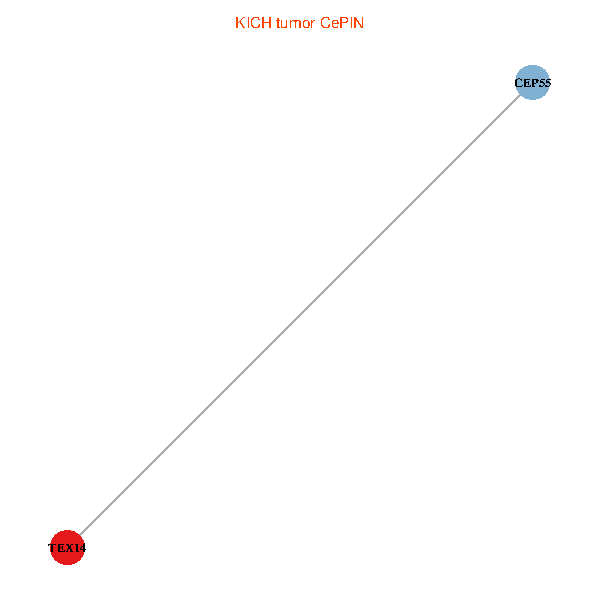
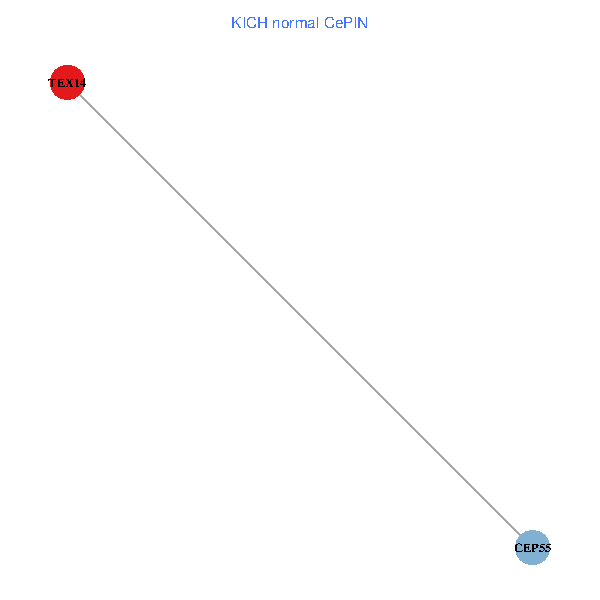
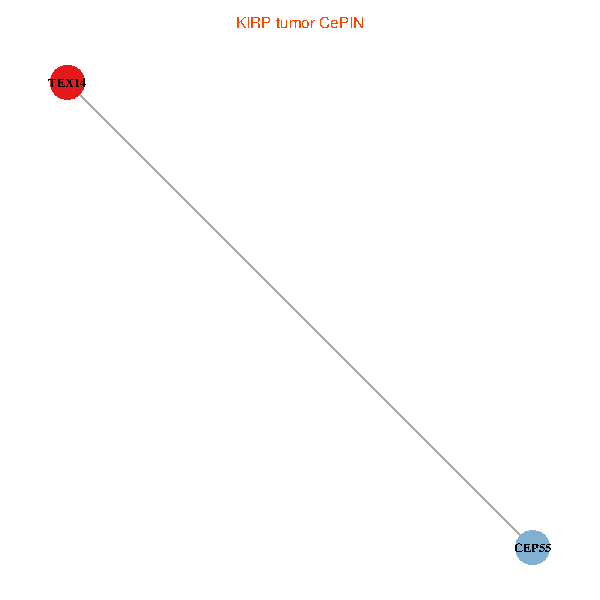
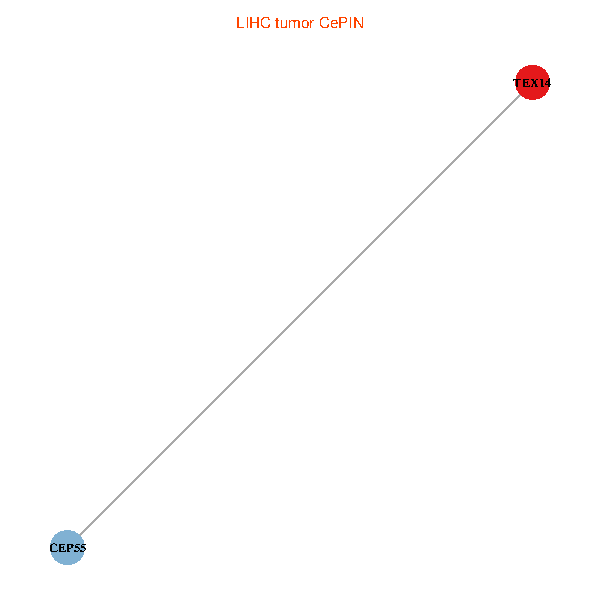
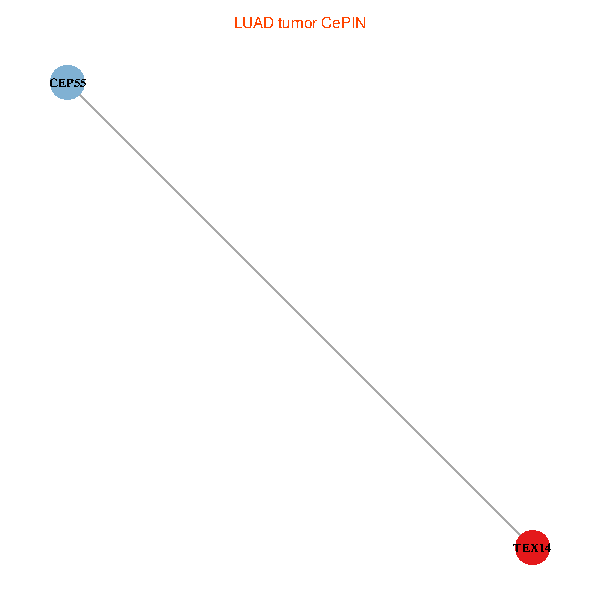
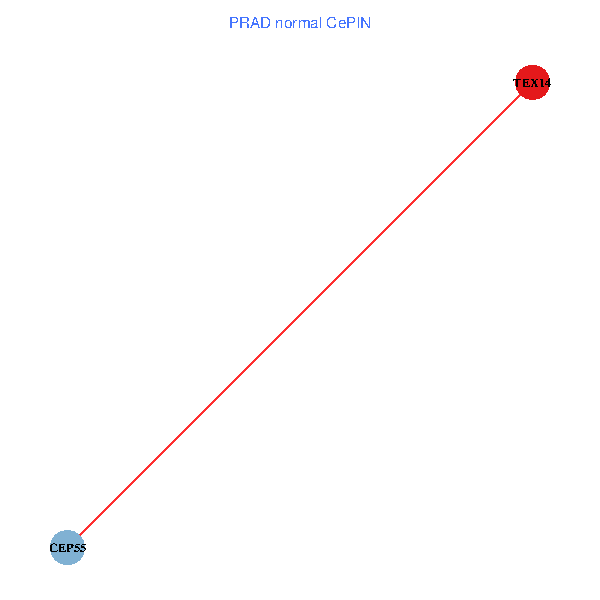
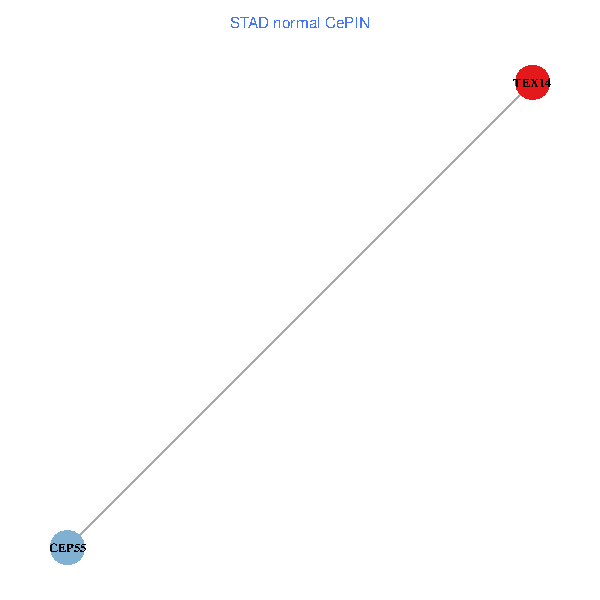
| Co-expressed gene networks based on protein-protein interaction data (CePIN) (TCGA IlluminaHiSeq_RNASeqV2, pan-cancer normalized log2(norm_counts+1) data, version 2016-08-16) (PINA2 ppi data) |
| BRCA (tumor) | BRCA (normal) |
| TEX14, CEP55 (tumor) | TEX14, CEP55 (normal) |
 |  |
| COAD (tumor) | COAD (normal) |
| TEX14, CEP55 (tumor) | TEX14, CEP55 (normal) |
 |  |
| HNSC (tumor) | HNSC (normal) |
| TEX14, CEP55 (tumor) | TEX14, CEP55 (normal) |
 |  |
| KICH (tumor) | KICH (normal) |
| TEX14, CEP55 (tumor) | TEX14, CEP55 (normal) |
 |  |
| KIRC (tumor) | KIRC (normal) |
| TEX14, CEP55 (tumor) | TEX14, CEP55 (normal) |
 |  |
| KIRP (tumor) | KIRP (normal) |
| TEX14, CEP55 (tumor) | TEX14, CEP55 (normal) |
 |  |
| LIHC (tumor) | LIHC (normal) |
| TEX14, CEP55 (tumor) | TEX14, CEP55 (normal) |
 |  |
| LUAD (tumor) | LUAD (normal) |
| TEX14, CEP55 (tumor) | TEX14, CEP55 (normal) |
 |  |
| LUSC (tumor) | LUSC (normal) |
| TEX14, CEP55 (tumor) | TEX14, CEP55 (normal) |
 |  |
| PRAD (tumor) | PRAD (normal) |
| TEX14, CEP55 (tumor) | TEX14, CEP55 (normal) |
 |  |
| STAD (tumor) | STAD (normal) |
| TEX14, CEP55 (tumor) | TEX14, CEP55 (normal) |
 |  |
| THCA (tumor) | THCA (normal) |
| TEX14, CEP55 (tumor) | TEX14, CEP55 (normal) |
 |  |
| Top |
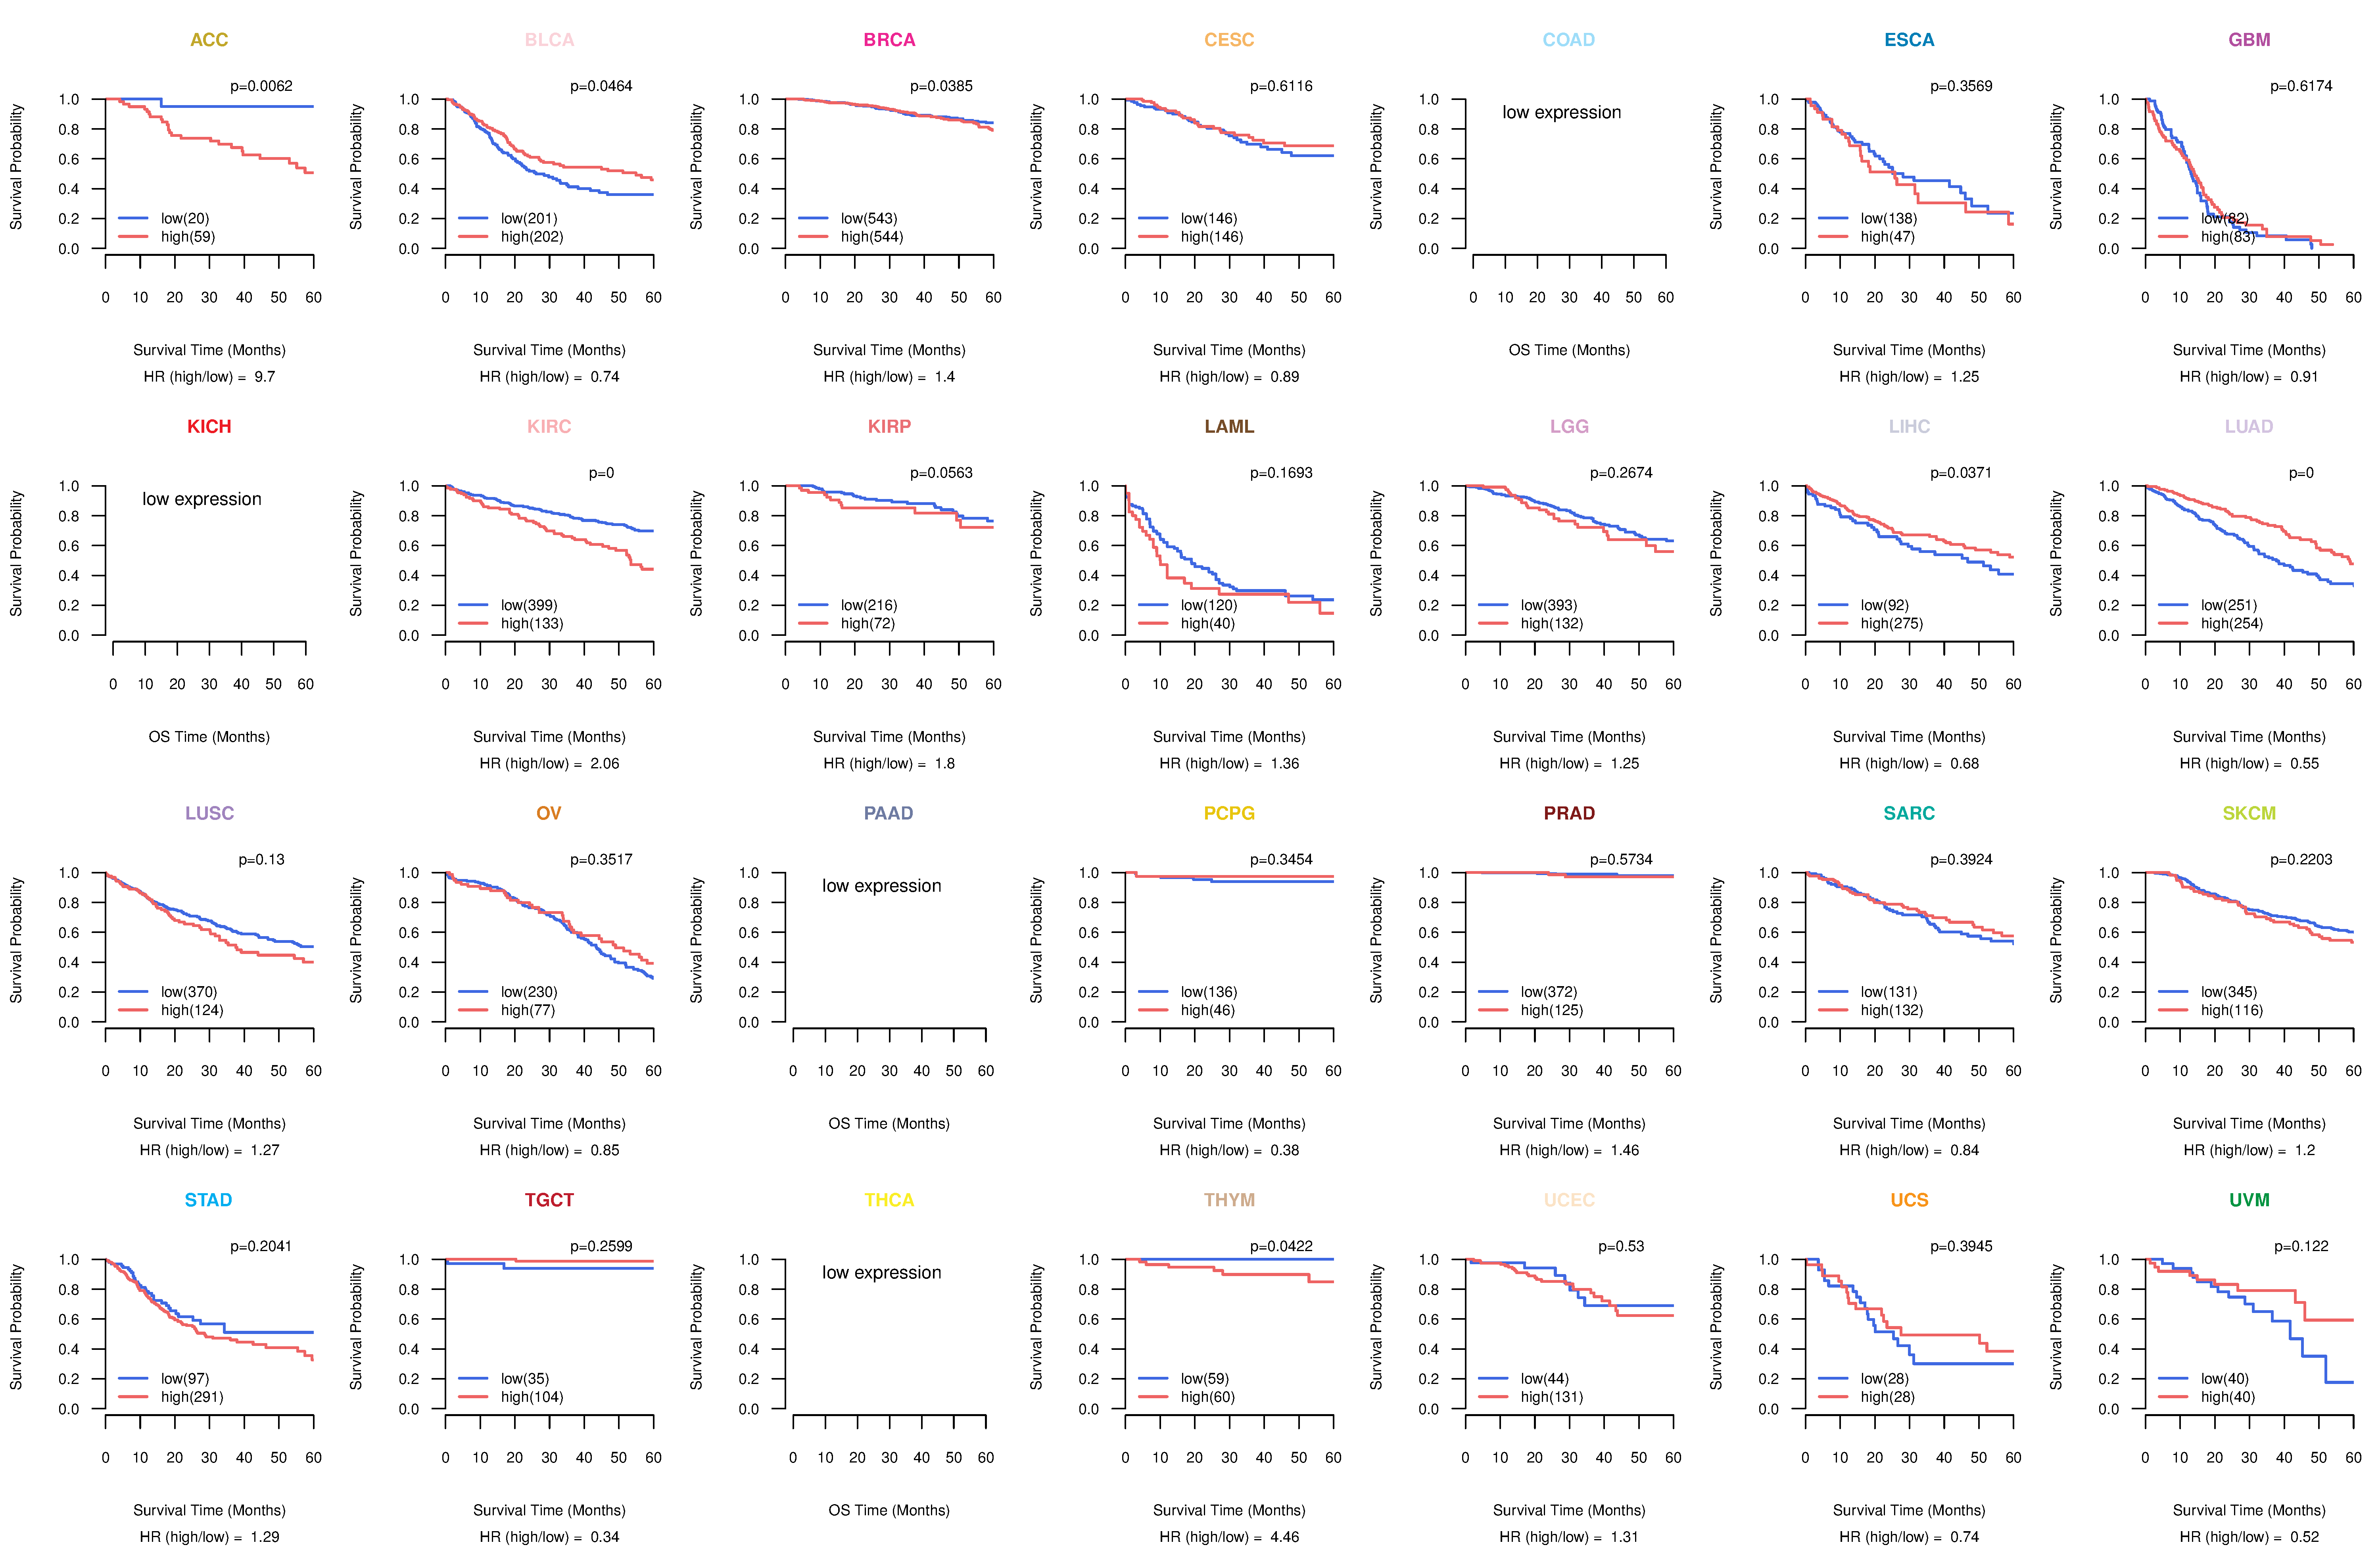
| TissGeneProg for TEX14 |
| Kaplan-Meier plots with logrank tests of overall survival (OS) using 28 cancer types (TCGA IlluminaHiSeq_RNASeqV2, pan-cancer normalized log2(norm_counts+1) data, version 2016-08-16) (TCGA clinicalMatrix, phenotype data, version 2016-04-27) * Click on the image to enlarge it in a new window. |
 |
| Kaplan-Meier plots with logrank test of relapse free survival (RFS) using 28 cancer types (TCGA IlluminaHiSeq_RNASeqV2, pan-cancer normalized log2(norm_counts+1) data, version 2016-08-16) (TCGA clinicalMatrix, phenotype data, version 2016-04-27) * Click on the image enlarge it in a new window. |
 |
| Forest plot of Cox proportional hazard ratio (HR) and 95% CI of overall survival (OS) using 28 cancer types (TCGA IlluminaHiSeq_RNASeqV2, pan-cancer normalized log2(norm_counts+1) data, version 2016-08-16) (TCGA clinicalMatrix, phenotype data, version 2016-04-27) * Click on the image enlarge it in a new window. |
 |
| Forest plot of Cox proportional hazard ratio (HR) and 95% CI of relapse free survival (RFS) using 28 cancer types (TCGA IlluminaHiSeq_RNASeqV2, pan-cancer normalized log2(norm_counts+1) data, version 2016-08-16) (TCGA clinicalMatrix, phenotype data, version 2016-04-27) * Click on the image enlarge it in a new window. |
 |
| Top |
| TissGeneClin for TEX14 |
| TissGeneDrug for TEX14 |
| Drug information targeting TissGene (DrugBank Version 5.0.6, 2017-04-01) |
| DrugBank ID | Drug name | Drug activity | Drug type | Drug status |
| Top |
| TissGeneDisease for TEX14 |
| Disease information associated with TissGene (DisGeNet, 2016-06-01) |
| Disease ID | Disease name | # pubmeds | Source |
| umls:C0004509 | Azoospermia | 1 | GAD |
| umls:C0006142 | Malignant neoplasm of breast | 1 | BeFree,GAD |
| umls:C0028960 | Oligospermia | 1 | GAD |
| umls:C0678222 | Breast Carcinoma | 1 | BeFree |
| umls:C1336708 | Testicular Germ Cell Tumor | 1 | BeFree |
|
Copyright 2016-Present - The University of Texas Health Science Center at Houston (UTHealth) Web File Viewing | How to Report, Fraud, Waste and Abuse | State of Texas | Statewide Search | Texas Homeland Security | Site Policies |