 |
| |
| |
| |
| |
| |
| |
|

| TissGeneSummary for TDRD1 |
 Gene summary Gene summary |
| Basic gene information | Gene symbol | TDRD1 |
| Gene name | tudor domain containing 1 | |
| Synonyms | CT41.1 | |
| Cytomap | UCSC genome browser: 10q25.3 | |
| Type of gene | protein-coding | |
| RefGenes | NM_198795.1, | |
| Description | cancer/testis antigen 41.1tudor domain containing protein 1tudor domain-containing protein 1 | |
| Modification date | 20141207 | |
| dbXrefs | MIM : 605796 | |
| HGNC : HGNC | ||
| Ensembl : ENSG00000095627 | ||
| HPRD : 12047 | ||
| Vega : OTTHUMG00000019083 | ||
| Protein | UniProt: go to UniProt's Cross Reference DB Table | |
| Expression | CleanEX: HS_TDRD1 | |
| BioGPS: 56165 | ||
| Pathway | NCI Pathway Interaction Database: TDRD1 | |
| KEGG: TDRD1 | ||
| REACTOME: TDRD1 | ||
| Pathway Commons: TDRD1 | ||
| Context | iHOP: TDRD1 | |
| ligand binding site mutation search in PubMed: TDRD1 | ||
| UCL Cancer Institute: TDRD1 | ||
| Assigned class in TissGDB* | C | |
| Included tissue-specific gene expression resources | HPA,GTExHPA,TiGER,GTEx | |
| Specific-tissues in normal samples (assigned by TissGDB using HPA, TiGER, and GTEx) | Testis | |
| Cancer types related to the specific-tissues in cancer samples (assigned by TissGDB using TCGA) | TGCT | |
| Reference showing the relevant tissue of TDRD1 | ||
| Description by TissGene annotations | ||
| * Class A consists of genes with literature evidence and is part of the cTissGenes. Class B consists of only cTissGenes without additional evidence. The remaining genes belong to Class C. |
| Gene ontology having evidence of Inferred from Direct Assay (IDA) from Entrez |
| GO ID | GO term | PubMed ID |
| Top |
| TissGeneExp for TDRD1 |
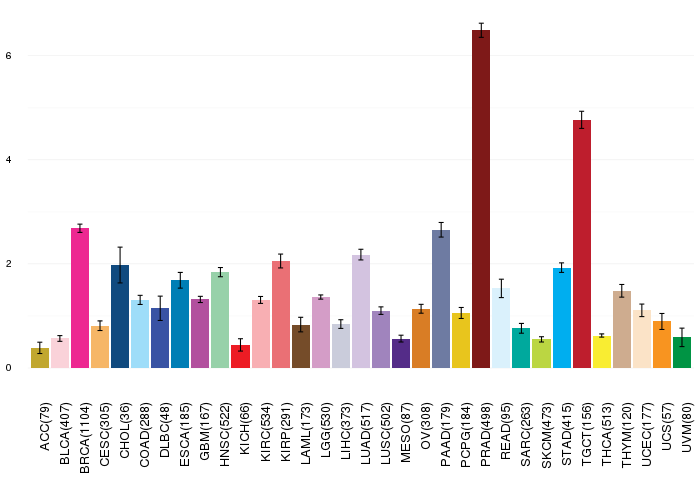
| Gene expressions across 28 cancer types (X-axis: cancer type and Y-axis: log2(norm_counts+1)) (TCGA IlluminaHiSeq_RNASeqV2, pan-cancer normalized log2(norm_counts+1) data, version 2016-08-16) |
 |
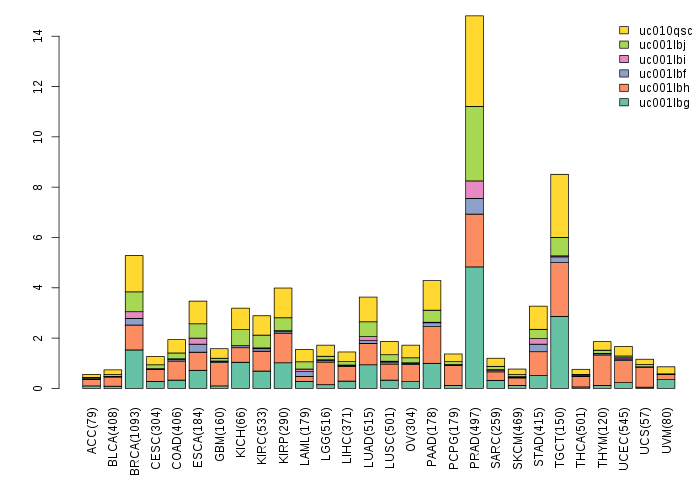
| Gene isoform expressions across 28 cancer types (X-axis: cancer type and Y-axis: log2(norm_counts+1)) (TCGA pan-cancer tcga_rsem_isoform_tpm, version 2016-09-01) |
 |
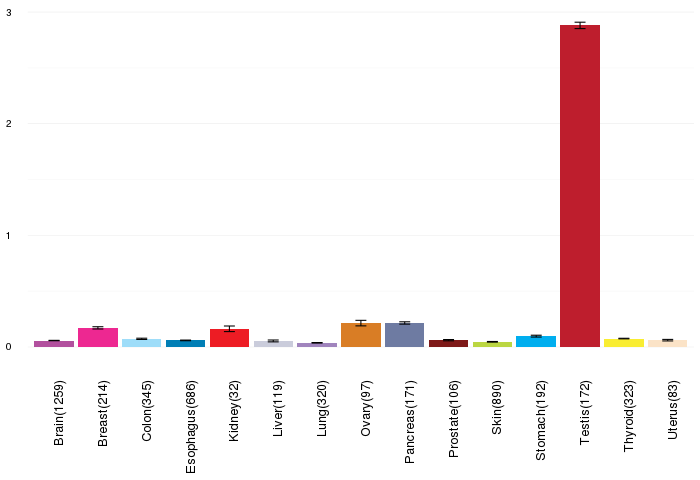
| Gene expressions across normal tissues of GTEx data (GTEx GTEx_Analysis_v6_RNA-seq_RNA-SeQCv1.1.8_gene_rpkm.gct) - Here, we shows the matched tissue types only among our 28 cancer types. |
 |
| Different expressions across 14 cancer types with more than 10 samples between matched tumors and normals (X-axis: cancer type and Y-axis: log2(norm_counts+1)) (TCGA IlluminaHiSeq_RNASeqV2, pan-cancer normalized log2(norm_counts+1) data, version 2016-08-16) |
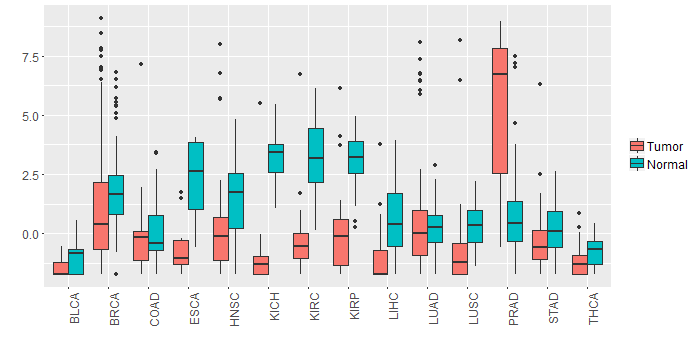 |
| - Significantly differentially expressed cancer types and information. (|Fold change|>1 and FDR<0.05) |
| Cancer type | Mean(exp) in tumor | Mean(exp) in matched normal | Log2FC | P-val. | FDR |
| KIRP | 0.022890588 | 3.122396838 | -3.09950625 | 7.74E-11 | 9.18E-10 |
| LIHC | -1.052824162 | 0.517231838 | -1.570056 | 2.36E-08 | 1.91E-07 |
| PRAD | 5.470966068 | 0.951127607 | 4.519838462 | 1.34E-14 | 1.43E-12 |
| KICH | -1.032900162 | 3.272523838 | -4.305424 | 5.27E-15 | 1.09E-13 |
| KIRC | -0.448439273 | 3.193788504 | -3.642227778 | 4.22E-34 | 1.05E-32 |
| HNSC | 0.359350907 | 1.494888117 | -1.135537209 | 0.0083 | 0.021101695 |
| ESCA | -0.575182708 | 2.261535474 | -2.836718182 | 0.000232 | 0.005732978 |
| LUSC | -0.678843849 | 0.343711053 | -1.022554902 | 0.000507 | 0.000985129 |
| Top |
| TissGene-miRNA for TDRD1 |
| Significantly anti-correlated miRNAs of TissGene across 28 cancer types (Gene-miRNA relations from TargetScanHuman Relsease 7.1, Conserved_Site_Context_Scores.txt.zip, 06.01.2016) (TCGA IlluminaHiSeq_miRNASeq, log2(RPM+1) data, version 2016-11-21) (TCGA IlluminaHiSeq_RNASeqV2, log2(normalized_count+1) data, version 2016-08-16) (Spearman’s Rank Correlation (p-value<0.05 and coefficient<-0.25)) |
| Cancer type | miRNA id | miRNA accession | P-val. | Coeff. | # samples |
| Top |
| TissGeneMut for TDRD1 |
| TissGeneSNV for TDRD1 |
| nsSNV counts per each loci. Different colors of circles represent different cancer types. Circle size denotes number of samples. (TCGA somatic mutation (SNPs and small INDELs) data, version 2016-04-25) * Click on the image to enlarge it in a new window. |
 |
 |
| Somatic nucleotide variants of TissGene across 28 cancer types (X-axis: cancer type and Y-axis: % of mutated samples) The numbers in parentheses are numbers of samples with mutation (nsSNVs). (TCGA somatic mutation (SNPs and small INDELs) data, version 2016-04-25) |
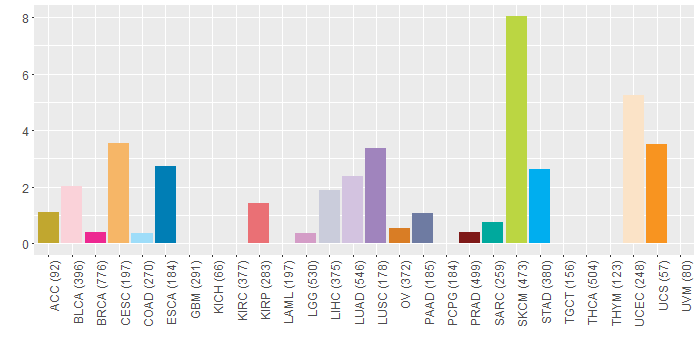 |
| - nsSNVs sorted by frequency. |
| AAchange | Cancer type | # samples |
| p.G101R | SKCM | 2 |
| p.R361K | SKCM | 2 |
| p.S526F | SKCM | 2 |
| p.P1049S | SKCM | 2 |
| p.M264I | SKCM | 1 |
| p.D310G | LIHC | 1 |
| p.E228K | LGG | 1 |
| p.E764D | UCEC | 1 |
| p.D713N | CESC | 1 |
| p.S178L | SKCM | 1 |
| p.T269M | UCEC | 1 |
| p.L1115R | LIHC | 1 |
| p.V239I | SARC | 1 |
| p.Q1129H | HNSC | 1 |
| p.Q340* | LUAD | 1 |
| p.K322N | STAD | 1 |
| p.G994R | SKCM | 1 |
| p.C625F | UCEC | 1 |
| p.W558* | LUAD | 1 |
| p.D799Y | HNSC | 1 |
| p.R172C | SKCM | 1 |
| p.D875N | SKCM | 1 |
| p.V381A | BRCA | 1 |
| p.W619* | HNSC | 1 |
| p.M1137T | LIHC | 1 |
| p.L161S | LIHC | 1 |
| p.V631A | STAD | 1 |
| p.M251I | BLCA | 1 |
| p.K628R | LUAD | 1 |
| p.D414N | SARC | 1 |
| p.L644F | LUAD | 1 |
| p.R812* | SKCM | 1 |
| p.P163L | STAD | 1 |
| p.T73S | LIHC | 1 |
| p.C625F | ESCA | 1 |
| p.E657D | LUAD | 1 |
| p.N52D | SKCM | 1 |
| p.S1087F | LUAD | 1 |
| p.I942V | ESCA | 1 |
| p.V281M | BLCA | 1 |
| p.A304G | LGG | 1 |
| p.A898V | UCEC | 1 |
| p.E59K | SKCM | 1 |
| p.Y445X | LIHC | 1 |
| p.E843* | UCS | 1 |
| p.E1105D | UCEC | 1 |
| p.M627I | SKCM | 1 |
| p.H660D | CESC | 1 |
| p.E242K | BLCA | 1 |
| p.R1009C | SKCM | 1 |
| p.E1031K | BLCA | 1 |
| p.P48S | SKCM | 1 |
| p.S926C | BRCA | 1 |
| p.K1102N | PRAD | 1 |
| p.T1181A | ACC | 1 |
| p.S648F | SKCM | 1 |
| p.G698E | SKCM | 1 |
| p.M1061I | SKCM | 1 |
| p.E217K | BLCA | 1 |
| p.V346A | ESCA | 1 |
| p.D939Y | UCS | 1 |
| p.M971L | LUAD | 1 |
| p.Q524* | LUAD | 1 |
| p.E843X | UCS | 1 |
| p.L1035F | SKCM | 1 |
| p.V700A | HNSC | 1 |
| p.S220* | UCEC | 1 |
| p.K794N | KIRP | 1 |
| p.A859P | OV | 1 |
| p.E1101D | LUSC | 1 |
| p.S149F | SKCM | 1 |
| p.E419V | KIRP | 1 |
| p.G766R | LUAD | 1 |
| p.A1025P | HNSC | 1 |
| p.A1112T | SKCM | 1 |
| p.L1046M | LGG | 1 |
| p.H918N | READ | 1 |
| p.T269M | STAD | 1 |
| p.M443I | STAD | 1 |
| p.P702L | SKCM | 1 |
| p.W707L | LUSC | 1 |
| p.E317K | SKCM | 1 |
| p.K225T | UCEC | 1 |
| p.Q824* | BLCA | 1 |
| p.Q72X | KIRP | 1 |
| p.D539Y | PAAD | 1 |
| p.R12I | UCEC | 1 |
| p.K740T | STAD | 1 |
| p.R827W | OV | 1 |
| p.Y445N | ESCA | 1 |
| p.N13H | UCEC | 1 |
| p.E301X | READ | 1 |
| p.A543V | SKCM | 1 |
| p.E948K | BLCA | 1 |
| p.D1113H | CESC | 1 |
| p.L668I | CESC | 1 |
| p.T1166I | SKCM | 1 |
| p.V917A | STAD | 1 |
| p.E426* | UCEC | 1 |
| p.W619* | SKCM | 1 |
| p.E16K | CESC | 1 |
| p.R1139G | LUAD | 1 |
| p.L1046P | LIHC | 1 |
| p.R781C | SKCM | 1 |
| p.G1014E | CESC | 1 |
| p.T658M | UCEC | 1 |
| p.L440F | UCEC | 1 |
| p.E967K | SKCM | 1 |
| p.P485L | SKCM | 1 |
| p.E118K | LUAD | 1 |
| p.E935* | UCEC | 1 |
| p.S1068C | BRCA | 1 |
| p.R1054I | COAD | 1 |
| p.R992T | LUAD | 1 |
| p.G352E | SKCM | 1 |
| p.V281L | LUAD | 1 |
| p.Y576H | PRAD | 1 |
| p.G801E | SKCM | 1 |
| p.F510C | READ | 1 |
| p.A604V | STAD | 1 |
| p.P130L | UCEC | 1 |
| p.F1050L | SKCM | 1 |
| p.V680A | UCEC | 1 |
| p.G389R | KIRP | 1 |
| p.G101R | LUSC | 1 |
| p.F273C | LUSC | 1 |
| p.W619X | SKCM | 1 |
| p.E217K | SKCM | 1 |
| p.R860T | BLCA | 1 |
| p.N49T | READ | 1 |
| p.G575R | HNSC | 1 |
| p.L585F | SKCM | 1 |
| p.R361I | UCEC | 1 |
| p.V938A | STAD | 1 |
| p.F1078C | ESCA | 1 |
| p.G617E | SKCM | 1 |
| p.D546N | SKCM | 1 |
| p.S1183A | SKCM | 1 |
| p.E29Q | CESC | 1 |
| p.G580E | SKCM | 1 |
| p.A201S | LUSC | 1 |
| p.R1037K | HNSC | 1 |
| p.D466Y | PAAD | 1 |
| p.A1047V | READ | 1 |
| p.K740N | READ | 1 |
| p.Q849H | LUSC | 1 |
| p.G675R | SKCM | 1 |
| p.E786K | SKCM | 1 |
| p.F509L | READ | 1 |
| p.D539N | HNSC | 1 |
| p.K740N | UCEC | 1 |
| p.D539Y | STAD | 1 |
| p.V478I | UCEC | 1 |
| p.E457K | SKCM | 1 |
| p.E308K | SKCM | 1 |
| p.E428K | SKCM | 1 |
| Top |
| TissGeneCNV for TDRD1 |
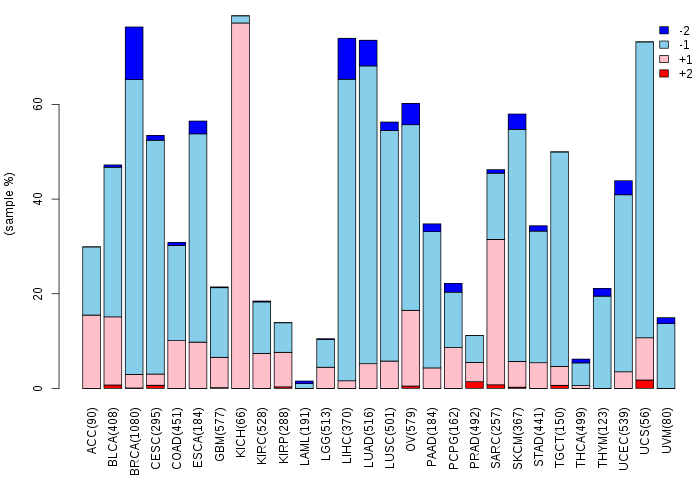
| Copy number variations of TissGene across 28 cancer types (X-axis: cancer type and Y-axis: % of CNV samples) (TCGA Gistic2_CopyNumber_Gistic2_all_data_by_genes, Gistic2 copy number data, version 2016-08-16) |
 |
| Top |
| TissGeneFusions for TDRD1 |
| Fusion genes including TissGene (ChimerDB 3.0, 2016-12-01 and TCGA fusion Portal 2015-12-01) |
| Database | Src | Cancer type | Sample | Fusion gene | ORF | 5'-gene BP | 3'-gene BP |
| Top |
| TissGeneNet for TDRD1 |
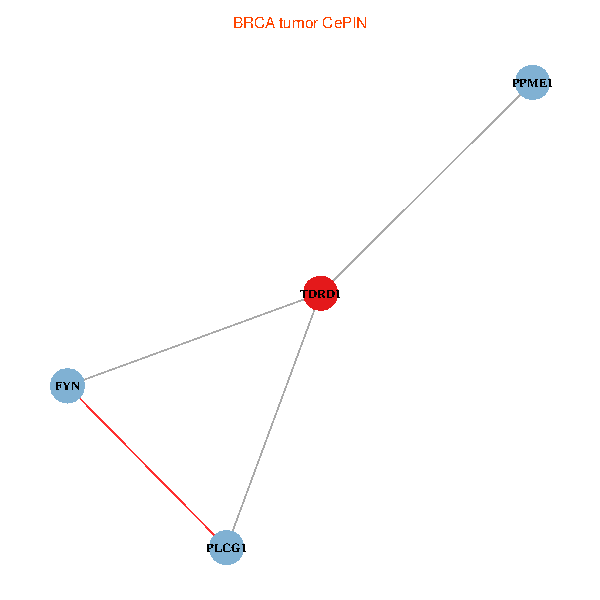
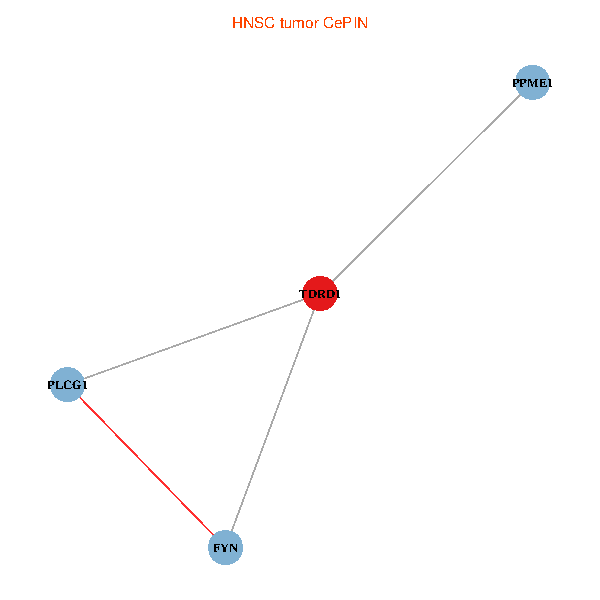
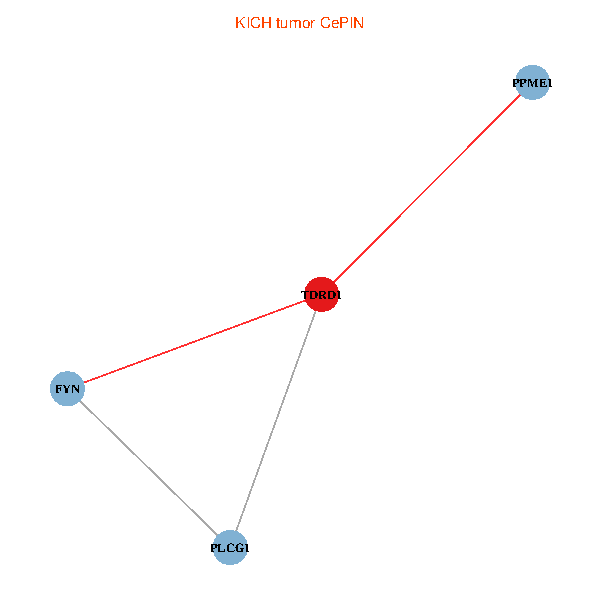
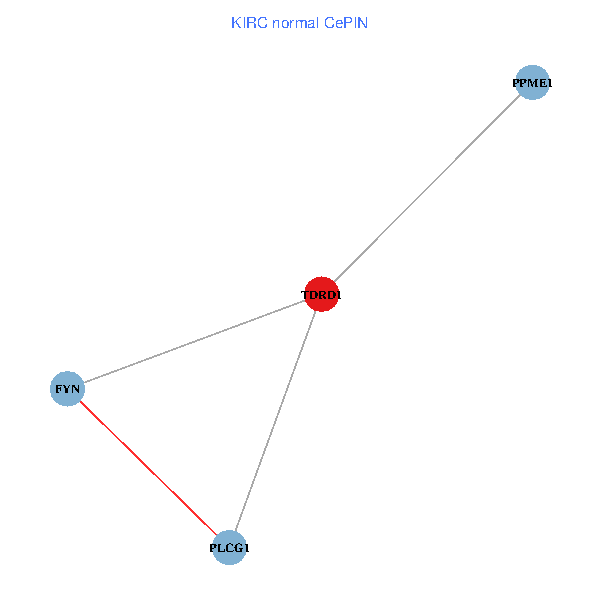
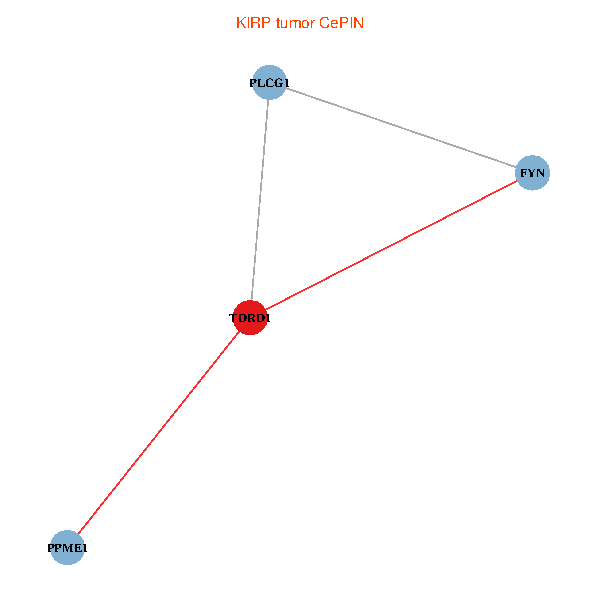
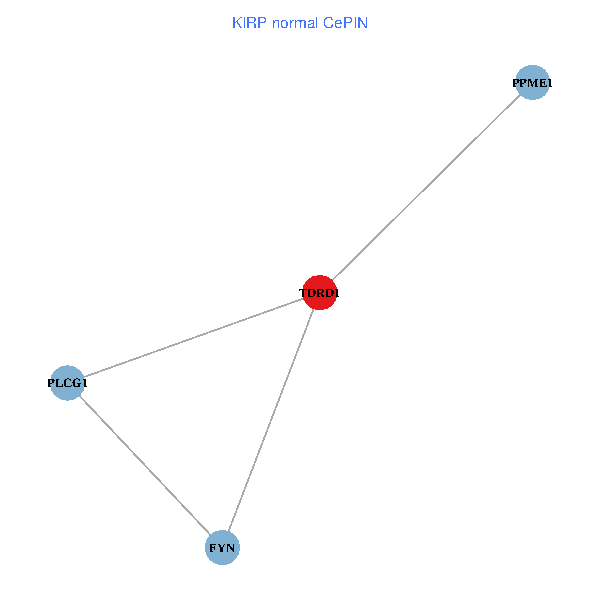
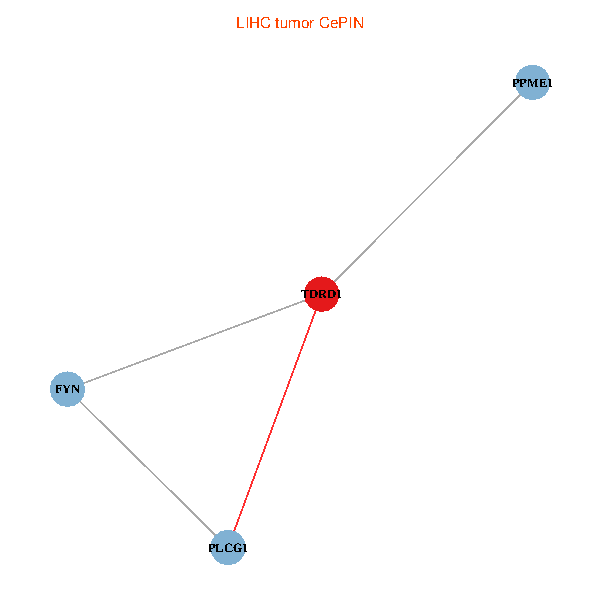
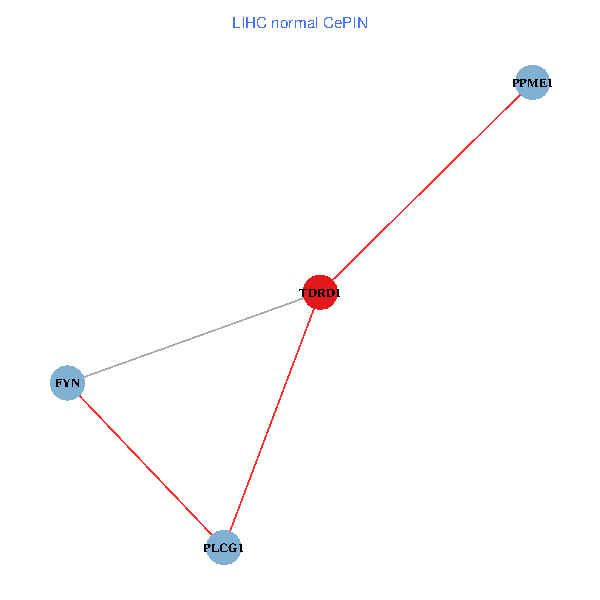
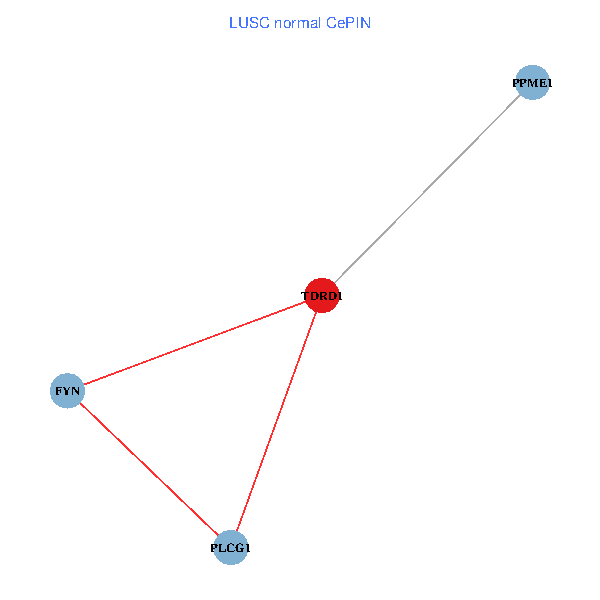
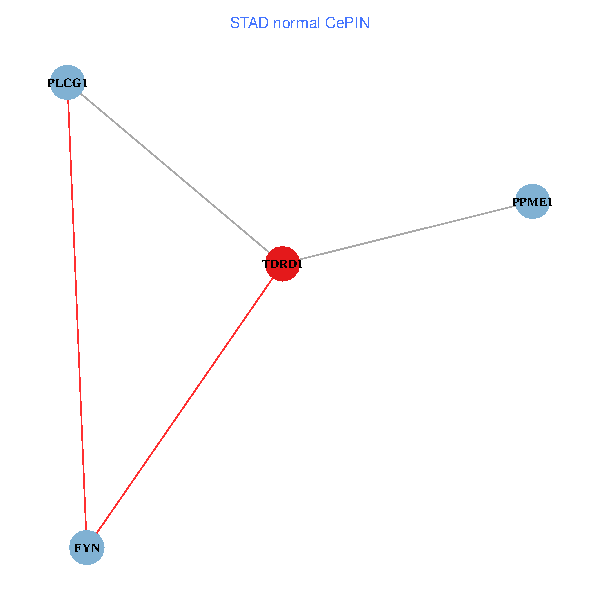
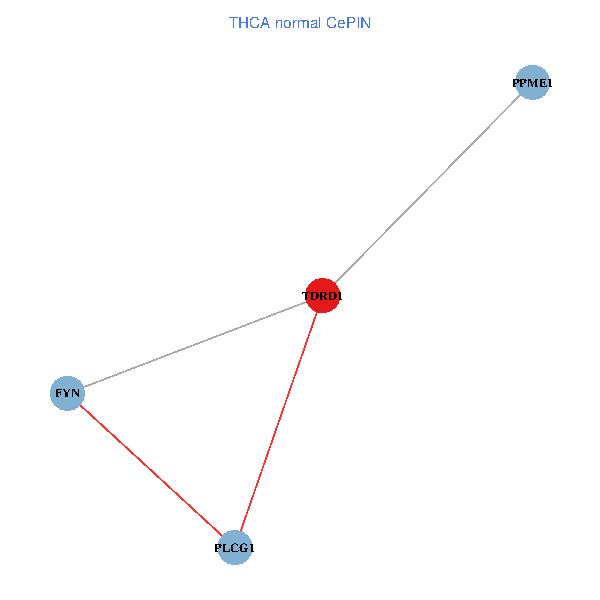
| Co-expressed gene networks based on protein-protein interaction data (CePIN) (TCGA IlluminaHiSeq_RNASeqV2, pan-cancer normalized log2(norm_counts+1) data, version 2016-08-16) (PINA2 ppi data) |
| BRCA (tumor) | BRCA (normal) |
| TDRD1, PLCG1, FYN, PPME1 (tumor) | TDRD1, PLCG1, FYN, PPME1 (normal) |
 |  |
| COAD (tumor) | COAD (normal) |
| TDRD1, PLCG1, FYN, PPME1 (tumor) | TDRD1, PLCG1, FYN, PPME1 (normal) |
 |  |
| HNSC (tumor) | HNSC (normal) |
| TDRD1, PLCG1, FYN, PPME1 (tumor) | TDRD1, PLCG1, FYN, PPME1 (normal) |
 |  |
| KICH (tumor) | KICH (normal) |
| TDRD1, PLCG1, FYN, PPME1 (tumor) | TDRD1, PLCG1, FYN, PPME1 (normal) |
 |  |
| KIRC (tumor) | KIRC (normal) |
| TDRD1, PLCG1, FYN, PPME1 (tumor) | TDRD1, PLCG1, FYN, PPME1 (normal) |
 |  |
| KIRP (tumor) | KIRP (normal) |
| TDRD1, PLCG1, FYN, PPME1 (tumor) | TDRD1, PLCG1, FYN, PPME1 (normal) |
 |  |
| LIHC (tumor) | LIHC (normal) |
| TDRD1, PLCG1, FYN, PPME1 (tumor) | TDRD1, PLCG1, FYN, PPME1 (normal) |
 |  |
| LUAD (tumor) | LUAD (normal) |
| TDRD1, PLCG1, FYN, PPME1 (tumor) | TDRD1, PLCG1, FYN, PPME1 (normal) |
 |  |
| LUSC (tumor) | LUSC (normal) |
| TDRD1, PLCG1, FYN, PPME1 (tumor) | TDRD1, PLCG1, FYN, PPME1 (normal) |
 |  |
| PRAD (tumor) | PRAD (normal) |
| TDRD1, PLCG1, FYN, PPME1 (tumor) | TDRD1, PLCG1, FYN, PPME1 (normal) |
 |  |
| STAD (tumor) | STAD (normal) |
| TDRD1, PLCG1, FYN, PPME1 (tumor) | TDRD1, PLCG1, FYN, PPME1 (normal) |
 |  |
| THCA (tumor) | THCA (normal) |
| TDRD1, PLCG1, FYN, PPME1 (tumor) | TDRD1, PLCG1, FYN, PPME1 (normal) |
 |  |
| Top |
| TissGeneProg for TDRD1 |
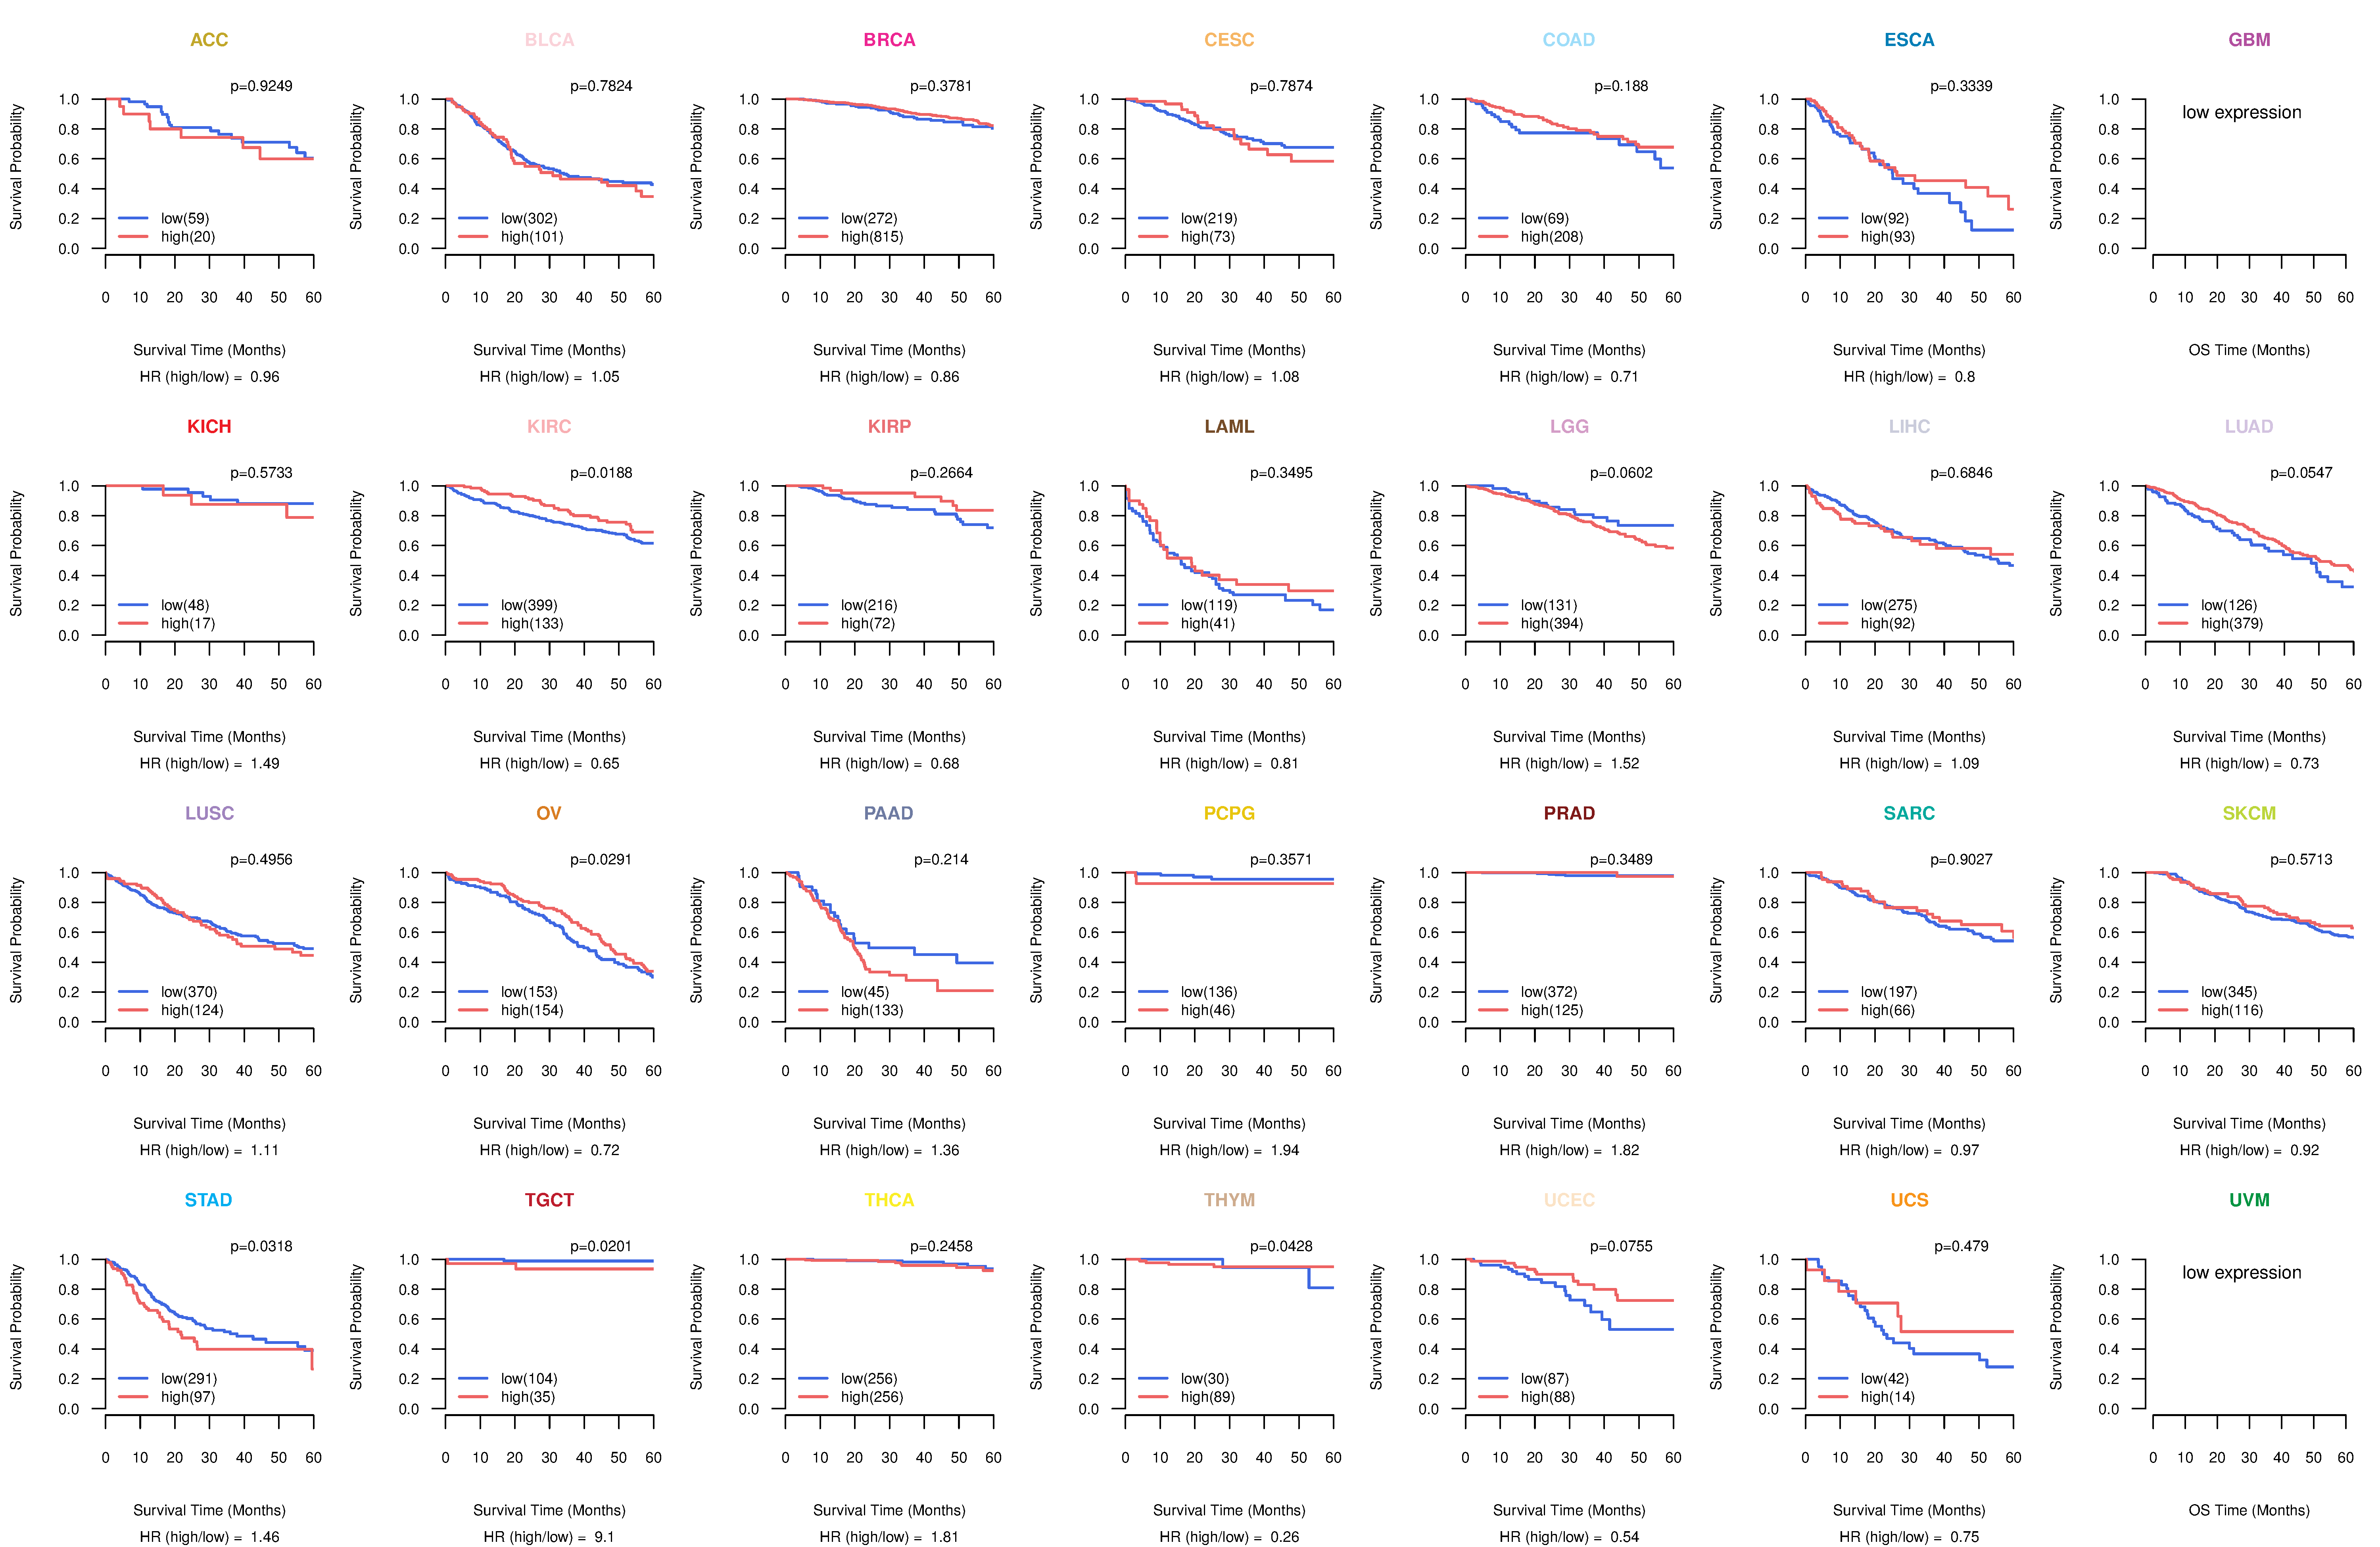
| Kaplan-Meier plots with logrank tests of overall survival (OS) using 28 cancer types (TCGA IlluminaHiSeq_RNASeqV2, pan-cancer normalized log2(norm_counts+1) data, version 2016-08-16) (TCGA clinicalMatrix, phenotype data, version 2016-04-27) * Click on the image to enlarge it in a new window. |
 |
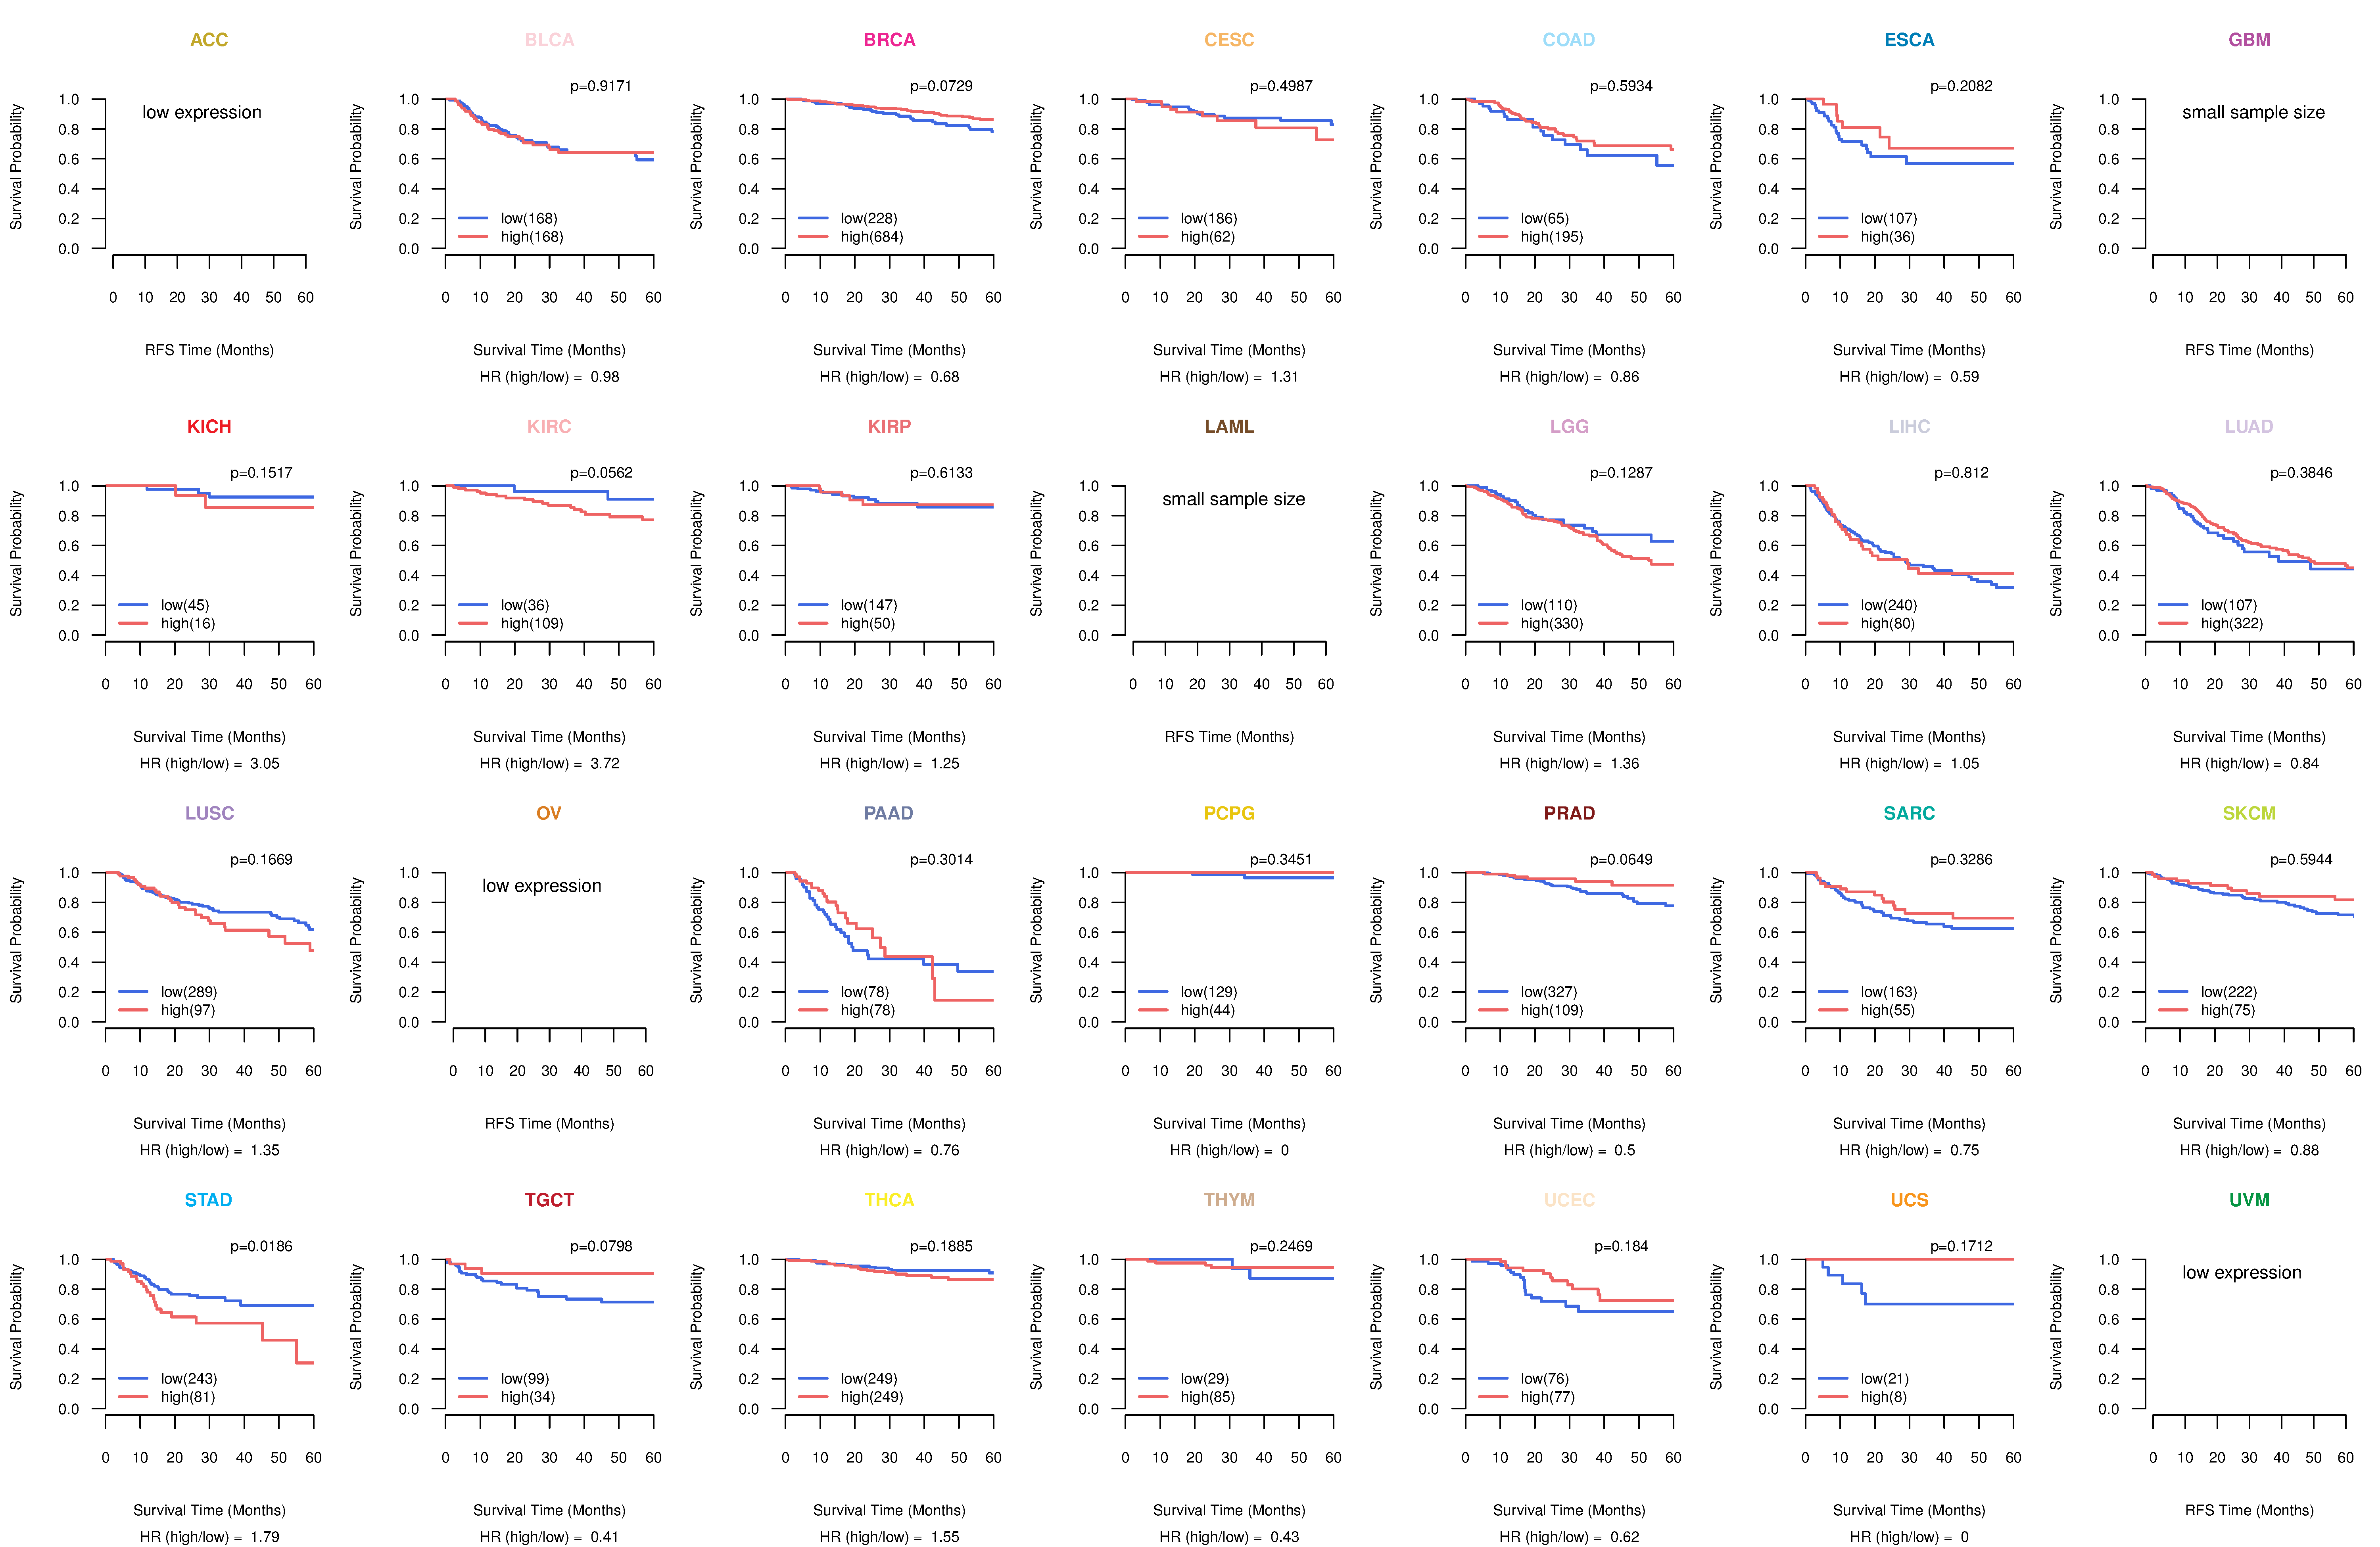
| Kaplan-Meier plots with logrank test of relapse free survival (RFS) using 28 cancer types (TCGA IlluminaHiSeq_RNASeqV2, pan-cancer normalized log2(norm_counts+1) data, version 2016-08-16) (TCGA clinicalMatrix, phenotype data, version 2016-04-27) * Click on the image enlarge it in a new window. |
 |
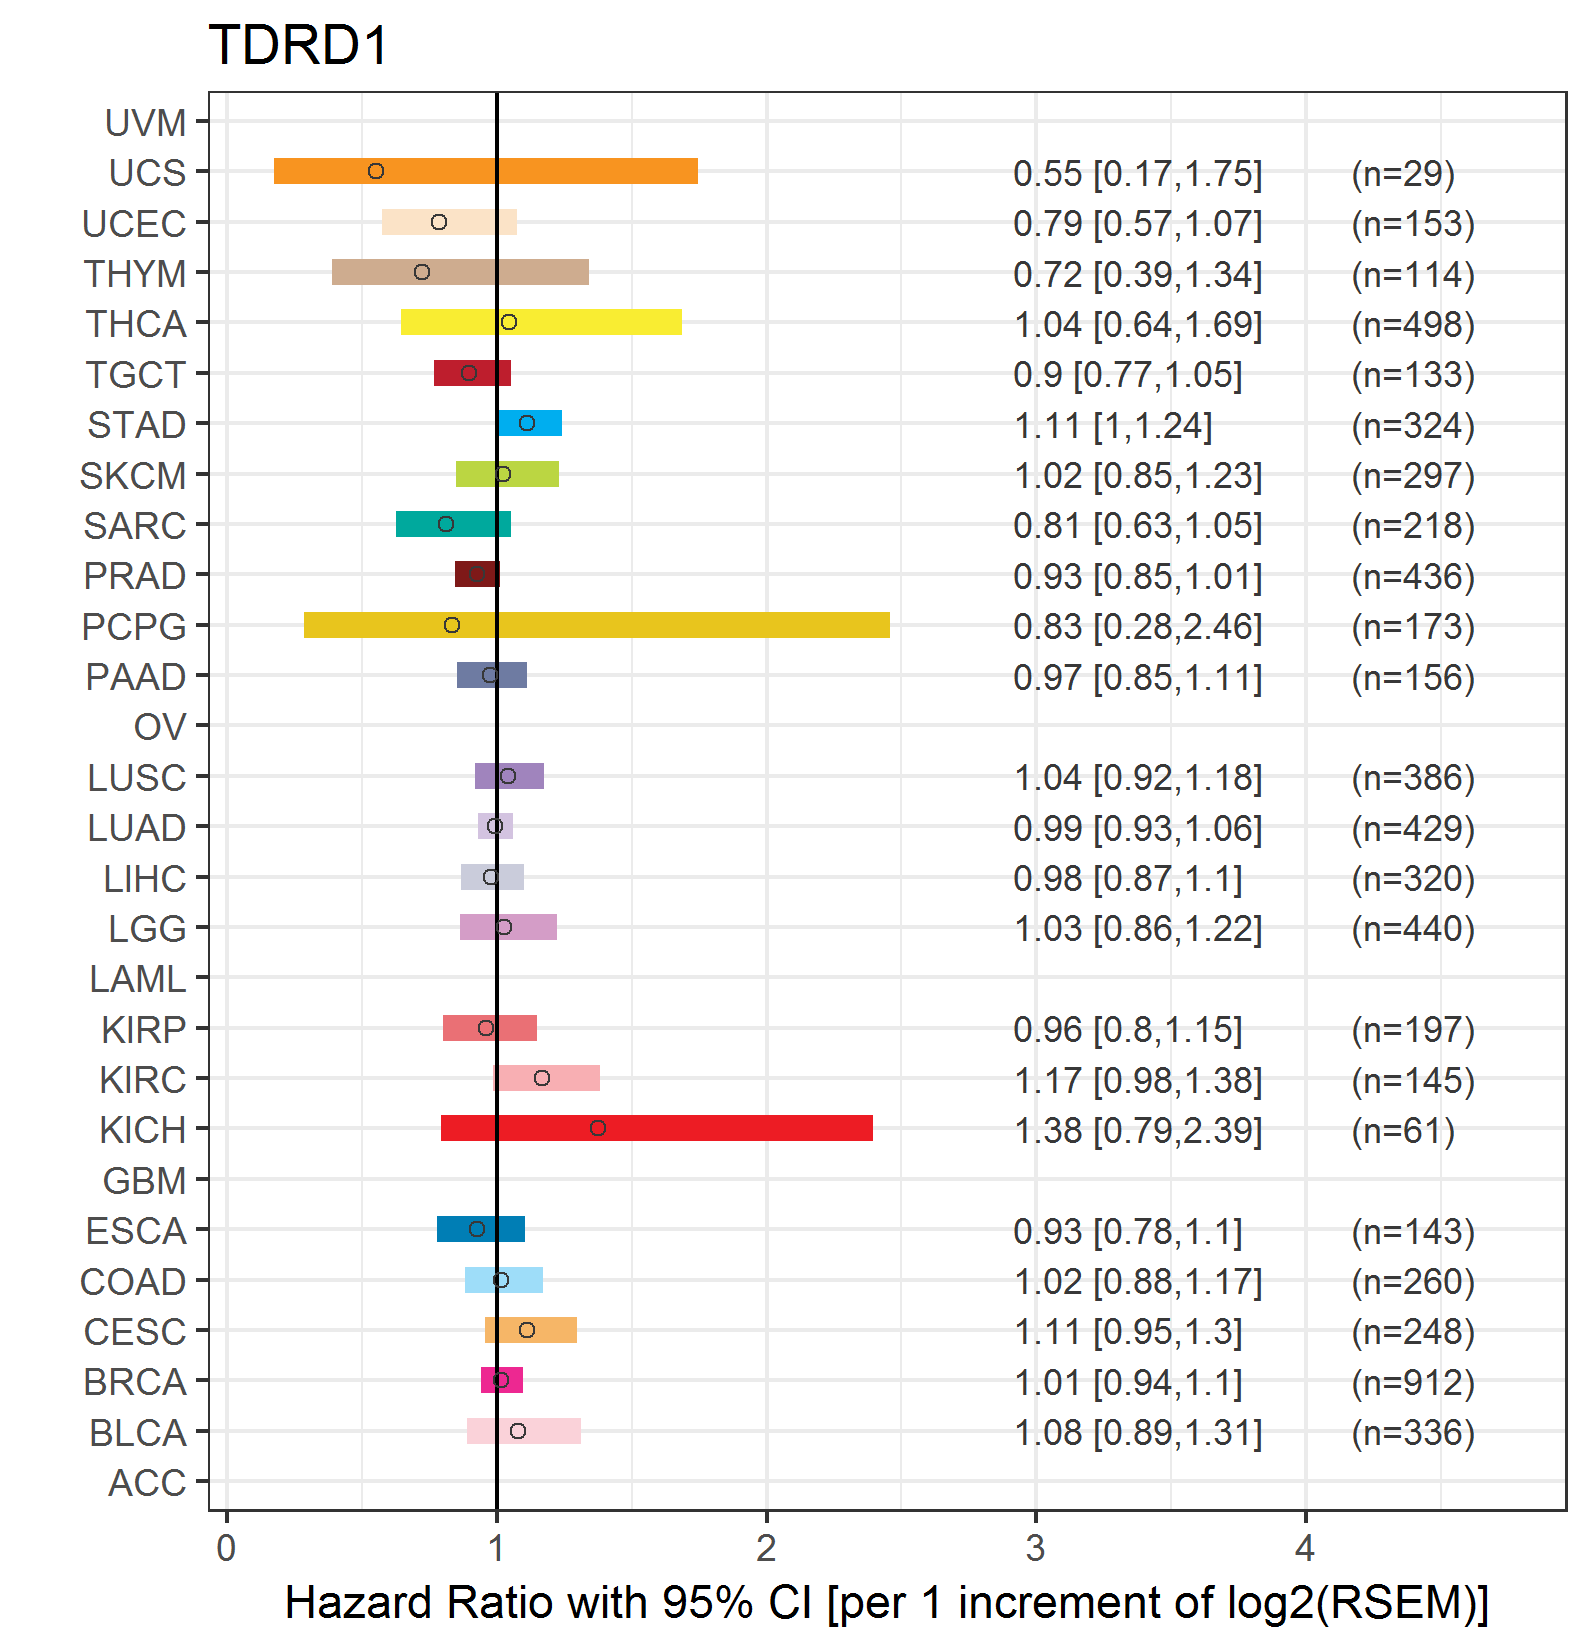
| Forest plot of Cox proportional hazard ratio (HR) and 95% CI of overall survival (OS) using 28 cancer types (TCGA IlluminaHiSeq_RNASeqV2, pan-cancer normalized log2(norm_counts+1) data, version 2016-08-16) (TCGA clinicalMatrix, phenotype data, version 2016-04-27) * Click on the image enlarge it in a new window. |
 |
| Forest plot of Cox proportional hazard ratio (HR) and 95% CI of relapse free survival (RFS) using 28 cancer types (TCGA IlluminaHiSeq_RNASeqV2, pan-cancer normalized log2(norm_counts+1) data, version 2016-08-16) (TCGA clinicalMatrix, phenotype data, version 2016-04-27) * Click on the image enlarge it in a new window. |
 |
| Top |
| TissGeneClin for TDRD1 |
| TissGeneDrug for TDRD1 |
| Drug information targeting TissGene (DrugBank Version 5.0.6, 2017-04-01) |
| DrugBank ID | Drug name | Drug activity | Drug type | Drug status |
| Top |
| TissGeneDisease for TDRD1 |
| Disease information associated with TissGene (DisGeNet, 2016-06-01) |
| Disease ID | Disease name | # pubmeds | Source |
| umls:C0376358 | Malignant neoplasm of prostate | 3 | BeFree |
| umls:C0600139 | Prostate carcinoma | 3 | BeFree |
| umls:C0021364 | Male infertility | 1 | BeFree |
| umls:C0033578 | Prostatic Neoplasms | 1 | BeFree |
| umls:C1704272 | Benign Prostatic Hyperplasia | 1 | BeFree |
|
Copyright 2016-Present - The University of Texas Health Science Center at Houston (UTHealth) Web File Viewing | How to Report, Fraud, Waste and Abuse | State of Texas | Statewide Search | Texas Homeland Security | Site Policies |