 |
| |
| |
| |
| |
| |
| |
|

| TissGeneSummary for TSKS |
 Gene summary Gene summary |
| Basic gene information | Gene symbol | TSKS |
| Gene name | testis-specific serine kinase substrate | |
| Synonyms | PPP1R161|STK22S1|TSKS1|TSSKS | |
| Cytomap | UCSC genome browser: 19q13.3 | |
| Type of gene | protein-coding | |
| RefGenes | NM_021733.1, | |
| Description | STK22 substrate 1protein phosphatase 1, regulatory subunit 161testis specific serine/threonine kinase substratetestis-specific kinase substrate | |
| Modification date | 20141207 | |
| dbXrefs | MIM : 608253 | |
| HGNC : HGNC | ||
| Ensembl : ENSG00000126467 | ||
| HPRD : 09748 | ||
| Vega : OTTHUMG00000183249 | ||
| Protein | UniProt: go to UniProt's Cross Reference DB Table | |
| Expression | CleanEX: HS_TSKS | |
| BioGPS: 60385 | ||
| Pathway | NCI Pathway Interaction Database: TSKS | |
| KEGG: TSKS | ||
| REACTOME: TSKS | ||
| Pathway Commons: TSKS | ||
| Context | iHOP: TSKS | |
| ligand binding site mutation search in PubMed: TSKS | ||
| UCL Cancer Institute: TSKS | ||
| Assigned class in TissGDB* | C | |
| Included tissue-specific gene expression resources | HPA,GTEx | |
| Specific-tissues in normal samples (assigned by TissGDB using HPA, TiGER, and GTEx) | Testis | |
| Cancer types related to the specific-tissues in cancer samples (assigned by TissGDB using TCGA) | TGCT | |
| Reference showing the relevant tissue of TSKS | ||
| Description by TissGene annotations | Cancer gene | |
| * Class A consists of genes with literature evidence and is part of the cTissGenes. Class B consists of only cTissGenes without additional evidence. The remaining genes belong to Class C. |
| Gene ontology having evidence of Inferred from Direct Assay (IDA) from Entrez |
| GO ID | GO term | PubMed ID | GO:0010923 | negative regulation of phosphatase activity | 19389623 | GO:0010923 | negative regulation of phosphatase activity | 19389623 |
| Top |
| TissGeneExp for TSKS |
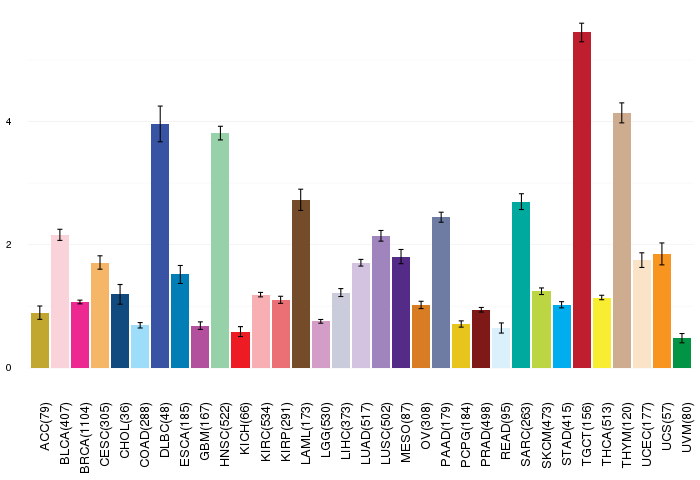
| Gene expressions across 28 cancer types (X-axis: cancer type and Y-axis: log2(norm_counts+1)) (TCGA IlluminaHiSeq_RNASeqV2, pan-cancer normalized log2(norm_counts+1) data, version 2016-08-16) |
 |
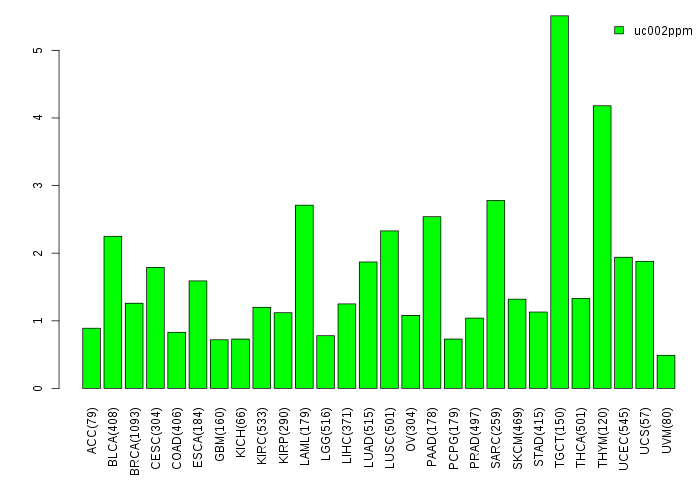
| Gene isoform expressions across 28 cancer types (X-axis: cancer type and Y-axis: log2(norm_counts+1)) (TCGA pan-cancer tcga_rsem_isoform_tpm, version 2016-09-01) |
 |
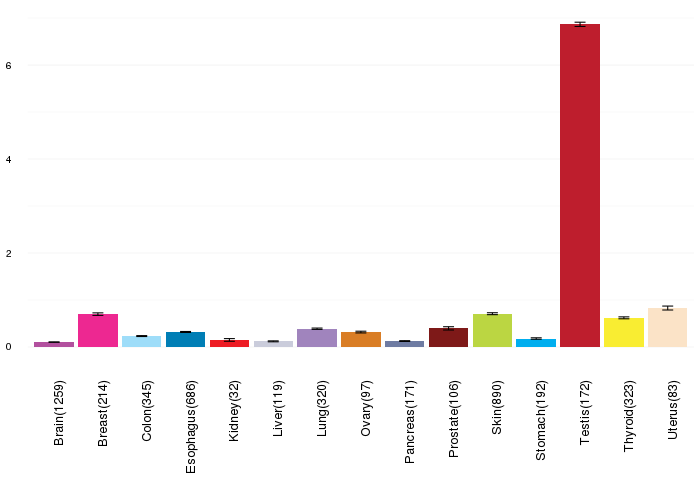
| Gene expressions across normal tissues of GTEx data (GTEx GTEx_Analysis_v6_RNA-seq_RNA-SeQCv1.1.8_gene_rpkm.gct) - Here, we shows the matched tissue types only among our 28 cancer types. |
 |
| Different expressions across 14 cancer types with more than 10 samples between matched tumors and normals (X-axis: cancer type and Y-axis: log2(norm_counts+1)) (TCGA IlluminaHiSeq_RNASeqV2, pan-cancer normalized log2(norm_counts+1) data, version 2016-08-16) |
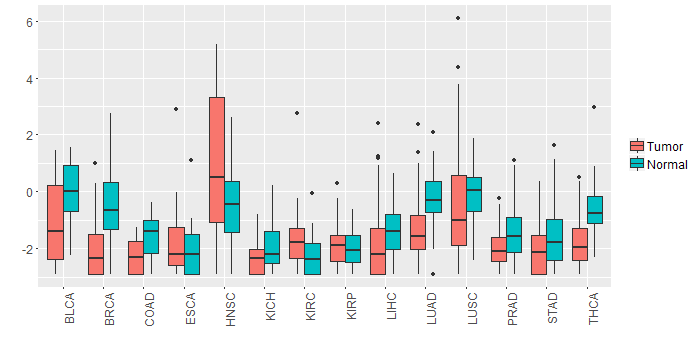 |
| - Significantly differentially expressed cancer types and information. (|Fold change|>1 and FDR<0.05) |
| Cancer type | Mean(exp) in tumor | Mean(exp) in matched normal | Log2FC | P-val. | FDR |
| BRCA | -2.051030031 | -0.479970382 | -1.571059649 | 1.01E-23 | 9.25E-23 |
| LUAD | -1.361094338 | -0.235427097 | -1.125667241 | 4.75E-08 | 1.94E-07 |
| THCA | -1.7626285 | -0.623665788 | -1.138962712 | 2.28E-10 | 1.44E-09 |
| HNSC | 0.959736656 | -0.397979623 | 1.357716279 | 0.00289 | 0.008511126 |
| Top |
| TissGene-miRNA for TSKS |
| Significantly anti-correlated miRNAs of TissGene across 28 cancer types (Gene-miRNA relations from TargetScanHuman Relsease 7.1, Conserved_Site_Context_Scores.txt.zip, 06.01.2016) (TCGA IlluminaHiSeq_miRNASeq, log2(RPM+1) data, version 2016-11-21) (TCGA IlluminaHiSeq_RNASeqV2, log2(normalized_count+1) data, version 2016-08-16) (Spearman’s Rank Correlation (p-value<0.05 and coefficient<-0.25)) |
| Cancer type | miRNA id | miRNA accession | P-val. | Coeff. | # samples |
| Top |
| TissGeneMut for TSKS |
| TissGeneSNV for TSKS |
| nsSNV counts per each loci. Different colors of circles represent different cancer types. Circle size denotes number of samples. (TCGA somatic mutation (SNPs and small INDELs) data, version 2016-04-25) * Click on the image to enlarge it in a new window. |
 |
 |
| Somatic nucleotide variants of TissGene across 28 cancer types (X-axis: cancer type and Y-axis: % of mutated samples) The numbers in parentheses are numbers of samples with mutation (nsSNVs). (TCGA somatic mutation (SNPs and small INDELs) data, version 2016-04-25) |
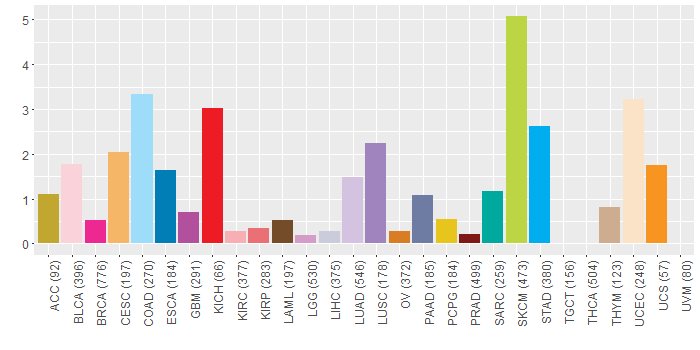 |
| - nsSNVs sorted by frequency. |
| AAchange | Cancer type | # samples |
| p.R443W | SKCM | 3 |
| p.E257K | COAD | 3 |
| p.E152K | SKCM | 3 |
| p.E513K | BLCA | 2 |
| p.E257K | KICH | 2 |
| p.S272G | COAD | 2 |
| p.W303* | SKCM | 2 |
| p.S454R | ESCA | 1 |
| p.D145Y | STAD | 1 |
| p.A18V | SKCM | 1 |
| p.T8M | STAD | 1 |
| p.R443L | BLCA | 1 |
| p.E257K | PCPG | 1 |
| p.A43V | BLCA | 1 |
| p.G425R | UCEC | 1 |
| p.Q429* | SKCM | 1 |
| p.R340Q | SKCM | 1 |
| p.E422Q | HNSC | 1 |
| p.L564M | ESCA | 1 |
| p.D20N | HNSC | 1 |
| p.L499M | READ | 1 |
| p.Q280H | LUAD | 1 |
| p.G413R | SKCM | 1 |
| p.R142H | COAD | 1 |
| p.E221K | SKCM | 1 |
| p.E257K | BRCA | 1 |
| p.S27R | BRCA | 1 |
| p.G576C | UCEC | 1 |
| p.P582T | READ | 1 |
| p.G364S | DLBC | 1 |
| p.W270* | CESC | 1 |
| p.R156L | SARC | 1 |
| p.V479A | UCEC | 1 |
| p.G326S | STAD | 1 |
| p.R432Q | SKCM | 1 |
| p.M544T | PAAD | 1 |
| p.E265K | CESC | 1 |
| p.R38K | SKCM | 1 |
| p.G415V | STAD | 1 |
| p.R374C | ESCA | 1 |
| p.S169F | BRCA | 1 |
| p.G575V | BLCA | 1 |
| p.R426Q | MESO | 1 |
| p.P283L | SKCM | 1 |
| p.G571E | LUSC | 1 |
| p.R156Q | COAD | 1 |
| p.E204K | SKCM | 1 |
| p.G45R | SARC | 1 |
| p.Q262E | LUAD | 1 |
| p.P295S | PAAD | 1 |
| p.E247D | STAD | 1 |
| p.V161M | UCEC | 1 |
| p.R470* | PRAD | 1 |
| p.L468Q | LUAD | 1 |
| p.R503C | LAML | 1 |
| p.E14Q | HNSC | 1 |
| p.E525K | CESC | 1 |
| p.S29F | KIRC | 1 |
| p.Q492H | BLCA | 1 |
| p.S279F | ACC | 1 |
| p.E410K | SKCM | 1 |
| p.G304R | SKCM | 1 |
| p.G456E | SKCM | 1 |
| p.P124L | STAD | 1 |
| p.C196Y | STAD | 1 |
| p.T101A | SKCM | 1 |
| p.G360S | COAD | 1 |
| p.K497N | BLCA | 1 |
| p.Q429X | SKCM | 1 |
| p.E423Q | HNSC | 1 |
| p.G483D | BRCA | 1 |
| p.R42Q | STAD | 1 |
| p.R308Q | SKCM | 1 |
| p.S106N | COAD | 1 |
| p.E259Q | CESC | 1 |
| p.R389W | SKCM | 1 |
| p.G312S | SKCM | 1 |
| p.D363N | SKCM | 1 |
| p.R374G | LUSC | 1 |
| p.P124S | SKCM | 1 |
| p.R237* | HNSC | 1 |
| p.D20N | CESC | 1 |
| p.R493M | LUAD | 1 |
| p.R237X | LIHC | 1 |
| p.R201L | LUAD | 1 |
| p.G415C | HNSC | 1 |
| p.L227F | SKCM | 1 |
| p.Q429H | SARC | 1 |
| p.E248K | SKCM | 1 |
| p.M90I | OV | 1 |
| p.S272N | UCEC | 1 |
| p.S400L | HNSC | 1 |
| p.R142H | DLBC | 1 |
| p.E260* | LUAD | 1 |
| p.R503C | UCEC | 1 |
| p.A487T | UCEC | 1 |
| p.R433I | LUAD | 1 |
| p.V510I | STAD | 1 |
| p.M1I | LUSC | 1 |
| p.E410K | UCEC | 1 |
| p.E525K | BLCA | 1 |
| p.R528W | PAAD | 1 |
| p.E412G | LGG | 1 |
| p.K144R | UCS | 1 |
| p.H551Q | KIRP | 1 |
| p.S272G | READ | 1 |
| p.G187E | GBM | 1 |
| p.A2E | LUAD | 1 |
| p.R37Q | THYM | 1 |
| p.E410K | LUSC | 1 |
| p.R38M | STAD | 1 |
| p.R340W | SKCM | 1 |
| p.T570M | GBM | 1 |
| p.Y188* | LUAD | 1 |
| p.R238Q | CESC | 1 |
| p.E345K | SKCM | 1 |
| Top |
| TissGeneCNV for TSKS |
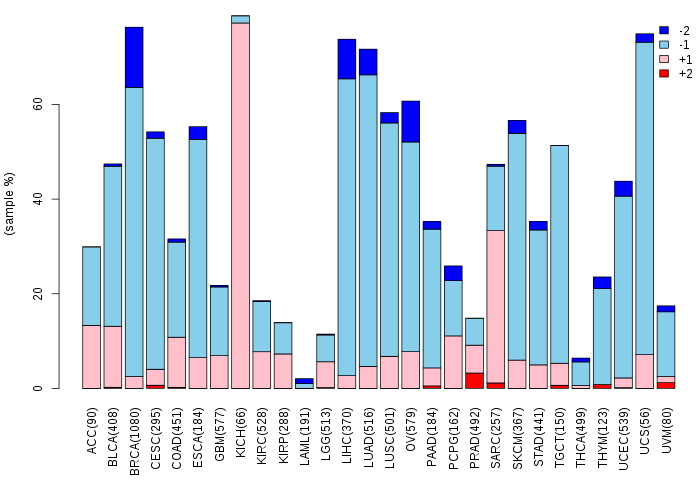
| Copy number variations of TissGene across 28 cancer types (X-axis: cancer type and Y-axis: % of CNV samples) (TCGA Gistic2_CopyNumber_Gistic2_all_data_by_genes, Gistic2 copy number data, version 2016-08-16) |
 |
| Top |
| TissGeneFusions for TSKS |
| Fusion genes including TissGene (ChimerDB 3.0, 2016-12-01 and TCGA fusion Portal 2015-12-01) |
| Database | Src | Cancer type | Sample | Fusion gene | ORF | 5'-gene BP | 3'-gene BP |
| Top |
| TissGeneNet for TSKS |
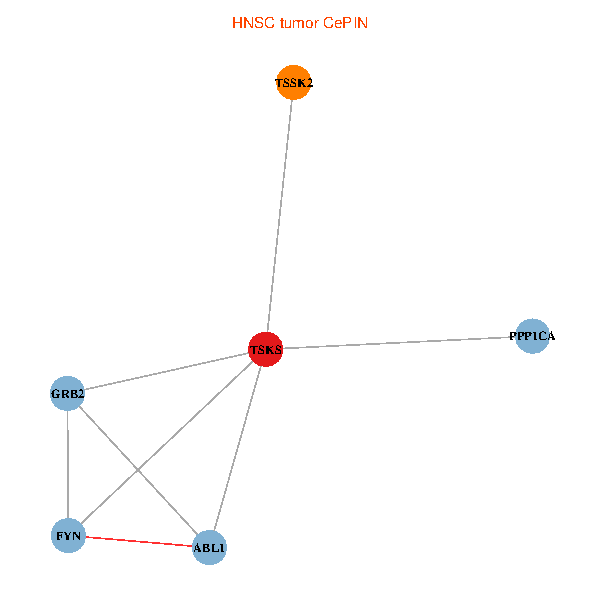
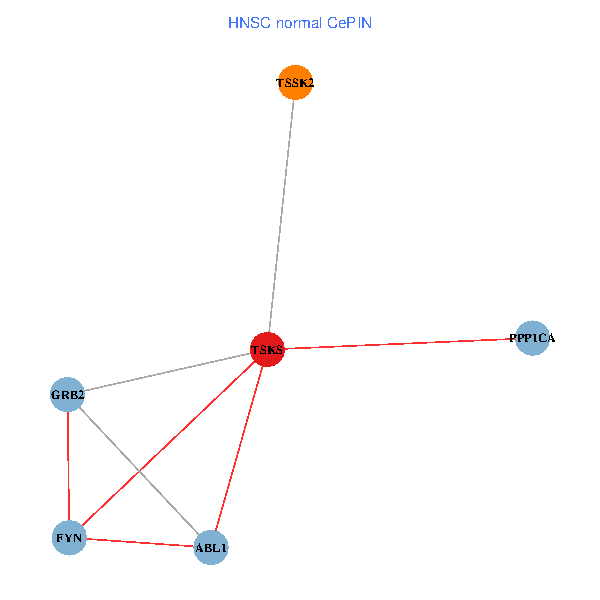
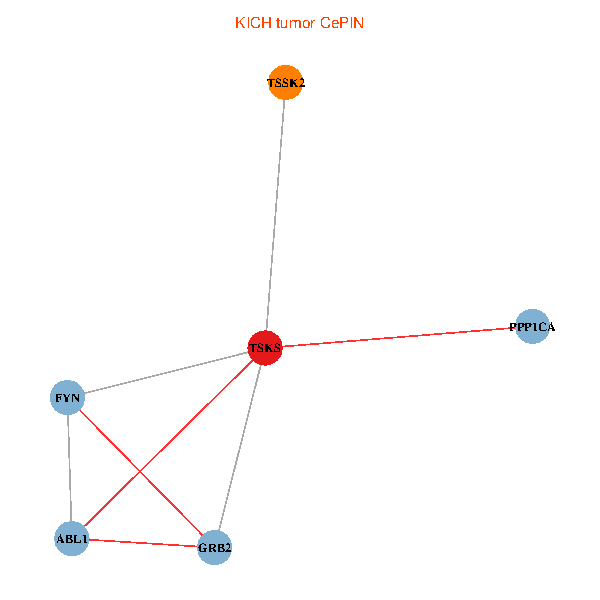
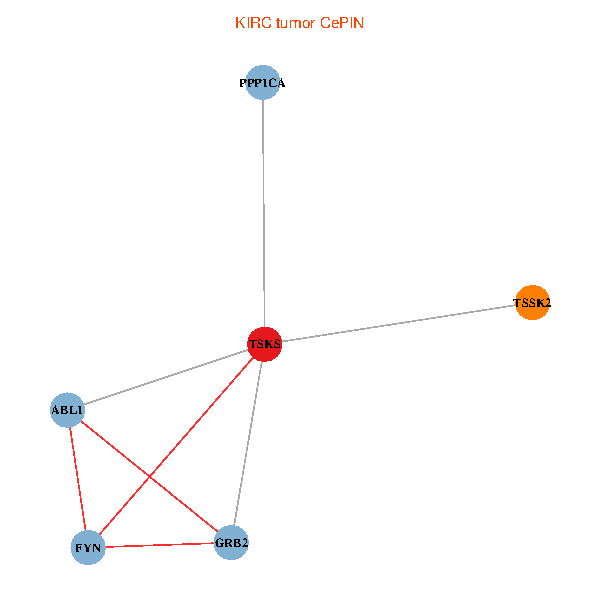
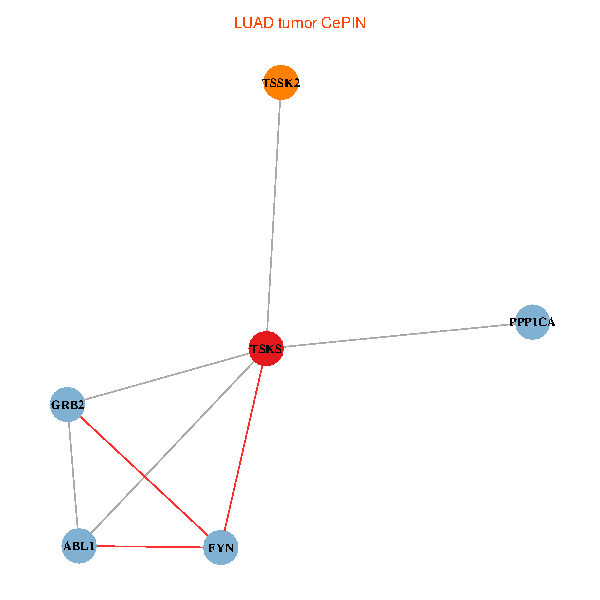
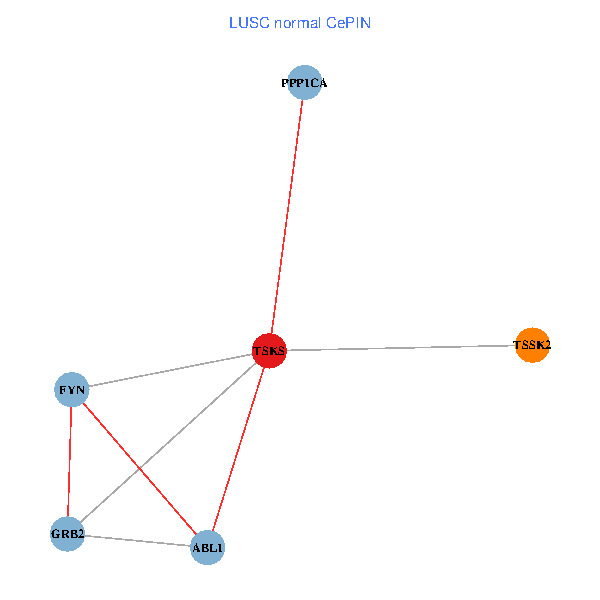
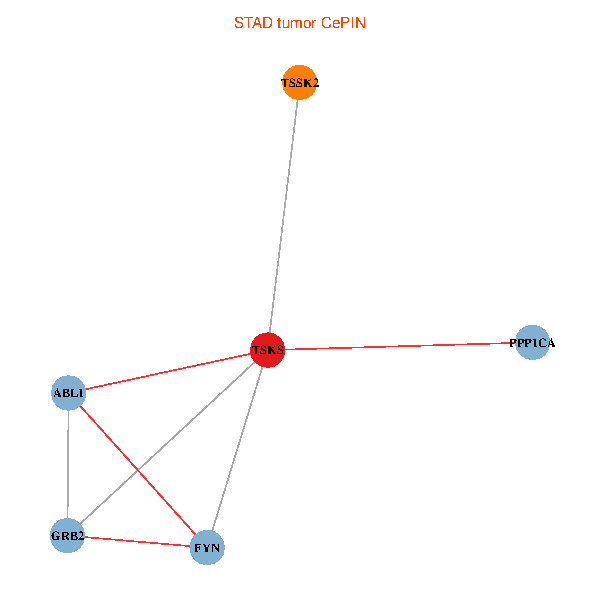
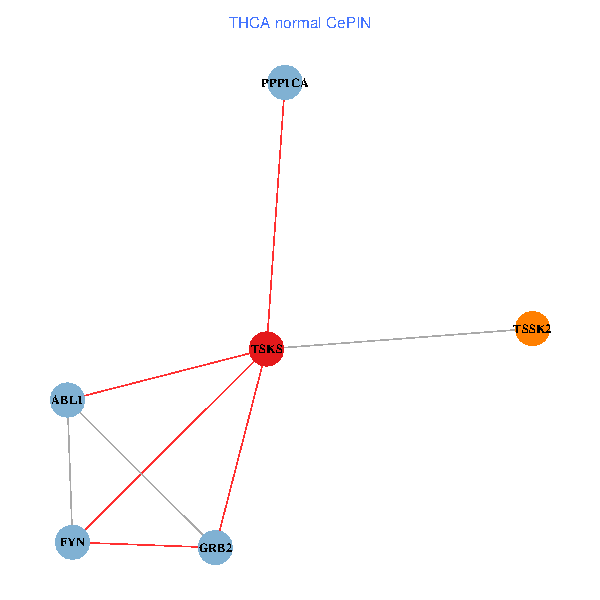
| Co-expressed gene networks based on protein-protein interaction data (CePIN) (TCGA IlluminaHiSeq_RNASeqV2, pan-cancer normalized log2(norm_counts+1) data, version 2016-08-16) (PINA2 ppi data) |
| BRCA (tumor) | BRCA (normal) |
| TSKS, PPP1CA, GRB2, FYN, ABL1, TSSK2 (tumor) | TSKS, PPP1CA, GRB2, FYN, ABL1, TSSK2 (normal) |
 |  |
| COAD (tumor) | COAD (normal) |
| TSKS, PPP1CA, GRB2, FYN, ABL1, TSSK2 (tumor) | TSKS, PPP1CA, GRB2, FYN, ABL1, TSSK2 (normal) |
 |  |
| HNSC (tumor) | HNSC (normal) |
| TSKS, PPP1CA, GRB2, FYN, ABL1, TSSK2 (tumor) | TSKS, PPP1CA, GRB2, FYN, ABL1, TSSK2 (normal) |
 |  |
| KICH (tumor) | KICH (normal) |
| TSKS, PPP1CA, GRB2, FYN, ABL1, TSSK2 (tumor) | TSKS, PPP1CA, GRB2, FYN, ABL1, TSSK2 (normal) |
 |  |
| KIRC (tumor) | KIRC (normal) |
| TSKS, PPP1CA, GRB2, FYN, ABL1, TSSK2 (tumor) | TSKS, PPP1CA, GRB2, FYN, ABL1, TSSK2 (normal) |
 |  |
| KIRP (tumor) | KIRP (normal) |
| TSKS, PPP1CA, GRB2, FYN, ABL1, TSSK2 (tumor) | TSKS, PPP1CA, GRB2, FYN, ABL1, TSSK2 (normal) |
 |  |
| LIHC (tumor) | LIHC (normal) |
| TSKS, PPP1CA, GRB2, FYN, ABL1, TSSK2 (tumor) | TSKS, PPP1CA, GRB2, FYN, ABL1, TSSK2 (normal) |
 |  |
| LUAD (tumor) | LUAD (normal) |
| TSKS, PPP1CA, GRB2, FYN, ABL1, TSSK2 (tumor) | TSKS, PPP1CA, GRB2, FYN, ABL1, TSSK2 (normal) |
 |  |
| LUSC (tumor) | LUSC (normal) |
| TSKS, PPP1CA, GRB2, FYN, ABL1, TSSK2 (tumor) | TSKS, PPP1CA, GRB2, FYN, ABL1, TSSK2 (normal) |
 |  |
| PRAD (tumor) | PRAD (normal) |
| TSKS, PPP1CA, GRB2, FYN, ABL1, TSSK2 (tumor) | TSKS, PPP1CA, GRB2, FYN, ABL1, TSSK2 (normal) |
 |  |
| STAD (tumor) | STAD (normal) |
| TSKS, PPP1CA, GRB2, FYN, ABL1, TSSK2 (tumor) | TSKS, PPP1CA, GRB2, FYN, ABL1, TSSK2 (normal) |
 |  |
| THCA (tumor) | THCA (normal) |
| TSKS, PPP1CA, GRB2, FYN, ABL1, TSSK2 (tumor) | TSKS, PPP1CA, GRB2, FYN, ABL1, TSSK2 (normal) |
 |  |
| Top |
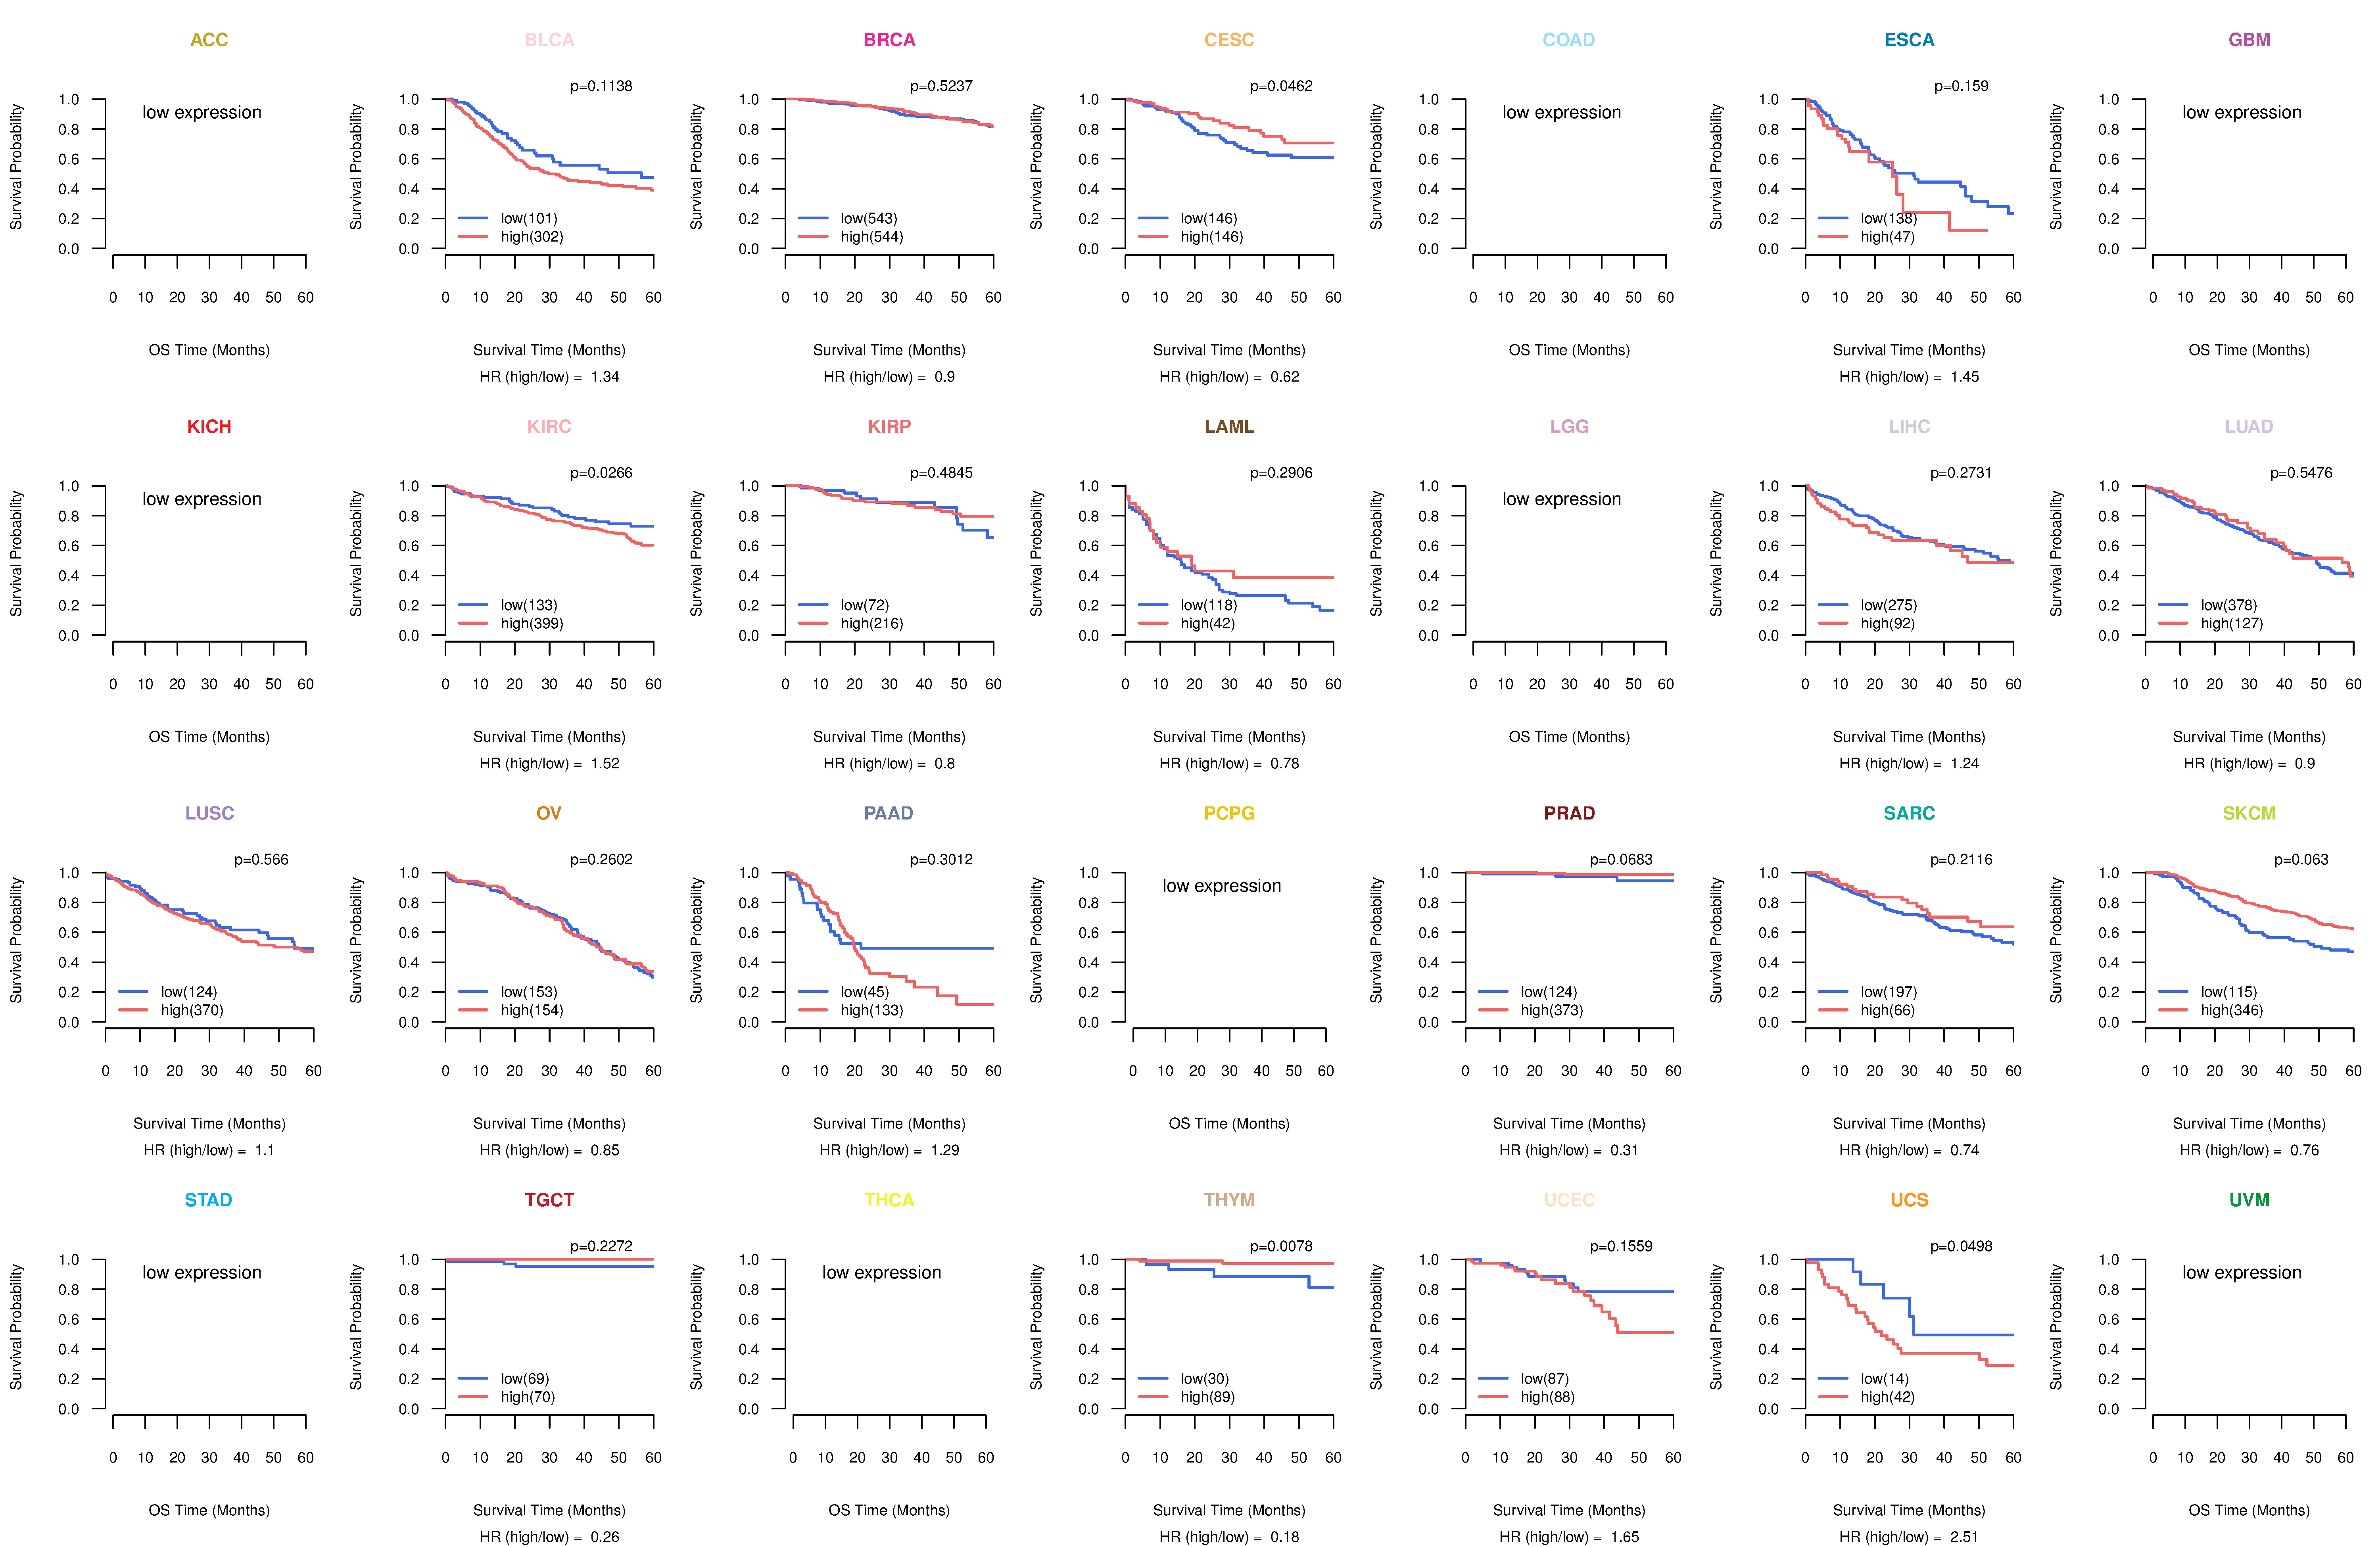
| TissGeneProg for TSKS |
| Kaplan-Meier plots with logrank tests of overall survival (OS) using 28 cancer types (TCGA IlluminaHiSeq_RNASeqV2, pan-cancer normalized log2(norm_counts+1) data, version 2016-08-16) (TCGA clinicalMatrix, phenotype data, version 2016-04-27) * Click on the image to enlarge it in a new window. |
 |
| Kaplan-Meier plots with logrank test of relapse free survival (RFS) using 28 cancer types (TCGA IlluminaHiSeq_RNASeqV2, pan-cancer normalized log2(norm_counts+1) data, version 2016-08-16) (TCGA clinicalMatrix, phenotype data, version 2016-04-27) * Click on the image enlarge it in a new window. |
 |
| Forest plot of Cox proportional hazard ratio (HR) and 95% CI of overall survival (OS) using 28 cancer types (TCGA IlluminaHiSeq_RNASeqV2, pan-cancer normalized log2(norm_counts+1) data, version 2016-08-16) (TCGA clinicalMatrix, phenotype data, version 2016-04-27) * Click on the image enlarge it in a new window. |
 |
| Forest plot of Cox proportional hazard ratio (HR) and 95% CI of relapse free survival (RFS) using 28 cancer types (TCGA IlluminaHiSeq_RNASeqV2, pan-cancer normalized log2(norm_counts+1) data, version 2016-08-16) (TCGA clinicalMatrix, phenotype data, version 2016-04-27) * Click on the image enlarge it in a new window. |
 |
| Top |
| TissGeneClin for TSKS |
| TissGeneDrug for TSKS |
| Drug information targeting TissGene (DrugBank Version 5.0.6, 2017-04-01) |
| DrugBank ID | Drug name | Drug activity | Drug type | Drug status |
| Top |
| TissGeneDisease for TSKS |
| Disease information associated with TissGene (DisGeNet, 2016-06-01) |
| Disease ID | Disease name | # pubmeds | Source |
|
Copyright 2016-Present - The University of Texas Health Science Center at Houston (UTHealth) Web File Viewing | How to Report, Fraud, Waste and Abuse | State of Texas | Statewide Search | Texas Homeland Security | Site Policies |