 |
| |
| |
| |
| |
| |
| |
|

| TissGeneSummary for SCN2B |
 Gene summary Gene summary |
| Basic gene information | Gene symbol | SCN2B |
| Gene name | sodium channel, voltage-gated, type II, beta subunit | |
| Synonyms | ATFB14 | |
| Cytomap | UCSC genome browser: 11q23 | |
| Type of gene | protein-coding | |
| RefGenes | NM_004588.4, | |
| Description | neuronal voltage-gated sodium channel beta 2 subunitsodium channel beta 2 subunitsodium channel subunit beta-2sodium channel, voltage-gated, type II, beta polypeptide | |
| Modification date | 20141219 | |
| dbXrefs | MIM : 601327 | |
| HGNC : HGNC | ||
| Ensembl : ENSG00000149575 | ||
| HPRD : 03208 | ||
| Vega : OTTHUMG00000048248 | ||
| Protein | UniProt: go to UniProt's Cross Reference DB Table | |
| Expression | CleanEX: HS_SCN2B | |
| BioGPS: 6327 | ||
| Pathway | NCI Pathway Interaction Database: SCN2B | |
| KEGG: SCN2B | ||
| REACTOME: SCN2B | ||
| Pathway Commons: SCN2B | ||
| Context | iHOP: SCN2B | |
| ligand binding site mutation search in PubMed: SCN2B | ||
| UCL Cancer Institute: SCN2B | ||
| Assigned class in TissGDB* | C | |
| Included tissue-specific gene expression resources | HPA,TiGER | |
| Specific-tissues in normal samples (assigned by TissGDB using HPA, TiGER, and GTEx) | Brain | |
| Cancer types related to the specific-tissues in cancer samples (assigned by TissGDB using TCGA) | GBM,LGG | |
| Reference showing the relevant tissue of SCN2B | ||
| Description by TissGene annotations | Have significant anti-correlated miRNA | |
| * Class A consists of genes with literature evidence and is part of the cTissGenes. Class B consists of only cTissGenes without additional evidence. The remaining genes belong to Class C. |
| Gene ontology having evidence of Inferred from Direct Assay (IDA) from Entrez |
| GO ID | GO term | PubMed ID | GO:0035725 | sodium ion transmembrane transport | 19808477 | GO:2000649 | regulation of sodium ion transmembrane transporter activity | 19808477 | GO:0035725 | sodium ion transmembrane transport | 19808477 | GO:2000649 | regulation of sodium ion transmembrane transporter activity | 19808477 |
| Top |
| TissGeneExp for SCN2B |
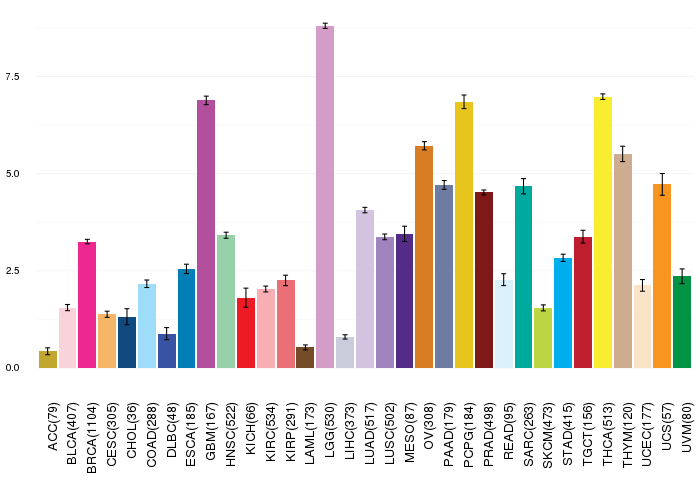
| Gene expressions across 28 cancer types (X-axis: cancer type and Y-axis: log2(norm_counts+1)) (TCGA IlluminaHiSeq_RNASeqV2, pan-cancer normalized log2(norm_counts+1) data, version 2016-08-16) |
 |
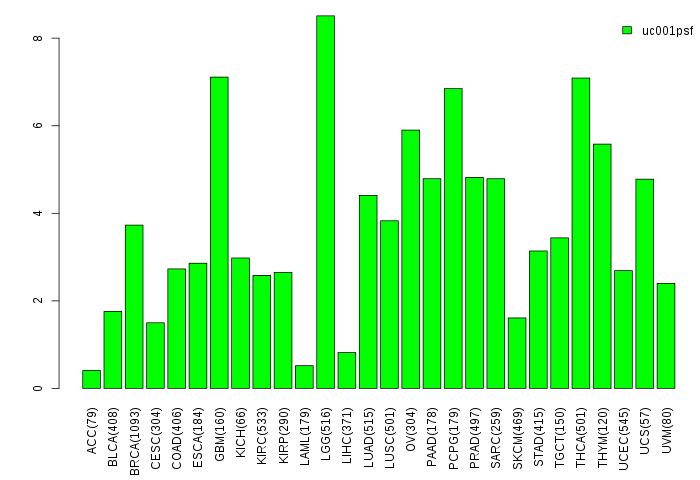
| Gene isoform expressions across 28 cancer types (X-axis: cancer type and Y-axis: log2(norm_counts+1)) (TCGA pan-cancer tcga_rsem_isoform_tpm, version 2016-09-01) |
 |
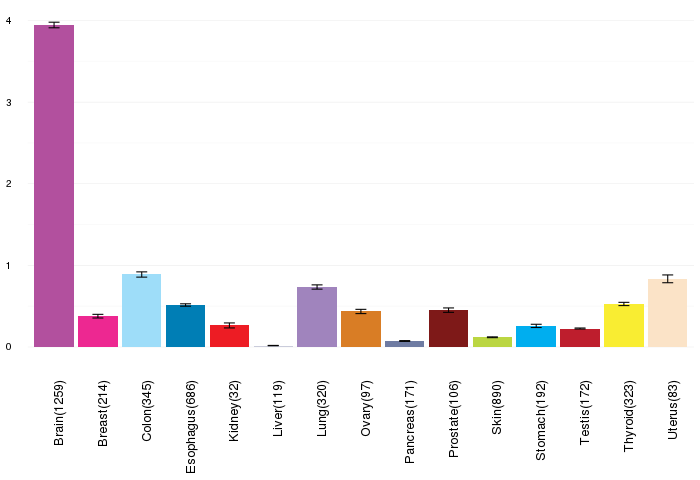
| Gene expressions across normal tissues of GTEx data (GTEx GTEx_Analysis_v6_RNA-seq_RNA-SeQCv1.1.8_gene_rpkm.gct) - Here, we shows the matched tissue types only among our 28 cancer types. |
 |
| Different expressions across 14 cancer types with more than 10 samples between matched tumors and normals (X-axis: cancer type and Y-axis: log2(norm_counts+1)) (TCGA IlluminaHiSeq_RNASeqV2, pan-cancer normalized log2(norm_counts+1) data, version 2016-08-16) |
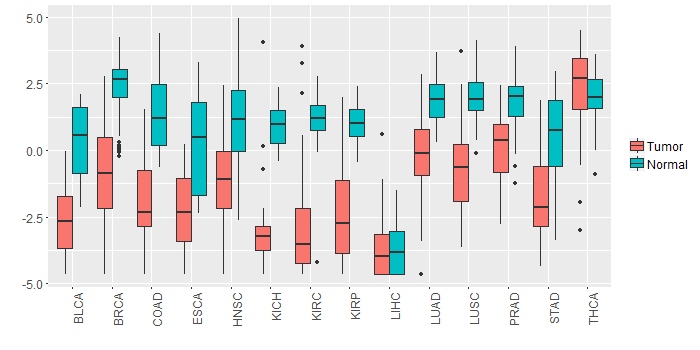 |
| - Significantly differentially expressed cancer types and information. (|Fold change|>1 and FDR<0.05) |
| Cancer type | Mean(exp) in tumor | Mean(exp) in matched normal | Log2FC | P-val. | FDR |
| KIRC | -2.95790209 | 1.173786799 | -4.131688889 | 3.49E-31 | 7.31E-30 |
| COAD | -2.067343116 | 1.347122269 | -3.414465385 | 4.00E-10 | 4.84E-09 |
| LUSC | -0.783473659 | 2.014679283 | -2.798152941 | 5.56E-17 | 4.41E-16 |
| BLCA | -2.688374897 | 0.384025103 | -3.0724 | 6.92E-08 | 4.40E-06 |
| KIRP | -2.421566673 | 1.036898952 | -3.458465625 | 2.71E-12 | 4.11E-11 |
| KICH | -2.937365423 | 0.928550577 | -3.865916 | 3.88E-11 | 3.31E-10 |
| HNSC | -1.144197051 | 1.400482019 | -2.54467907 | 1.47E-09 | 2.25E-08 |
| LUAD | -0.189057837 | 1.870409404 | -2.059467241 | 2.13E-14 | 2.04E-13 |
| PRAD | 0.149687654 | 1.826251115 | -1.676563462 | 3.97E-12 | 1.56E-10 |
| BRCA | -0.97035209 | 2.395386506 | -3.365738596 | 4.87E-40 | 1.46E-38 |
| STAD | -1.753872923 | 0.503298952 | -2.257171875 | 6.08E-07 | 1.09E-05 |
| Top |
| TissGene-miRNA for SCN2B |
| Significantly anti-correlated miRNAs of TissGene across 28 cancer types (Gene-miRNA relations from TargetScanHuman Relsease 7.1, Conserved_Site_Context_Scores.txt.zip, 06.01.2016) (TCGA IlluminaHiSeq_miRNASeq, log2(RPM+1) data, version 2016-11-21) (TCGA IlluminaHiSeq_RNASeqV2, log2(normalized_count+1) data, version 2016-08-16) (Spearman’s Rank Correlation (p-value<0.05 and coefficient<-0.25)) |
| Cancer type | miRNA id | miRNA accession | P-val. | Coeff. | # samples |
| ACC | hsa-miR-519d-3p | MIMAT0002853 | 0.01 | -0.29 | 78 |
| ACC | hsa-miR-519d-3p | MIMAT0002853 | 0.01 | -0.29 | 78 |
| UCS | hsa-miR-410-3p | MIMAT0002171 | 0.03 | -0.29 | 56 |
| UCS | hsa-miR-369-3p | MIMAT0000721 | 0.024 | -0.3 | 56 |
| UCS | hsa-miR-543 | MIMAT0004954 | 0.025 | -0.34 | 56 |
| Top |
| TissGeneMut for SCN2B |
| TissGeneSNV for SCN2B |
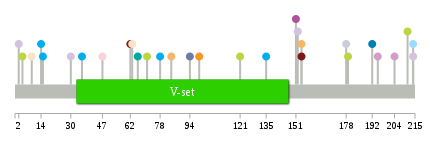
| nsSNV counts per each loci. Different colors of circles represent different cancer types. Circle size denotes number of samples. (TCGA somatic mutation (SNPs and small INDELs) data, version 2016-04-25) * Click on the image to enlarge it in a new window. |
 |
 |
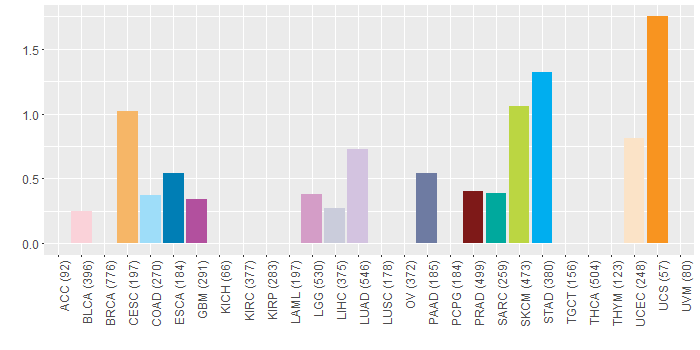
| Somatic nucleotide variants of TissGene across 28 cancer types (X-axis: cancer type and Y-axis: % of mutated samples) The numbers in parentheses are numbers of samples with mutation (nsSNVs). (TCGA somatic mutation (SNPs and small INDELs) data, version 2016-04-25) |
 |
| - nsSNVs sorted by frequency. |
| AAchange | Cancer type | # samples |
| p.R84H | CESC | 1 |
| p.P152H | LUAD | 1 |
| p.V172L | HNSC | 1 |
| p.R9H | UCEC | 1 |
| p.R135C | STAD | 1 |
| p.P151T | GBM | 1 |
| p.E78D | STAD | 1 |
| p.M178V | LIHC | 1 |
| p.R47H | BLCA | 1 |
| p.T204M | LGG | 1 |
| p.A214T | LUAD | 1 |
| p.L14I | STAD | 1 |
| p.A36V | STAD | 1 |
| p.S192T | ESCA | 1 |
| p.D211N | SKCM | 1 |
| p.R154W | PRAD | 1 |
| p.Q62* | PRAD | 1 |
| p.H2L | LUAD | 1 |
| p.V179M | SKCM | 1 |
| p.A214T | COAD | 1 |
| p.T15M | READ | 1 |
| p.R94W | PAAD | 1 |
| p.R154Q | CESC | 1 |
| p.E71K | SKCM | 1 |
| p.V99M | UCS | 1 |
| p.D195G | LGG | 1 |
| p.N66S | SARC | 1 |
| p.M30T | LUAD | 1 |
| p.D4N | SKCM | 1 |
| p.D121N | SKCM | 1 |
| p.T15M | STAD | 1 |
| p.F63L | UCEC | 1 |
| Top |
| TissGeneCNV for SCN2B |
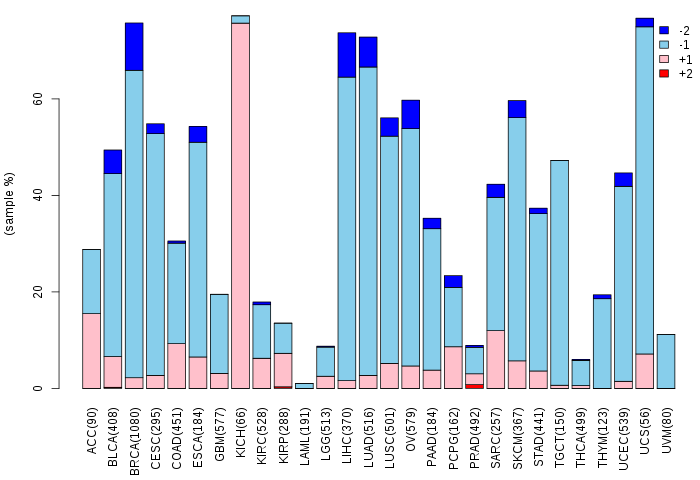
| Copy number variations of TissGene across 28 cancer types (X-axis: cancer type and Y-axis: % of CNV samples) (TCGA Gistic2_CopyNumber_Gistic2_all_data_by_genes, Gistic2 copy number data, version 2016-08-16) |
 |
| Top |
| TissGeneFusions for SCN2B |
| Fusion genes including TissGene (ChimerDB 3.0, 2016-12-01 and TCGA fusion Portal 2015-12-01) |
| Database | Src | Cancer type | Sample | Fusion gene | ORF | 5'-gene BP | 3'-gene BP |
| Chimerdb3.0 | ChiTaRs | NA | DA098743 | SCN2B-PLXNB3 | chr11:118047335 | chrX:153045117 |
| Top |
| TissGeneNet for SCN2B |
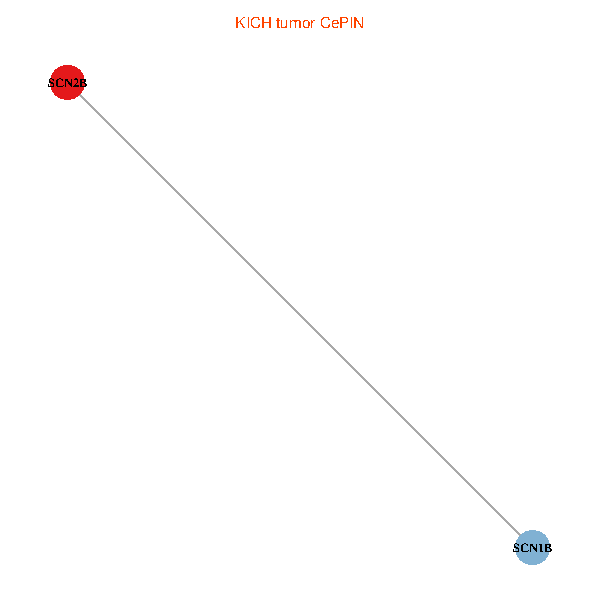
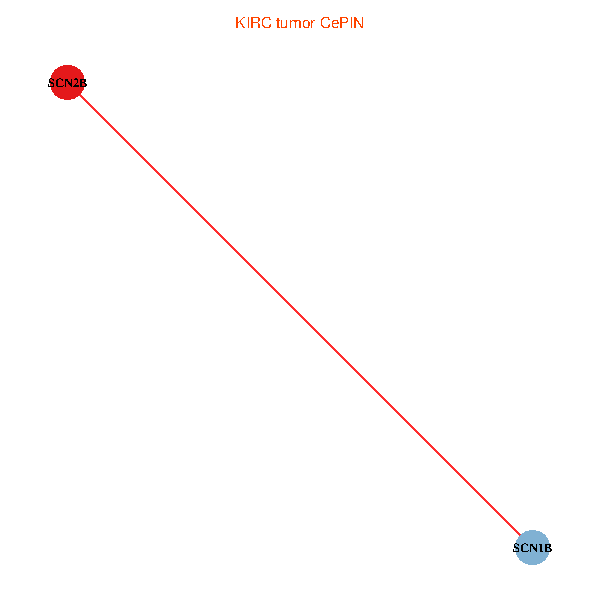
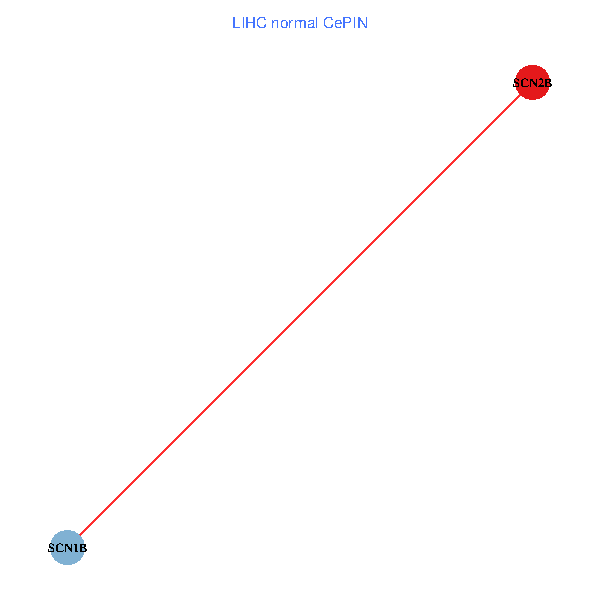
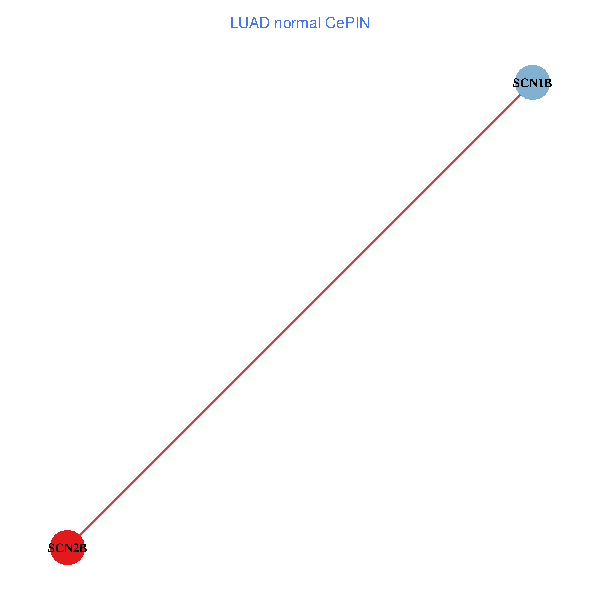
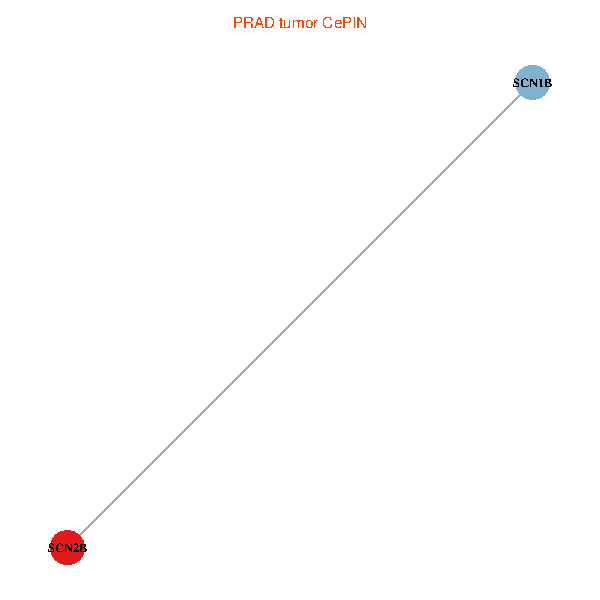
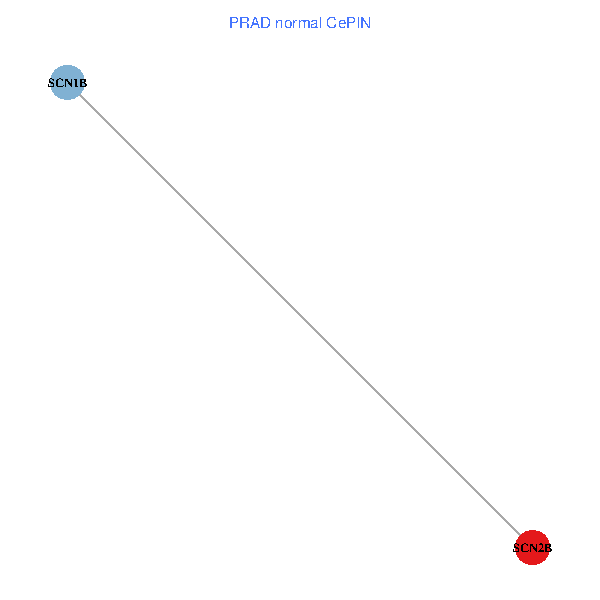
| Co-expressed gene networks based on protein-protein interaction data (CePIN) (TCGA IlluminaHiSeq_RNASeqV2, pan-cancer normalized log2(norm_counts+1) data, version 2016-08-16) (PINA2 ppi data) |
| BRCA (tumor) | BRCA (normal) |
| SCN2B, SCN1B (tumor) | SCN2B, SCN1B (normal) |
 |  |
| COAD (tumor) | COAD (normal) |
| SCN2B, SCN1B (tumor) | SCN2B, SCN1B (normal) |
 |  |
| HNSC (tumor) | HNSC (normal) |
| SCN2B, SCN1B (tumor) | SCN2B, SCN1B (normal) |
 |  |
| KICH (tumor) | KICH (normal) |
| SCN2B, SCN1B (tumor) | SCN2B, SCN1B (normal) |
 |  |
| KIRC (tumor) | KIRC (normal) |
| SCN2B, SCN1B (tumor) | SCN2B, SCN1B (normal) |
 |  |
| KIRP (tumor) | KIRP (normal) |
| SCN2B, SCN1B (tumor) | SCN2B, SCN1B (normal) |
 |  |
| LIHC (tumor) | LIHC (normal) |
| SCN2B, SCN1B (tumor) | SCN2B, SCN1B (normal) |
 |  |
| LUAD (tumor) | LUAD (normal) |
| SCN2B, SCN1B (tumor) | SCN2B, SCN1B (normal) |
 |  |
| LUSC (tumor) | LUSC (normal) |
| SCN2B, SCN1B (tumor) | SCN2B, SCN1B (normal) |
 |  |
| PRAD (tumor) | PRAD (normal) |
| SCN2B, SCN1B (tumor) | SCN2B, SCN1B (normal) |
 |  |
| STAD (tumor) | STAD (normal) |
| SCN2B, SCN1B (tumor) | SCN2B, SCN1B (normal) |
 |  |
| THCA (tumor) | THCA (normal) |
| SCN2B, SCN1B (tumor) | SCN2B, SCN1B (normal) |
 |  |
| Top |
| TissGeneProg for SCN2B |
| Kaplan-Meier plots with logrank tests of overall survival (OS) using 28 cancer types (TCGA IlluminaHiSeq_RNASeqV2, pan-cancer normalized log2(norm_counts+1) data, version 2016-08-16) (TCGA clinicalMatrix, phenotype data, version 2016-04-27) * Click on the image to enlarge it in a new window. |
 |
| Kaplan-Meier plots with logrank test of relapse free survival (RFS) using 28 cancer types (TCGA IlluminaHiSeq_RNASeqV2, pan-cancer normalized log2(norm_counts+1) data, version 2016-08-16) (TCGA clinicalMatrix, phenotype data, version 2016-04-27) * Click on the image enlarge it in a new window. |
 |
| Forest plot of Cox proportional hazard ratio (HR) and 95% CI of overall survival (OS) using 28 cancer types (TCGA IlluminaHiSeq_RNASeqV2, pan-cancer normalized log2(norm_counts+1) data, version 2016-08-16) (TCGA clinicalMatrix, phenotype data, version 2016-04-27) * Click on the image enlarge it in a new window. |
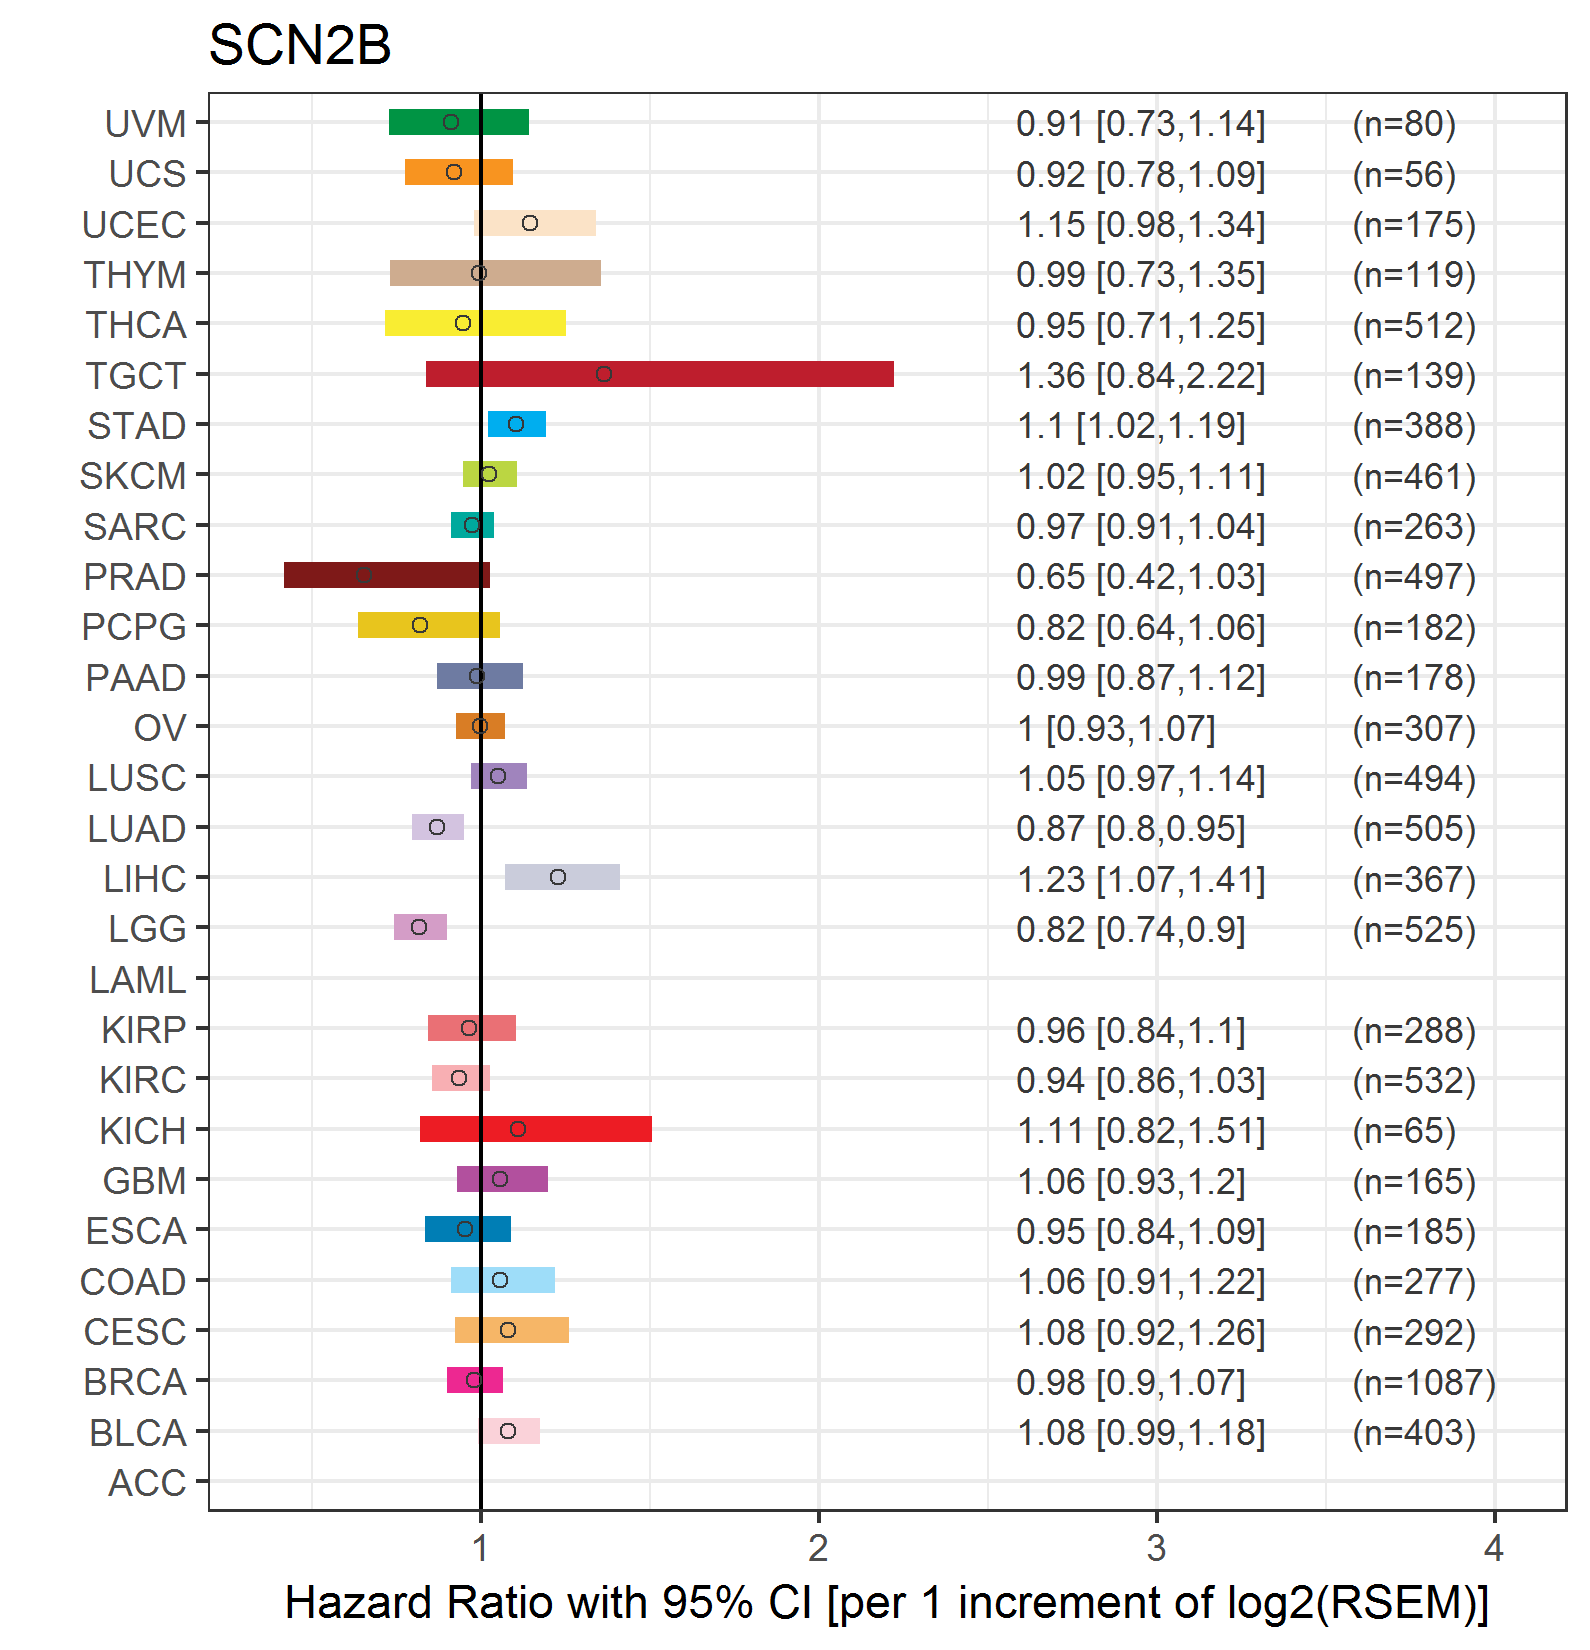 |
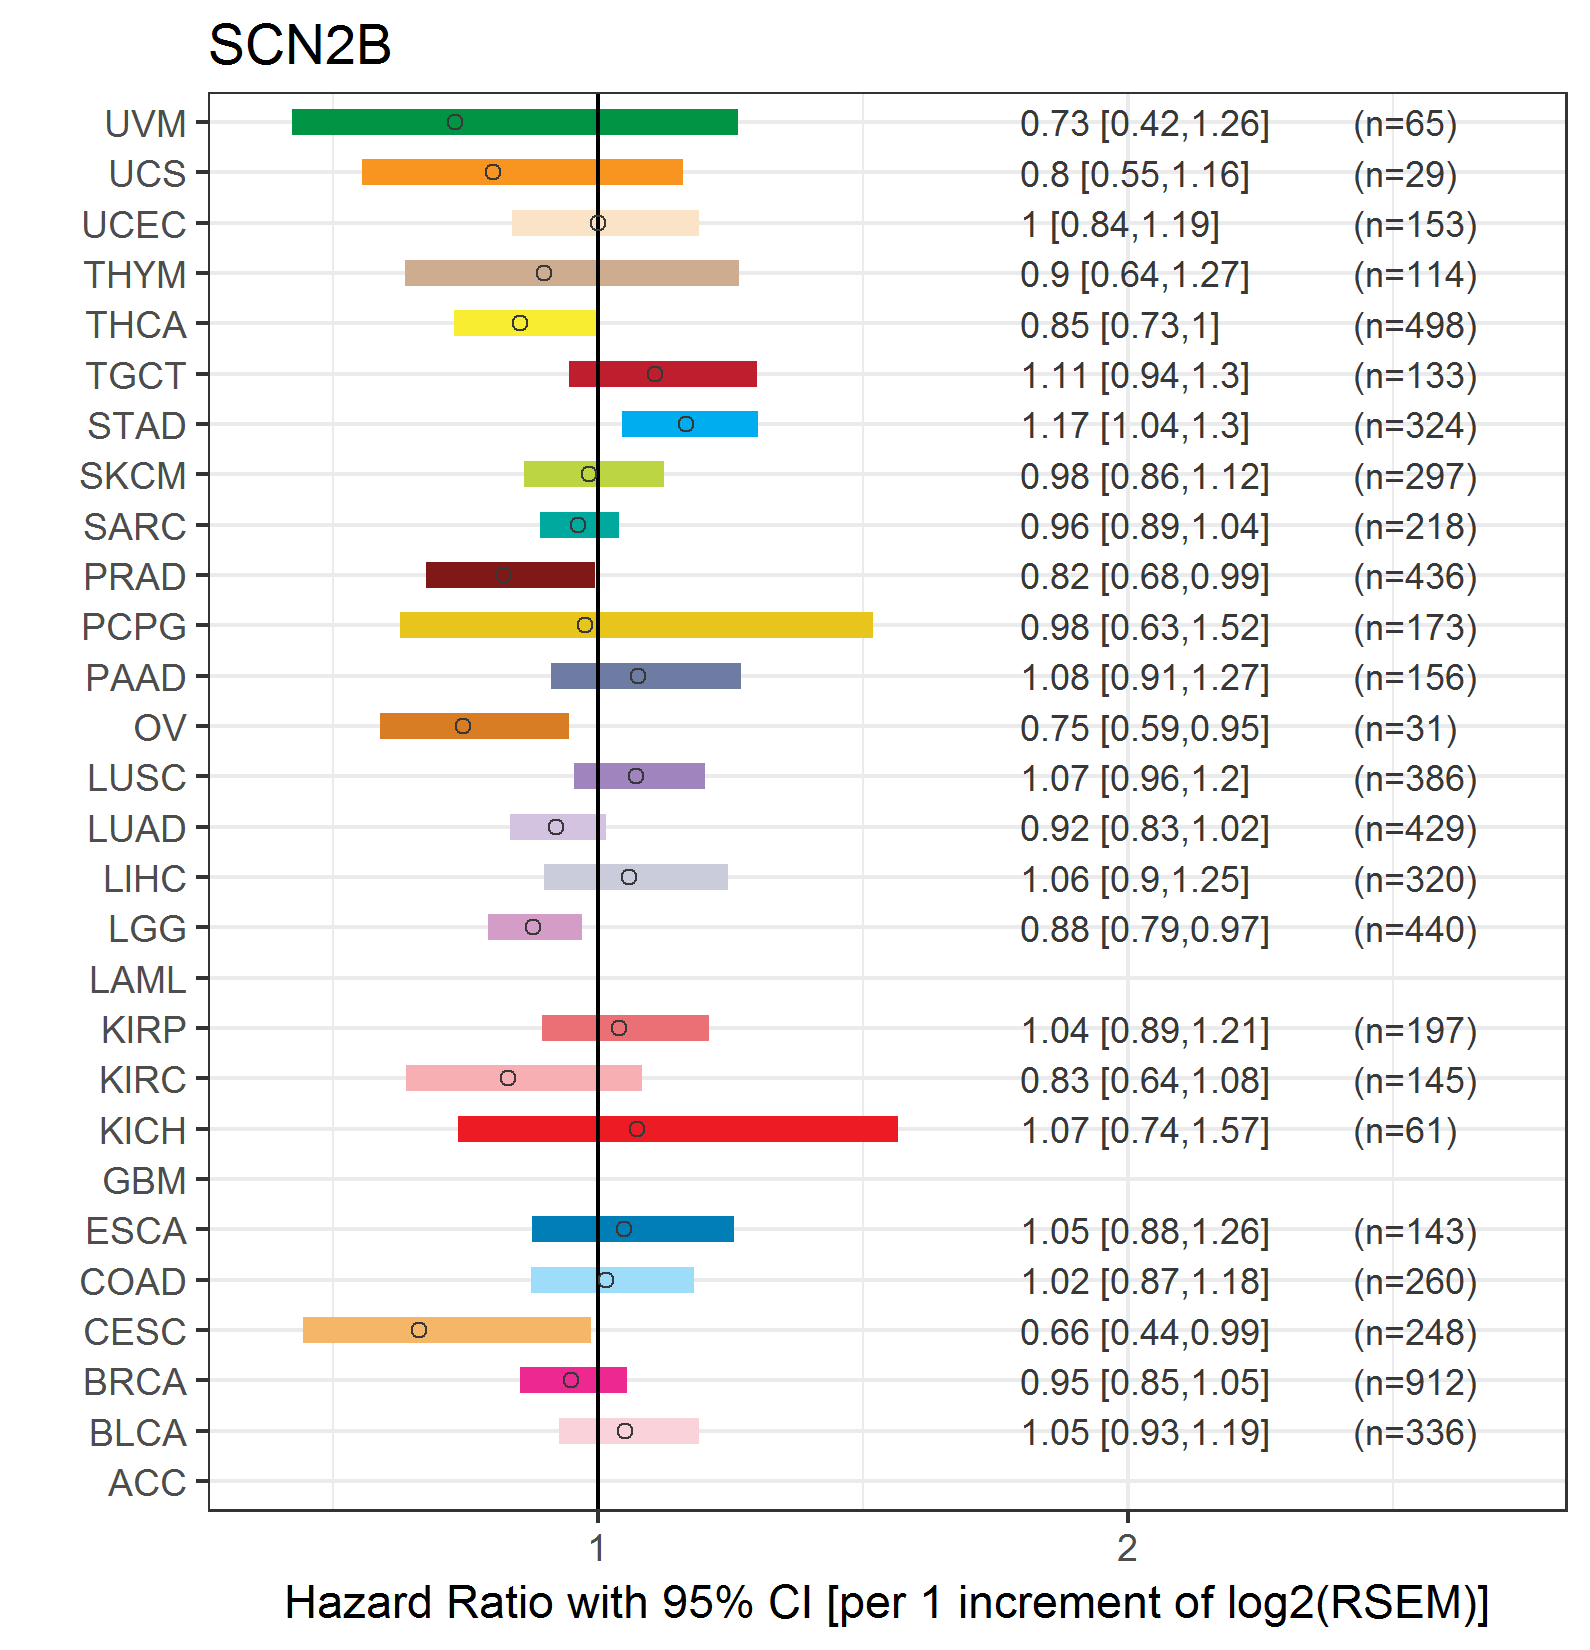
| Forest plot of Cox proportional hazard ratio (HR) and 95% CI of relapse free survival (RFS) using 28 cancer types (TCGA IlluminaHiSeq_RNASeqV2, pan-cancer normalized log2(norm_counts+1) data, version 2016-08-16) (TCGA clinicalMatrix, phenotype data, version 2016-04-27) * Click on the image enlarge it in a new window. |
 |
| Top |
| TissGeneClin for SCN2B |
| TissGeneDrug for SCN2B |
| Drug information targeting TissGene (DrugBank Version 5.0.6, 2017-04-01) |
| DrugBank ID | Drug name | Drug activity | Drug type | Drug status |
| Top |
| TissGeneDisease for SCN2B |
| Disease information associated with TissGene (DisGeNet, 2016-06-01) |
| Disease ID | Disease name | # pubmeds | Source |
| umls:C0014544 | Epilepsy | 2 | BeFree |
| umls:C1142166 | Brugada Syndrome (disorder) | 2 | BeFree,GAD |
| umls:C0004238 | Atrial Fibrillation | 1 | GAD |
| umls:C0029882 | Otitis Media | 1 | RGD |
| umls:C0036572 | Seizures | 1 | RGD |
| umls:C0040336 | Tobacco Use Disorder | 1 | GAD |
| umls:C0391957 | idiopathic epilepsy | 1 | BeFree |
| umls:C3809312 | ATRIAL FIBRILLATION, FAMILIAL, 14 | 1 | CLINVAR,UNIPROT |
|
Copyright 2016-Present - The University of Texas Health Science Center at Houston (UTHealth) Web File Viewing | How to Report, Fraud, Waste and Abuse | State of Texas | Statewide Search | Texas Homeland Security | Site Policies |