 |
| |
| |
| |
| |
| |
| |
|

| TissGeneSummary for DPEP3 |
 Gene summary Gene summary |
| Basic gene information | Gene symbol | DPEP3 |
| Gene name | dipeptidase 3 | |
| Synonyms | MBD3 | |
| Cytomap | UCSC genome browser: 16q22.1 | |
| Type of gene | protein-coding | |
| RefGenes | NM_001129758.1, NM_022357.3, | |
| Description | membrane-bound dipeptidase 3metallopeptidase (family M19) | |
| Modification date | 20141207 | |
| dbXrefs | MIM : 609926 | |
| HGNC : HGNC | ||
| Ensembl : ENSG00000141096 | ||
| HPRD : 07012 | ||
| Vega : OTTHUMG00000137544 | ||
| Protein | UniProt: go to UniProt's Cross Reference DB Table | |
| Expression | CleanEX: HS_DPEP3 | |
| BioGPS: 64180 | ||
| Pathway | NCI Pathway Interaction Database: DPEP3 | |
| KEGG: DPEP3 | ||
| REACTOME: DPEP3 | ||
| Pathway Commons: DPEP3 | ||
| Context | iHOP: DPEP3 | |
| ligand binding site mutation search in PubMed: DPEP3 | ||
| UCL Cancer Institute: DPEP3 | ||
| Assigned class in TissGDB* | B | |
| Included tissue-specific gene expression resources | HPA,TiGER,GTEx | |
| Specific-tissues in normal samples (assigned by TissGDB using HPA, TiGER, and GTEx) | Testis | |
| Cancer types related to the specific-tissues in cancer samples (assigned by TissGDB using TCGA) | TGCT | |
| Reference showing the relevant tissue of DPEP3 | ||
| Description by TissGene annotations | Cancer gene | |
| * Class A consists of genes with literature evidence and is part of the cTissGenes. Class B consists of only cTissGenes without additional evidence. The remaining genes belong to Class C. |
| Gene ontology having evidence of Inferred from Direct Assay (IDA) from Entrez |
| GO ID | GO term | PubMed ID |
| Top |
| TissGeneExp for DPEP3 |
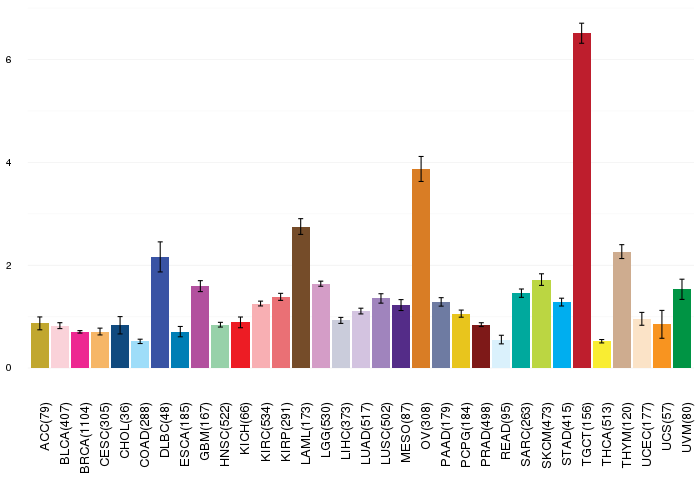
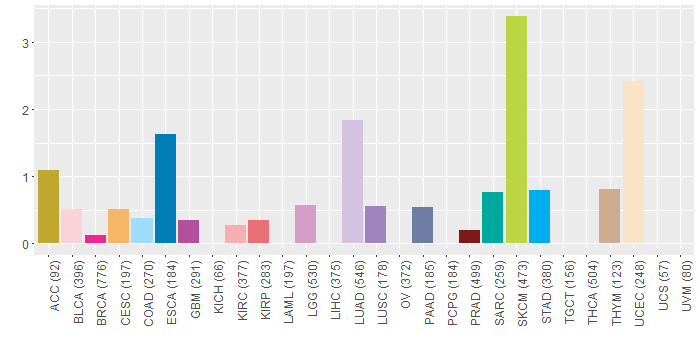
| Gene expressions across 28 cancer types (X-axis: cancer type and Y-axis: log2(norm_counts+1)) (TCGA IlluminaHiSeq_RNASeqV2, pan-cancer normalized log2(norm_counts+1) data, version 2016-08-16) |
 |
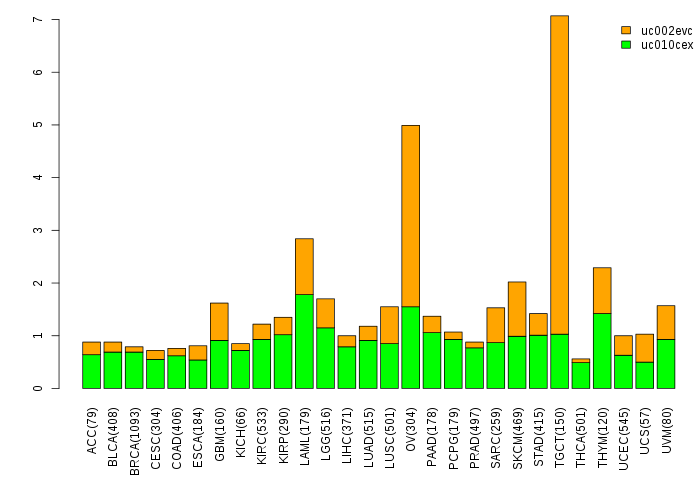
| Gene isoform expressions across 28 cancer types (X-axis: cancer type and Y-axis: log2(norm_counts+1)) (TCGA pan-cancer tcga_rsem_isoform_tpm, version 2016-09-01) |
 |
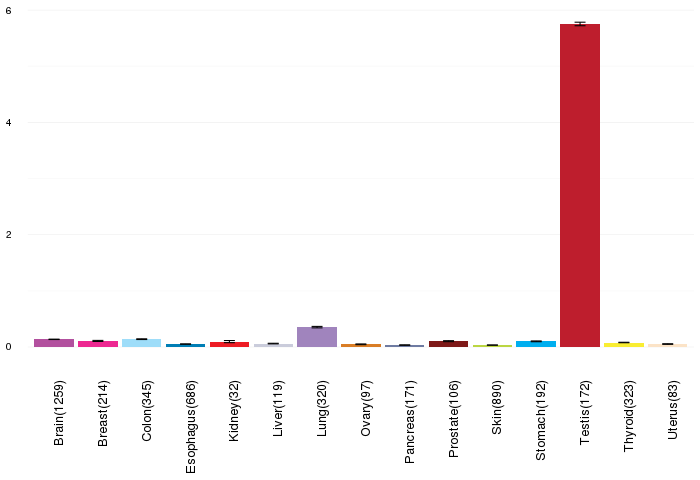
| Gene expressions across normal tissues of GTEx data (GTEx GTEx_Analysis_v6_RNA-seq_RNA-SeQCv1.1.8_gene_rpkm.gct) - Here, we shows the matched tissue types only among our 28 cancer types. |
 |
| Different expressions across 14 cancer types with more than 10 samples between matched tumors and normals (X-axis: cancer type and Y-axis: log2(norm_counts+1)) (TCGA IlluminaHiSeq_RNASeqV2, pan-cancer normalized log2(norm_counts+1) data, version 2016-08-16) |
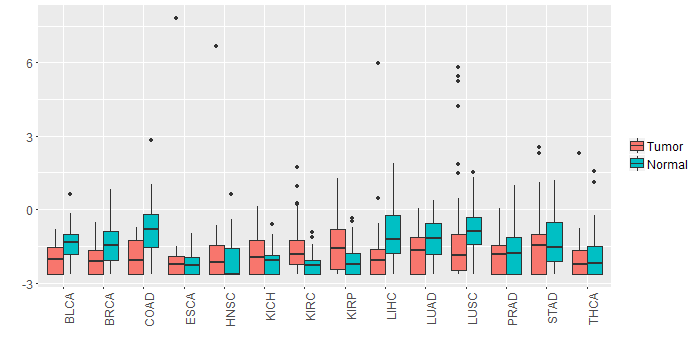 |
| - Significantly differentially expressed cancer types and information. (|Fold change|>1 and FDR<0.05) |
| Cancer type | Mean(exp) in tumor | Mean(exp) in matched normal | Log2FC | P-val. | FDR |
| COAD | -1.870778849 | -0.702563465 | -1.168215385 | 6.68E-05 | 0.00025677 |
| Top |
| TissGene-miRNA for DPEP3 |
| Significantly anti-correlated miRNAs of TissGene across 28 cancer types (Gene-miRNA relations from TargetScanHuman Relsease 7.1, Conserved_Site_Context_Scores.txt.zip, 06.01.2016) (TCGA IlluminaHiSeq_miRNASeq, log2(RPM+1) data, version 2016-11-21) (TCGA IlluminaHiSeq_RNASeqV2, log2(normalized_count+1) data, version 2016-08-16) (Spearman’s Rank Correlation (p-value<0.05 and coefficient<-0.25)) |
| Cancer type | miRNA id | miRNA accession | P-val. | Coeff. | # samples |
| Top |
| TissGeneMut for DPEP3 |
| TissGeneSNV for DPEP3 |
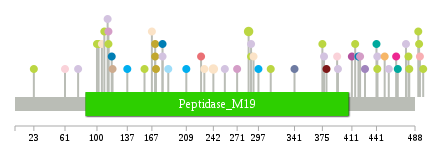
| nsSNV counts per each loci. Different colors of circles represent different cancer types. Circle size denotes number of samples. (TCGA somatic mutation (SNPs and small INDELs) data, version 2016-04-25) * Click on the image to enlarge it in a new window. |
 |
 |
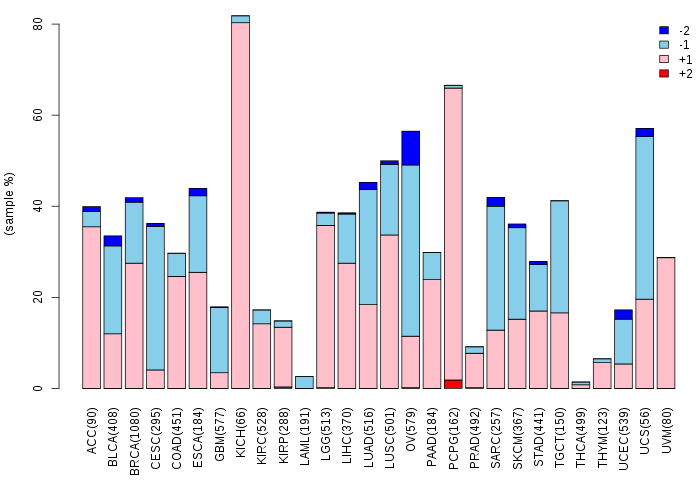
| Somatic nucleotide variants of TissGene across 28 cancer types (X-axis: cancer type and Y-axis: % of mutated samples) The numbers in parentheses are numbers of samples with mutation (nsSNVs). (TCGA somatic mutation (SNPs and small INDELs) data, version 2016-04-25) |
 |
| - nsSNVs sorted by frequency. |
| AAchange | Cancer type | # samples |
| p.R285C | SKCM | 2 |
| p.R242H | UCEC | 2 |
| p.R180S | LUAD | 1 |
| p.I312L | SKCM | 1 |
| p.D187Y | COAD | 1 |
| p.A442V | SKCM | 1 |
| p.P492L | SKCM | 1 |
| p.R441G | SARC | 1 |
| p.T477N | LUAD | 1 |
| p.A442E | LUAD | 1 |
| p.N209K | STAD | 1 |
| p.R114W | LGG | 1 |
| p.P77T | LUAD | 1 |
| p.R143* | HNSC | 1 |
| p.T480A | SKCM | 1 |
| p.V119M | THYM | 1 |
| p.M113I | LUAD | 1 |
| p.R106W | UCEC | 1 |
| p.M288R | LUAD | 1 |
| p.N467Y | SARC | 1 |
| p.A61T | BLCA | 1 |
| p.A167V | UCEC | 1 |
| p.S231F | UCEC | 1 |
| p.A109T | HNSC | 1 |
| p.R114Q | SKCM | 1 |
| p.G271R | LGG | 1 |
| p.G394E | LUAD | 1 |
| p.E415K | SKCM | 1 |
| p.P465H | BRCA | 1 |
| p.R60H | HNSC | 1 |
| p.E377K | LUAD | 1 |
| p.G341D | PAAD | 1 |
| p.C171* | ACC | 1 |
| p.A88T | READ | 1 |
| p.Q419H | ESCA | 1 |
| p.P493L | SKCM | 1 |
| p.P100S | SKCM | 1 |
| p.V321M | HNSC | 1 |
| p.L118F | ESCA | 1 |
| p.S456N | LUAD | 1 |
| p.P23S | SKCM | 1 |
| p.G380R | PRAD | 1 |
| p.C171X | ACC | 1 |
| p.D291Y | UCEC | 1 |
| p.P451L | CESC | 1 |
| p.Y494* | KIRC | 1 |
| p.Q172K | ACC | 1 |
| p.R180C | ESCA | 1 |
| p.T481A | SKCM | 1 |
| p.M288I | SKCM | 1 |
| p.E256* | LUAD | 1 |
| p.Q393* | BLCA | 1 |
| p.A109G | SKCM | 1 |
| p.A36T | HNSC | 1 |
| p.V421A | LGG | 1 |
| p.D227E | KIRP | 1 |
| p.R411H | GBM | 1 |
| p.T102I | SKCM | 1 |
| p.G375E | SKCM | 1 |
| p.L427M | LUSC | 1 |
| p.L137P | STAD | 1 |
| p.G498D | SKCM | 1 |
| p.G158S | SKCM | 1 |
| p.D297N | STAD | 1 |
| Top |
| TissGeneCNV for DPEP3 |
| Copy number variations of TissGene across 28 cancer types (X-axis: cancer type and Y-axis: % of CNV samples) (TCGA Gistic2_CopyNumber_Gistic2_all_data_by_genes, Gistic2 copy number data, version 2016-08-16) |
 |
| Top |
| TissGeneFusions for DPEP3 |
| Fusion genes including TissGene (ChimerDB 3.0, 2016-12-01 and TCGA fusion Portal 2015-12-01) |
| Database | Src | Cancer type | Sample | Fusion gene | ORF | 5'-gene BP | 3'-gene BP |
| Top |
| TissGeneNet for DPEP3 |
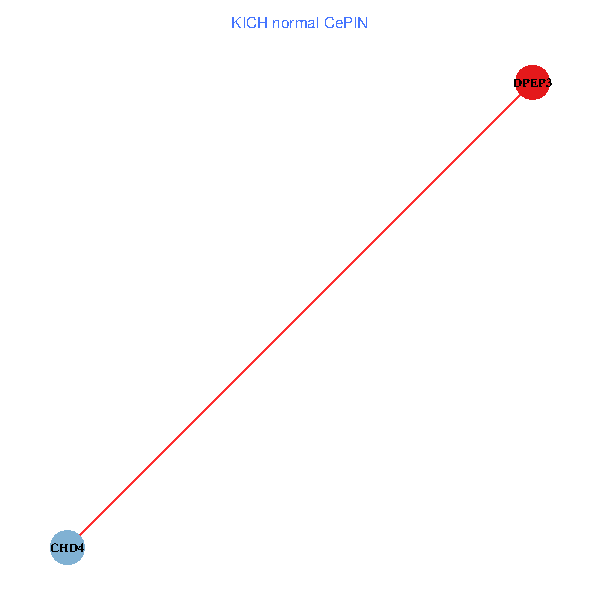
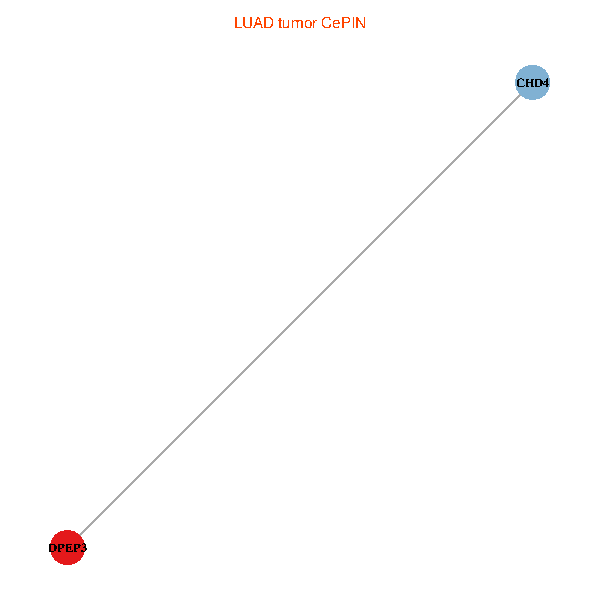
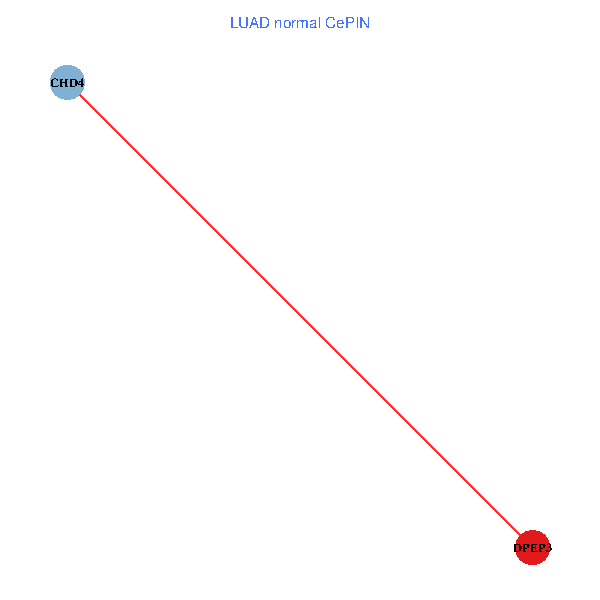
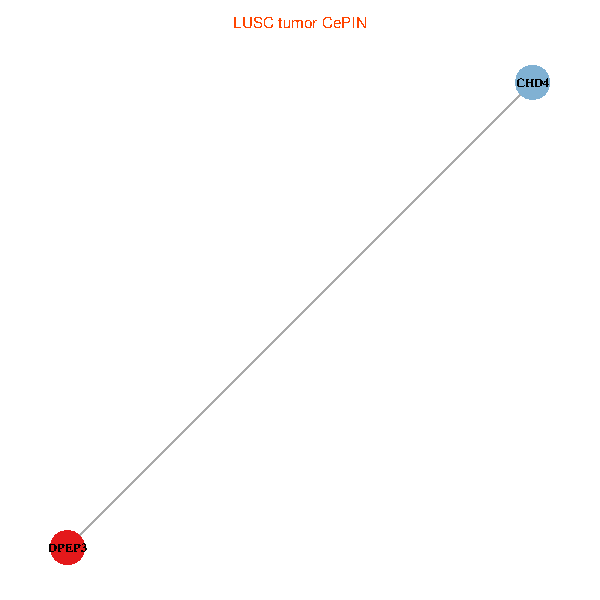
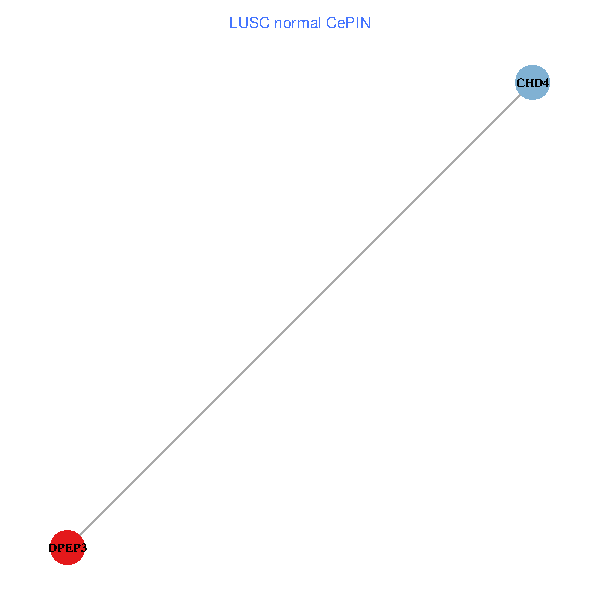
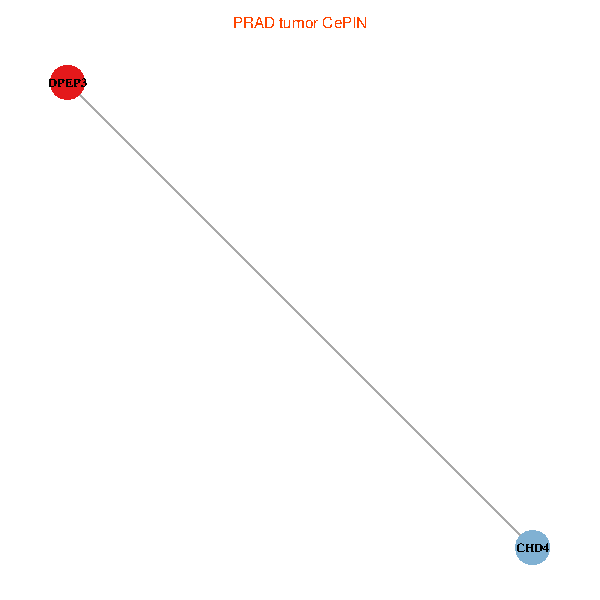
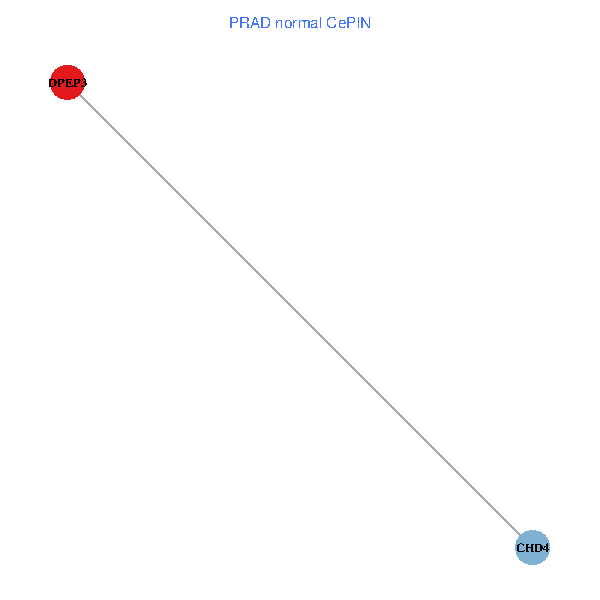
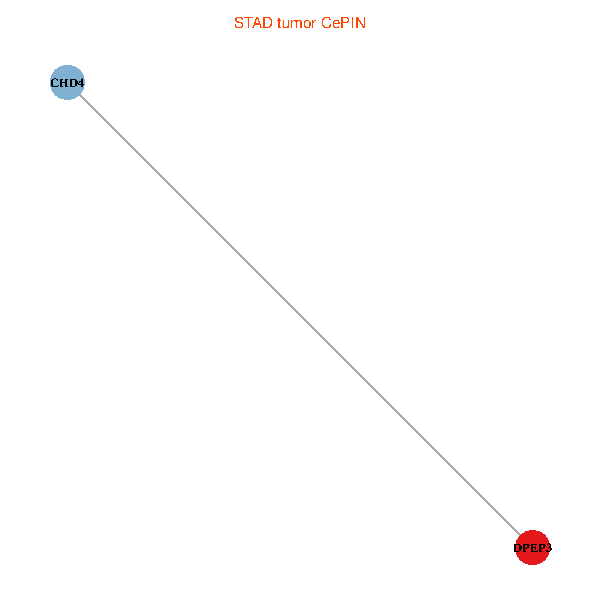
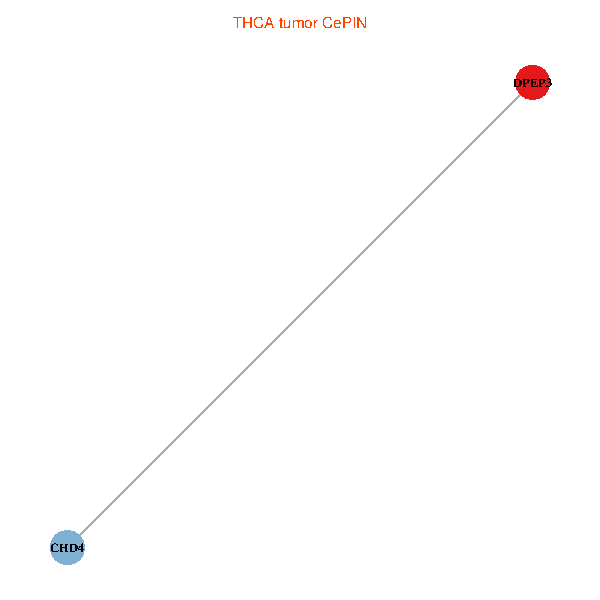
| Co-expressed gene networks based on protein-protein interaction data (CePIN) (TCGA IlluminaHiSeq_RNASeqV2, pan-cancer normalized log2(norm_counts+1) data, version 2016-08-16) (PINA2 ppi data) |
| BRCA (tumor) | BRCA (normal) |
| DPEP3, CHD4 (tumor) | DPEP3, CHD4 (normal) |
 |  |
| COAD (tumor) | COAD (normal) |
| DPEP3, CHD4 (tumor) | DPEP3, CHD4 (normal) |
 |  |
| HNSC (tumor) | HNSC (normal) |
| DPEP3, CHD4 (tumor) | DPEP3, CHD4 (normal) |
 |  |
| KICH (tumor) | KICH (normal) |
| DPEP3, CHD4 (tumor) | DPEP3, CHD4 (normal) |
 |  |
| KIRC (tumor) | KIRC (normal) |
| DPEP3, CHD4 (tumor) | DPEP3, CHD4 (normal) |
 |  |
| KIRP (tumor) | KIRP (normal) |
| DPEP3, CHD4 (tumor) | DPEP3, CHD4 (normal) |
 |  |
| LIHC (tumor) | LIHC (normal) |
| DPEP3, CHD4 (tumor) | DPEP3, CHD4 (normal) |
 |  |
| LUAD (tumor) | LUAD (normal) |
| DPEP3, CHD4 (tumor) | DPEP3, CHD4 (normal) |
 |  |
| LUSC (tumor) | LUSC (normal) |
| DPEP3, CHD4 (tumor) | DPEP3, CHD4 (normal) |
 |  |
| PRAD (tumor) | PRAD (normal) |
| DPEP3, CHD4 (tumor) | DPEP3, CHD4 (normal) |
 |  |
| STAD (tumor) | STAD (normal) |
| DPEP3, CHD4 (tumor) | DPEP3, CHD4 (normal) |
 |  |
| THCA (tumor) | THCA (normal) |
| DPEP3, CHD4 (tumor) | DPEP3, CHD4 (normal) |
 |  |
| Top |
| TissGeneProg for DPEP3 |
| Kaplan-Meier plots with logrank tests of overall survival (OS) using 28 cancer types (TCGA IlluminaHiSeq_RNASeqV2, pan-cancer normalized log2(norm_counts+1) data, version 2016-08-16) (TCGA clinicalMatrix, phenotype data, version 2016-04-27) * Click on the image to enlarge it in a new window. |
 |
| Kaplan-Meier plots with logrank test of relapse free survival (RFS) using 28 cancer types (TCGA IlluminaHiSeq_RNASeqV2, pan-cancer normalized log2(norm_counts+1) data, version 2016-08-16) (TCGA clinicalMatrix, phenotype data, version 2016-04-27) * Click on the image enlarge it in a new window. |
 |
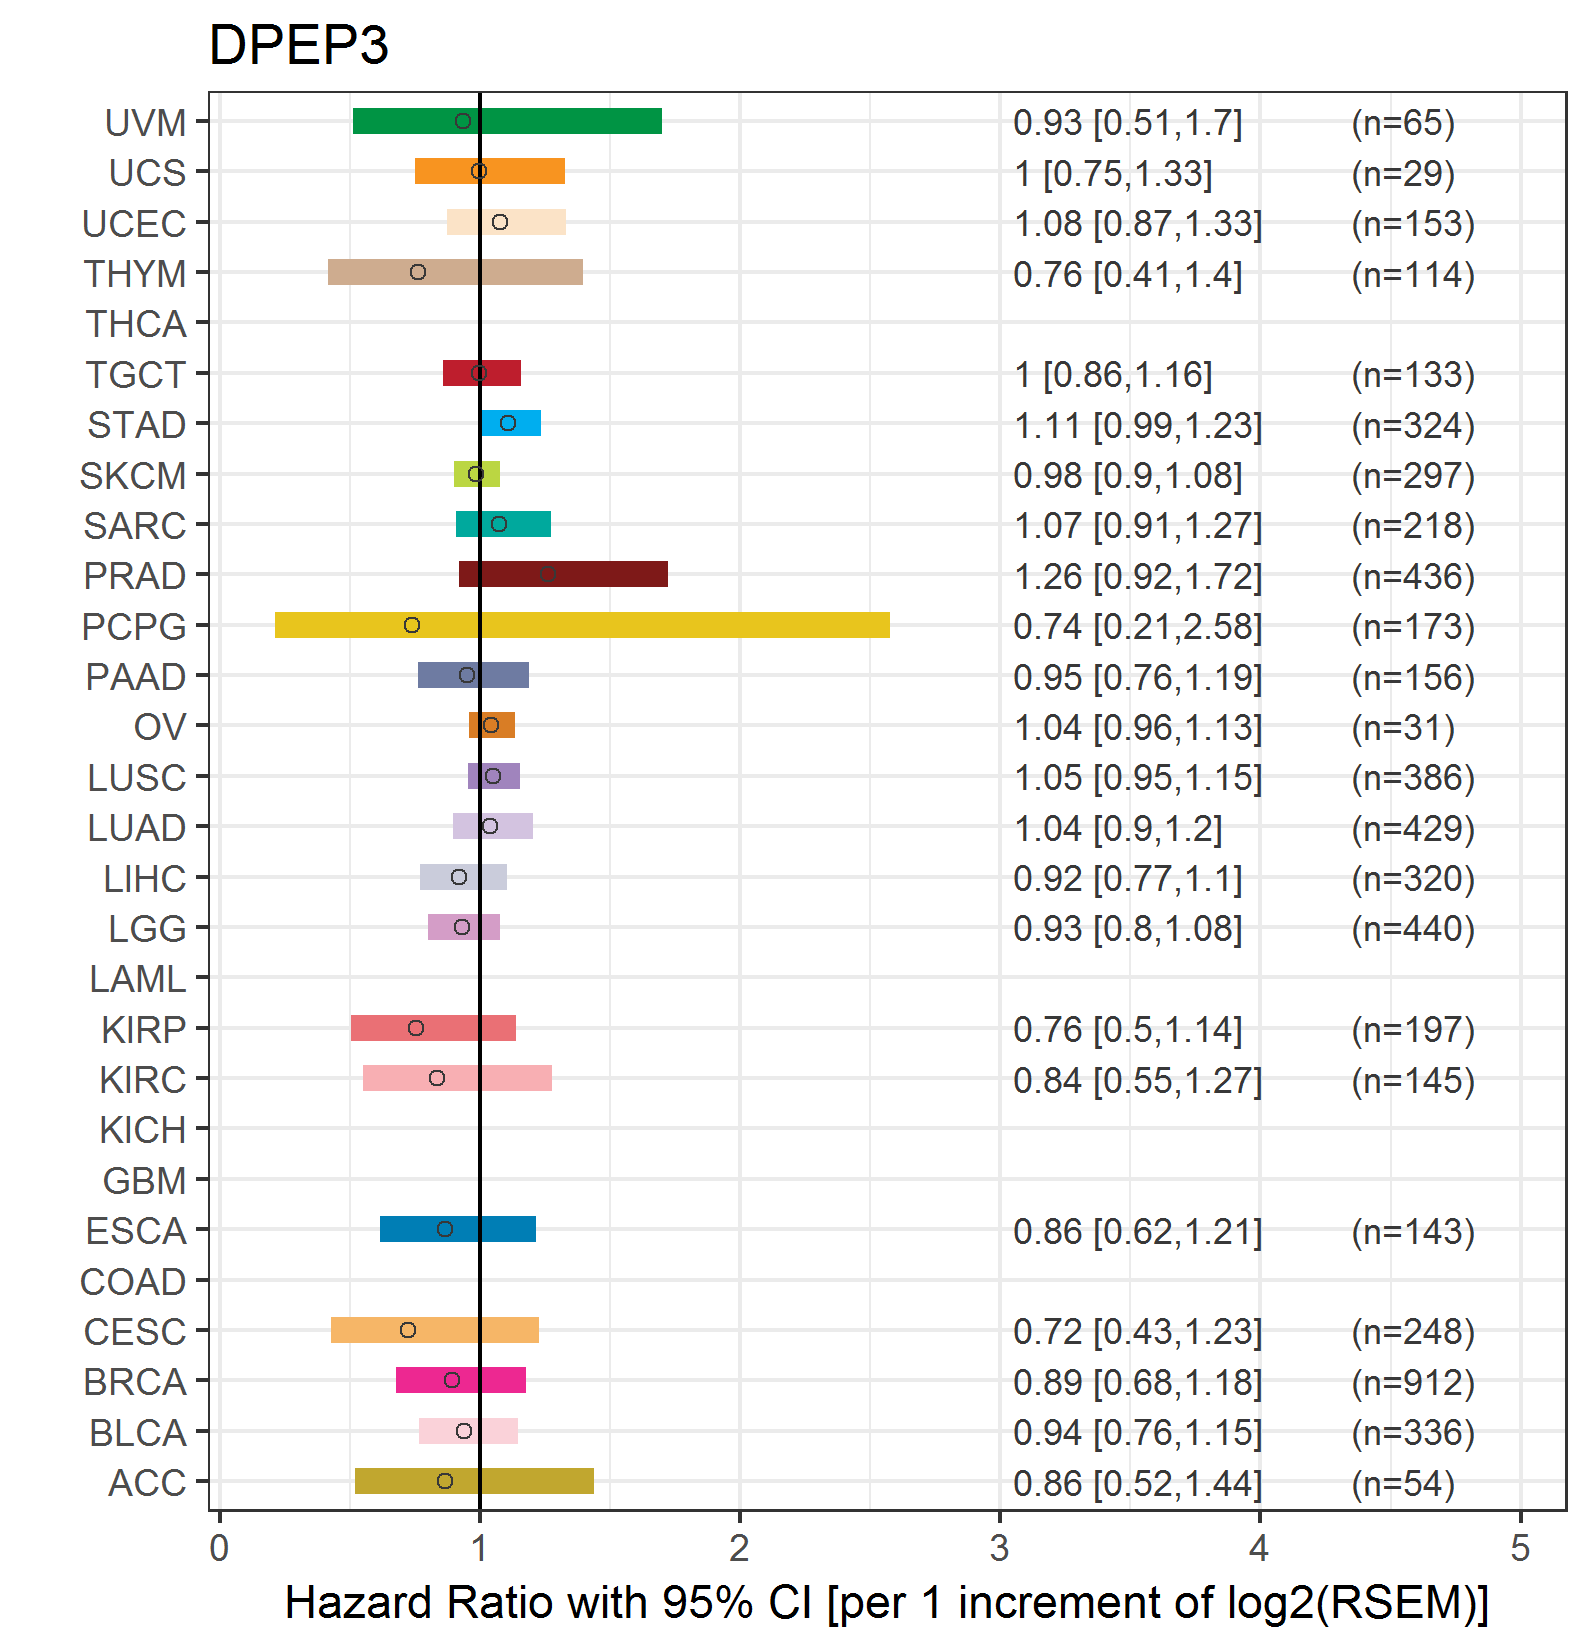
| Forest plot of Cox proportional hazard ratio (HR) and 95% CI of overall survival (OS) using 28 cancer types (TCGA IlluminaHiSeq_RNASeqV2, pan-cancer normalized log2(norm_counts+1) data, version 2016-08-16) (TCGA clinicalMatrix, phenotype data, version 2016-04-27) * Click on the image enlarge it in a new window. |
 |
| Forest plot of Cox proportional hazard ratio (HR) and 95% CI of relapse free survival (RFS) using 28 cancer types (TCGA IlluminaHiSeq_RNASeqV2, pan-cancer normalized log2(norm_counts+1) data, version 2016-08-16) (TCGA clinicalMatrix, phenotype data, version 2016-04-27) * Click on the image enlarge it in a new window. |
 |
| Top |
| TissGeneClin for DPEP3 |
| TissGeneDrug for DPEP3 |
| Drug information targeting TissGene (DrugBank Version 5.0.6, 2017-04-01) |
| DrugBank ID | Drug name | Drug activity | Drug type | Drug status |
| Top |
| TissGeneDisease for DPEP3 |
| Disease information associated with TissGene (DisGeNet, 2016-06-01) |
| Disease ID | Disease name | # pubmeds | Source |
| umls:C0242379 | Malignant neoplasm of lung | 2 | BeFree |
| umls:C0684249 | Carcinoma of lung | 2 | BeFree |
| umls:C0007131 | Non-Small Cell Lung Carcinoma | 1 | BeFree |
| umls:C0017152 | Gastritis | 1 | BeFree |
| umls:C0024140 | Lupus Erythematosus, Subacute Cutaneous | 1 | BeFree |
| umls:C0030809 | Pemphigus Vulgaris | 1 | BeFree |
| umls:C0042900 | Vitiligo | 1 | BeFree |
| umls:C0596263 | Carcinogenesis | 1 | BeFree |
| umls:C1847835 | VITILIGO-ASSOCIATED MULTIPLE AUTOIMMUNE DISEASE SUSCEPTIBILITY 1 (finding) | 1 | BeFree |
|
Copyright 2016-Present - The University of Texas Health Science Center at Houston (UTHealth) Web File Viewing | How to Report, Fraud, Waste and Abuse | State of Texas | Statewide Search | Texas Homeland Security | Site Policies |