 |
| |
| |
| |
| |
| |
| |
|

| TissGeneSummary for DAGLA |
 Gene summary Gene summary |
| Basic gene information | Gene symbol | DAGLA |
| Gene name | diacylglycerol lipase, alpha | |
| Synonyms | C11orf11|DAGL(ALPHA)|DAGLALPHA|NSDDR | |
| Cytomap | UCSC genome browser: 11q12.2 | |
| Type of gene | protein-coding | |
| RefGenes | NM_006133.2, | |
| Description | DGL-alphaneural stem cell-derived dendrite regulatorsn1-specific diacylglycerol lipase alpha | |
| Modification date | 20141207 | |
| dbXrefs | MIM : 614015 | |
| HGNC : HGNC | ||
| Ensembl : ENSG00000134780 | ||
| HPRD : 07092 | ||
| Vega : OTTHUMG00000168160 | ||
| Protein | UniProt: go to UniProt's Cross Reference DB Table | |
| Expression | CleanEX: HS_DAGLA | |
| BioGPS: 747 | ||
| Pathway | NCI Pathway Interaction Database: DAGLA | |
| KEGG: DAGLA | ||
| REACTOME: DAGLA | ||
| Pathway Commons: DAGLA | ||
| Context | iHOP: DAGLA | |
| ligand binding site mutation search in PubMed: DAGLA | ||
| UCL Cancer Institute: DAGLA | ||
| Assigned class in TissGDB* | C | |
| Included tissue-specific gene expression resources | HPA,TiGER | |
| Specific-tissues in normal samples (assigned by TissGDB using HPA, TiGER, and GTEx) | BrainPancreas | |
| Cancer types related to the specific-tissues in cancer samples (assigned by TissGDB using TCGA) | GBM,LGGPAAD | |
| Reference showing the relevant tissue of DAGLA | ||
| Description by TissGene annotations | ||
| * Class A consists of genes with literature evidence and is part of the cTissGenes. Class B consists of only cTissGenes without additional evidence. The remaining genes belong to Class C. |
| Gene ontology having evidence of Inferred from Direct Assay (IDA) from Entrez |
| GO ID | GO term | PubMed ID | GO:0019369 | arachidonic acid metabolic process | 14610053 | GO:0042136 | neurotransmitter biosynthetic process | 14610053 | GO:0046340 | diacylglycerol catabolic process | 14610053 | GO:0019369 | arachidonic acid metabolic process | 14610053 | GO:0042136 | neurotransmitter biosynthetic process | 14610053 | GO:0046340 | diacylglycerol catabolic process | 14610053 |
| Top |
| TissGeneExp for DAGLA |
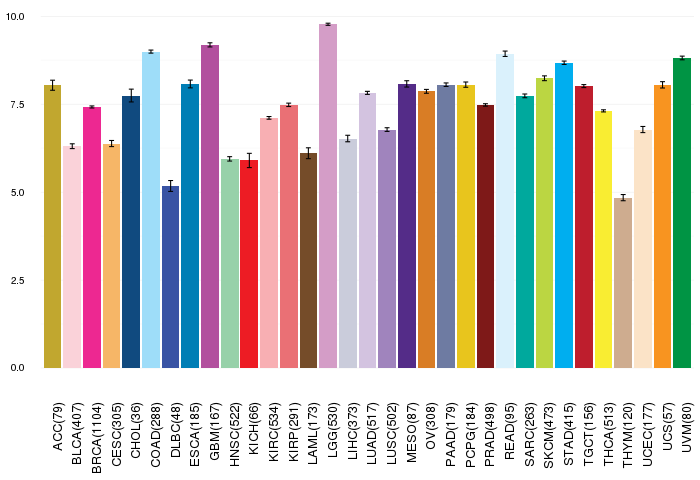
| Gene expressions across 28 cancer types (X-axis: cancer type and Y-axis: log2(norm_counts+1)) (TCGA IlluminaHiSeq_RNASeqV2, pan-cancer normalized log2(norm_counts+1) data, version 2016-08-16) |
 |
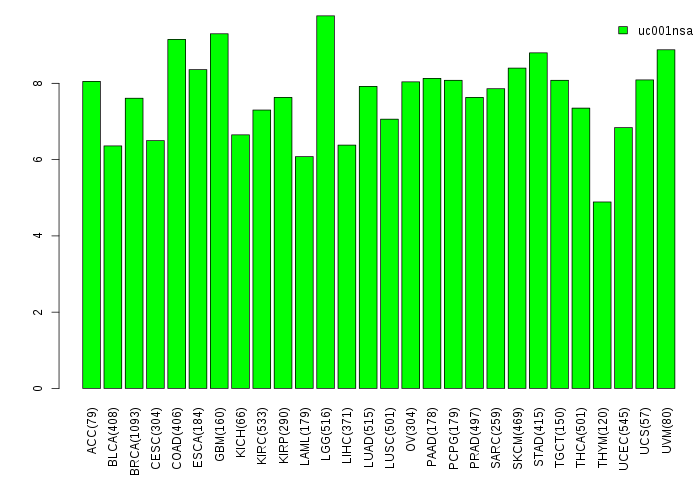
| Gene isoform expressions across 28 cancer types (X-axis: cancer type and Y-axis: log2(norm_counts+1)) (TCGA pan-cancer tcga_rsem_isoform_tpm, version 2016-09-01) |
 |
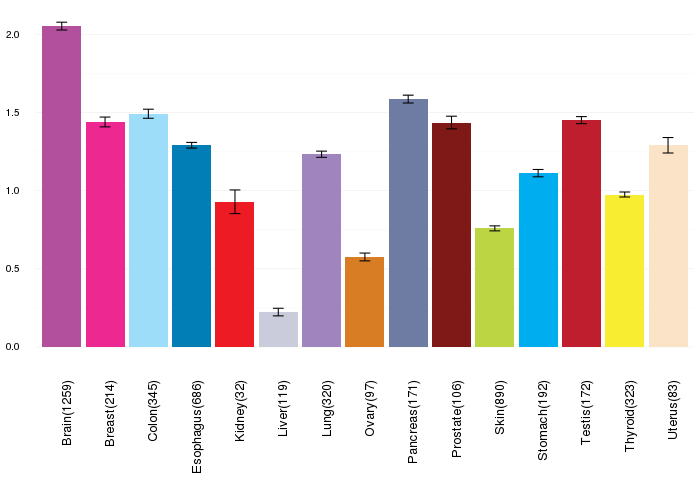
| Gene expressions across normal tissues of GTEx data (GTEx GTEx_Analysis_v6_RNA-seq_RNA-SeQCv1.1.8_gene_rpkm.gct) - Here, we shows the matched tissue types only among our 28 cancer types. |
 |
| Different expressions across 14 cancer types with more than 10 samples between matched tumors and normals (X-axis: cancer type and Y-axis: log2(norm_counts+1)) (TCGA IlluminaHiSeq_RNASeqV2, pan-cancer normalized log2(norm_counts+1) data, version 2016-08-16) |
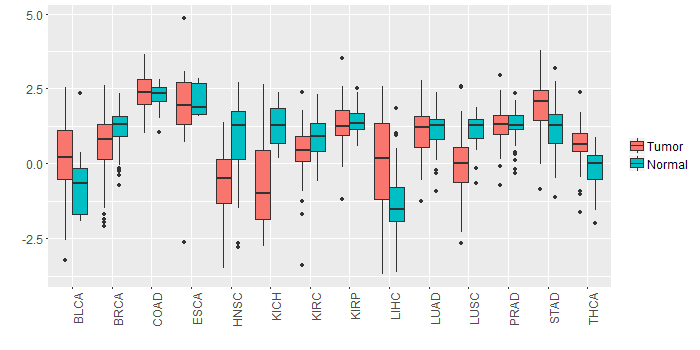 |
| - Significantly differentially expressed cancer types and information. (|Fold change|>1 and FDR<0.05) |
| Cancer type | Mean(exp) in tumor | Mean(exp) in matched normal | Log2FC | P-val. | FDR |
| KICH | -0.648038105 | 1.320673895 | -1.968712 | 1.96E-06 | 7.05E-06 |
| HNSC | -0.615078943 | 0.841565243 | -1.456644186 | 5.15E-07 | 4.23E-06 |
| LUSC | 0.048114993 | 1.172156169 | -1.124041176 | 9.52E-10 | 3.26E-09 |
| LIHC | -0.085564105 | -1.317496105 | 1.231932 | 5.97E-05 | 0.000216656 |
| Top |
| TissGene-miRNA for DAGLA |
| Significantly anti-correlated miRNAs of TissGene across 28 cancer types (Gene-miRNA relations from TargetScanHuman Relsease 7.1, Conserved_Site_Context_Scores.txt.zip, 06.01.2016) (TCGA IlluminaHiSeq_miRNASeq, log2(RPM+1) data, version 2016-11-21) (TCGA IlluminaHiSeq_RNASeqV2, log2(normalized_count+1) data, version 2016-08-16) (Spearman’s Rank Correlation (p-value<0.05 and coefficient<-0.25)) |
| Cancer type | miRNA id | miRNA accession | P-val. | Coeff. | # samples |
| Top |
| TissGeneMut for DAGLA |
| TissGeneSNV for DAGLA |
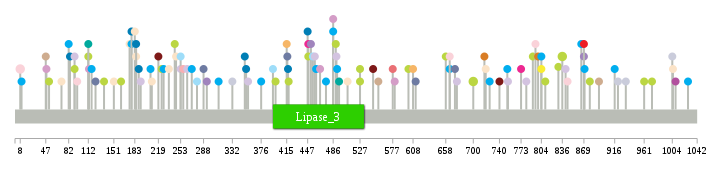
| nsSNV counts per each loci. Different colors of circles represent different cancer types. Circle size denotes number of samples. (TCGA somatic mutation (SNPs and small INDELs) data, version 2016-04-25) * Click on the image to enlarge it in a new window. |
 |
 |
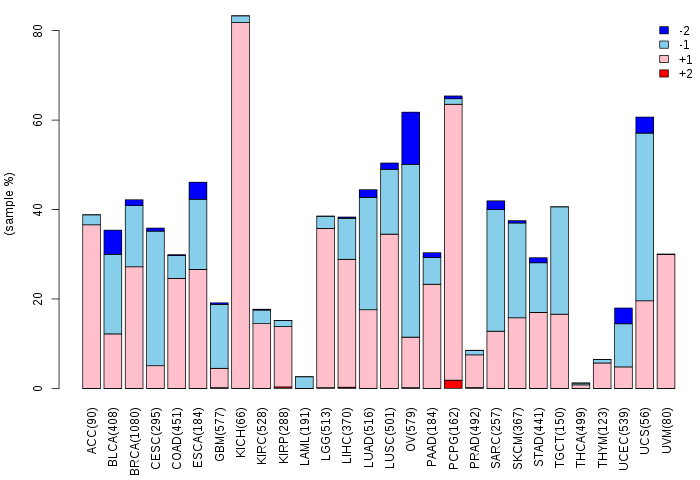
| Somatic nucleotide variants of TissGene across 28 cancer types (X-axis: cancer type and Y-axis: % of mutated samples) The numbers in parentheses are numbers of samples with mutation (nsSNVs). (TCGA somatic mutation (SNPs and small INDELs) data, version 2016-04-25) |
 |
| - nsSNVs sorted by frequency. |
| AAchange | Cancer type | # samples |
| p.S836L | SKCM | 2 |
| p.R8Q | BLCA | 2 |
| p.P700S | SKCM | 2 |
| p.L988V | DLBC | 2 |
| p.P490S | SKCM | 1 |
| p.L492F | STAD | 1 |
| p.L466V | LGG | 1 |
| p.R91L | LUAD | 1 |
| p.Y123H | PAAD | 1 |
| p.R227Q | STAD | 1 |
| p.A376V | STAD | 1 |
| p.M447I | ESCA | 1 |
| p.P870L | STAD | 1 |
| p.V608M | CESC | 1 |
| p.D717A | OV | 1 |
| p.C293Y | LUSC | 1 |
| p.R288H | PAAD | 1 |
| p.S791C | SKCM | 1 |
| p.Q752H | STAD | 1 |
| p.G799A | OV | 1 |
| p.T192S | LUAD | 1 |
| p.R185S | ESCA | 1 |
| p.R178W | ESCA | 1 |
| p.G458C | LUAD | 1 |
| p.L577M | KIRP | 1 |
| p.P601Q | SKCM | 1 |
| p.A452S | LUSC | 1 |
| p.P418L | SKCM | 1 |
| p.R311W | STAD | 1 |
| p.T1004K | LIHC | 1 |
| p.E415V | HNSC | 1 |
| p.R227Q | DLBC | 1 |
| p.A672T | PAAD | 1 |
| p.L263F | LUAD | 1 |
| p.R178W | STAD | 1 |
| p.R185H | UCEC | 1 |
| p.E664K | STAD | 1 |
| p.R356L | LUAD | 1 |
| p.R547* | HNSC | 1 |
| p.R869W | KICH | 1 |
| p.E664K | BLCA | 1 |
| p.I151V | UCEC | 1 |
| p.V448I | SKCM | 1 |
| p.S1009N | GBM | 1 |
| p.S675F | LUAD | 1 |
| p.S52F | SKCM | 1 |
| p.L841P | LUAD | 1 |
| p.V394M | COAD | 1 |
| p.I113T | LGG | 1 |
| p.R892S | THYM | 1 |
| p.S905L | HNSC | 1 |
| p.G189S | ESCA | 1 |
| p.E415Q | CESC | 1 |
| p.L278F | COAD | 1 |
| p.R175H | UCEC | 1 |
| p.A253T | COAD | 1 |
| p.E878K | SKCM | 1 |
| p.R740Q | HNSC | 1 |
| p.A253T | LUAD | 1 |
| p.R10C | STAD | 1 |
| p.G84C | ESCA | 1 |
| p.V865I | STAD | 1 |
| p.G1028E | STAD | 1 |
| p.A219T | PRAD | 1 |
| p.F916L | STAD | 1 |
| p.L481F | HNSC | 1 |
| p.I555T | THYM | 1 |
| p.R486H | LGG | 1 |
| p.Q95P | BLCA | 1 |
| p.P47L | THYM | 1 |
| p.A112V | SKCM | 1 |
| p.L136F | SKCM | 1 |
| p.R740W | PRAD | 1 |
| p.R773Q | BRCA | 1 |
| p.P527L | SKCM | 1 |
| p.T580M | LGG | 1 |
| p.P527S | SKCM | 1 |
| p.R547Q | PRAD | 1 |
| p.R246W | UCEC | 1 |
| p.L417P | ESCA | 1 |
| p.T207M | STAD | 1 |
| p.R183L | UCEC | 1 |
| p.P973S | SKCM | 1 |
| p.R162H | SKCM | 1 |
| p.R244W | SKCM | 1 |
| p.E830K | SKCM | 1 |
| p.R455Q | COAD | 1 |
| p.D235N | UCEC | 1 |
| p.R398W | SKCM | 1 |
| p.G658R | SKCM | 1 |
| p.R91C | SKCM | 1 |
| p.P1005H | UCEC | 1 |
| p.G460R | STAD | 1 |
| p.R804W | STAD | 1 |
| p.V117A | STAD | 1 |
| p.I71V | UCEC | 1 |
| p.R719C | UCEC | 1 |
| p.H612P | PAAD | 1 |
| p.R869P | LUSC | 1 |
| p.R332G | LIHC | 1 |
| p.R82H | STAD | 1 |
| p.E224K | SKCM | 1 |
| p.V38M | HNSC | 1 |
| p.D844N | BLCA | 1 |
| p.R486H | STAD | 1 |
| p.F495L | SARC | 1 |
| p.R416C | PAAD | 1 |
| p.A353V | ESCA | 1 |
| p.R961C | SKCM | 1 |
| p.R804W | THCA | 1 |
| p.V448A | BRCA | 1 |
| p.R795H | BLCA | 1 |
| p.F921I | LIHC | 1 |
| p.D753H | LUAD | 1 |
| p.E781D | LUAD | 1 |
| p.T491N | LUAD | 1 |
| p.E257K | KIRC | 1 |
| p.A475T | STAD | 1 |
| p.L933V | LIHC | 1 |
| p.P270S | STAD | 1 |
| p.H810Q | SKCM | 1 |
| p.E217K | HNSC | 1 |
| p.S725G | STAD | 1 |
| p.A112V | SARC | 1 |
| p.A351P | ESCA | 1 |
| p.A508V | UCEC | 1 |
| p.D209E | UCEC | 1 |
| p.H48Y | LGG | 1 |
| Top |
| TissGeneCNV for DAGLA |
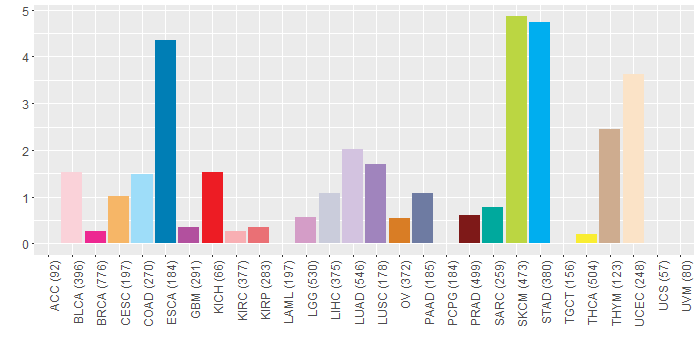
| Copy number variations of TissGene across 28 cancer types (X-axis: cancer type and Y-axis: % of CNV samples) (TCGA Gistic2_CopyNumber_Gistic2_all_data_by_genes, Gistic2 copy number data, version 2016-08-16) |
 |
| Top |
| TissGeneFusions for DAGLA |
| Fusion genes including TissGene (ChimerDB 3.0, 2016-12-01 and TCGA fusion Portal 2015-12-01) |
| Database | Src | Cancer type | Sample | Fusion gene | ORF | 5'-gene BP | 3'-gene BP |
| Chimerdb3.0 | ChiTaRs | NA | CB409589 | DAGLA-DAGLA | chr11:61513568 | chr11:61514292 | |
| TCGAfusionPortal | PRADA | BRCA | TCGA-OL-A66I-01A | DAGLA-C11orf66 | CDS-5UTR | Chr11:61487722 | Chr11:61249254 |
| Top |
| TissGeneNet for DAGLA |
| Co-expressed gene networks based on protein-protein interaction data (CePIN) (TCGA IlluminaHiSeq_RNASeqV2, pan-cancer normalized log2(norm_counts+1) data, version 2016-08-16) (PINA2 ppi data) |
| Top |
| TissGeneProg for DAGLA |
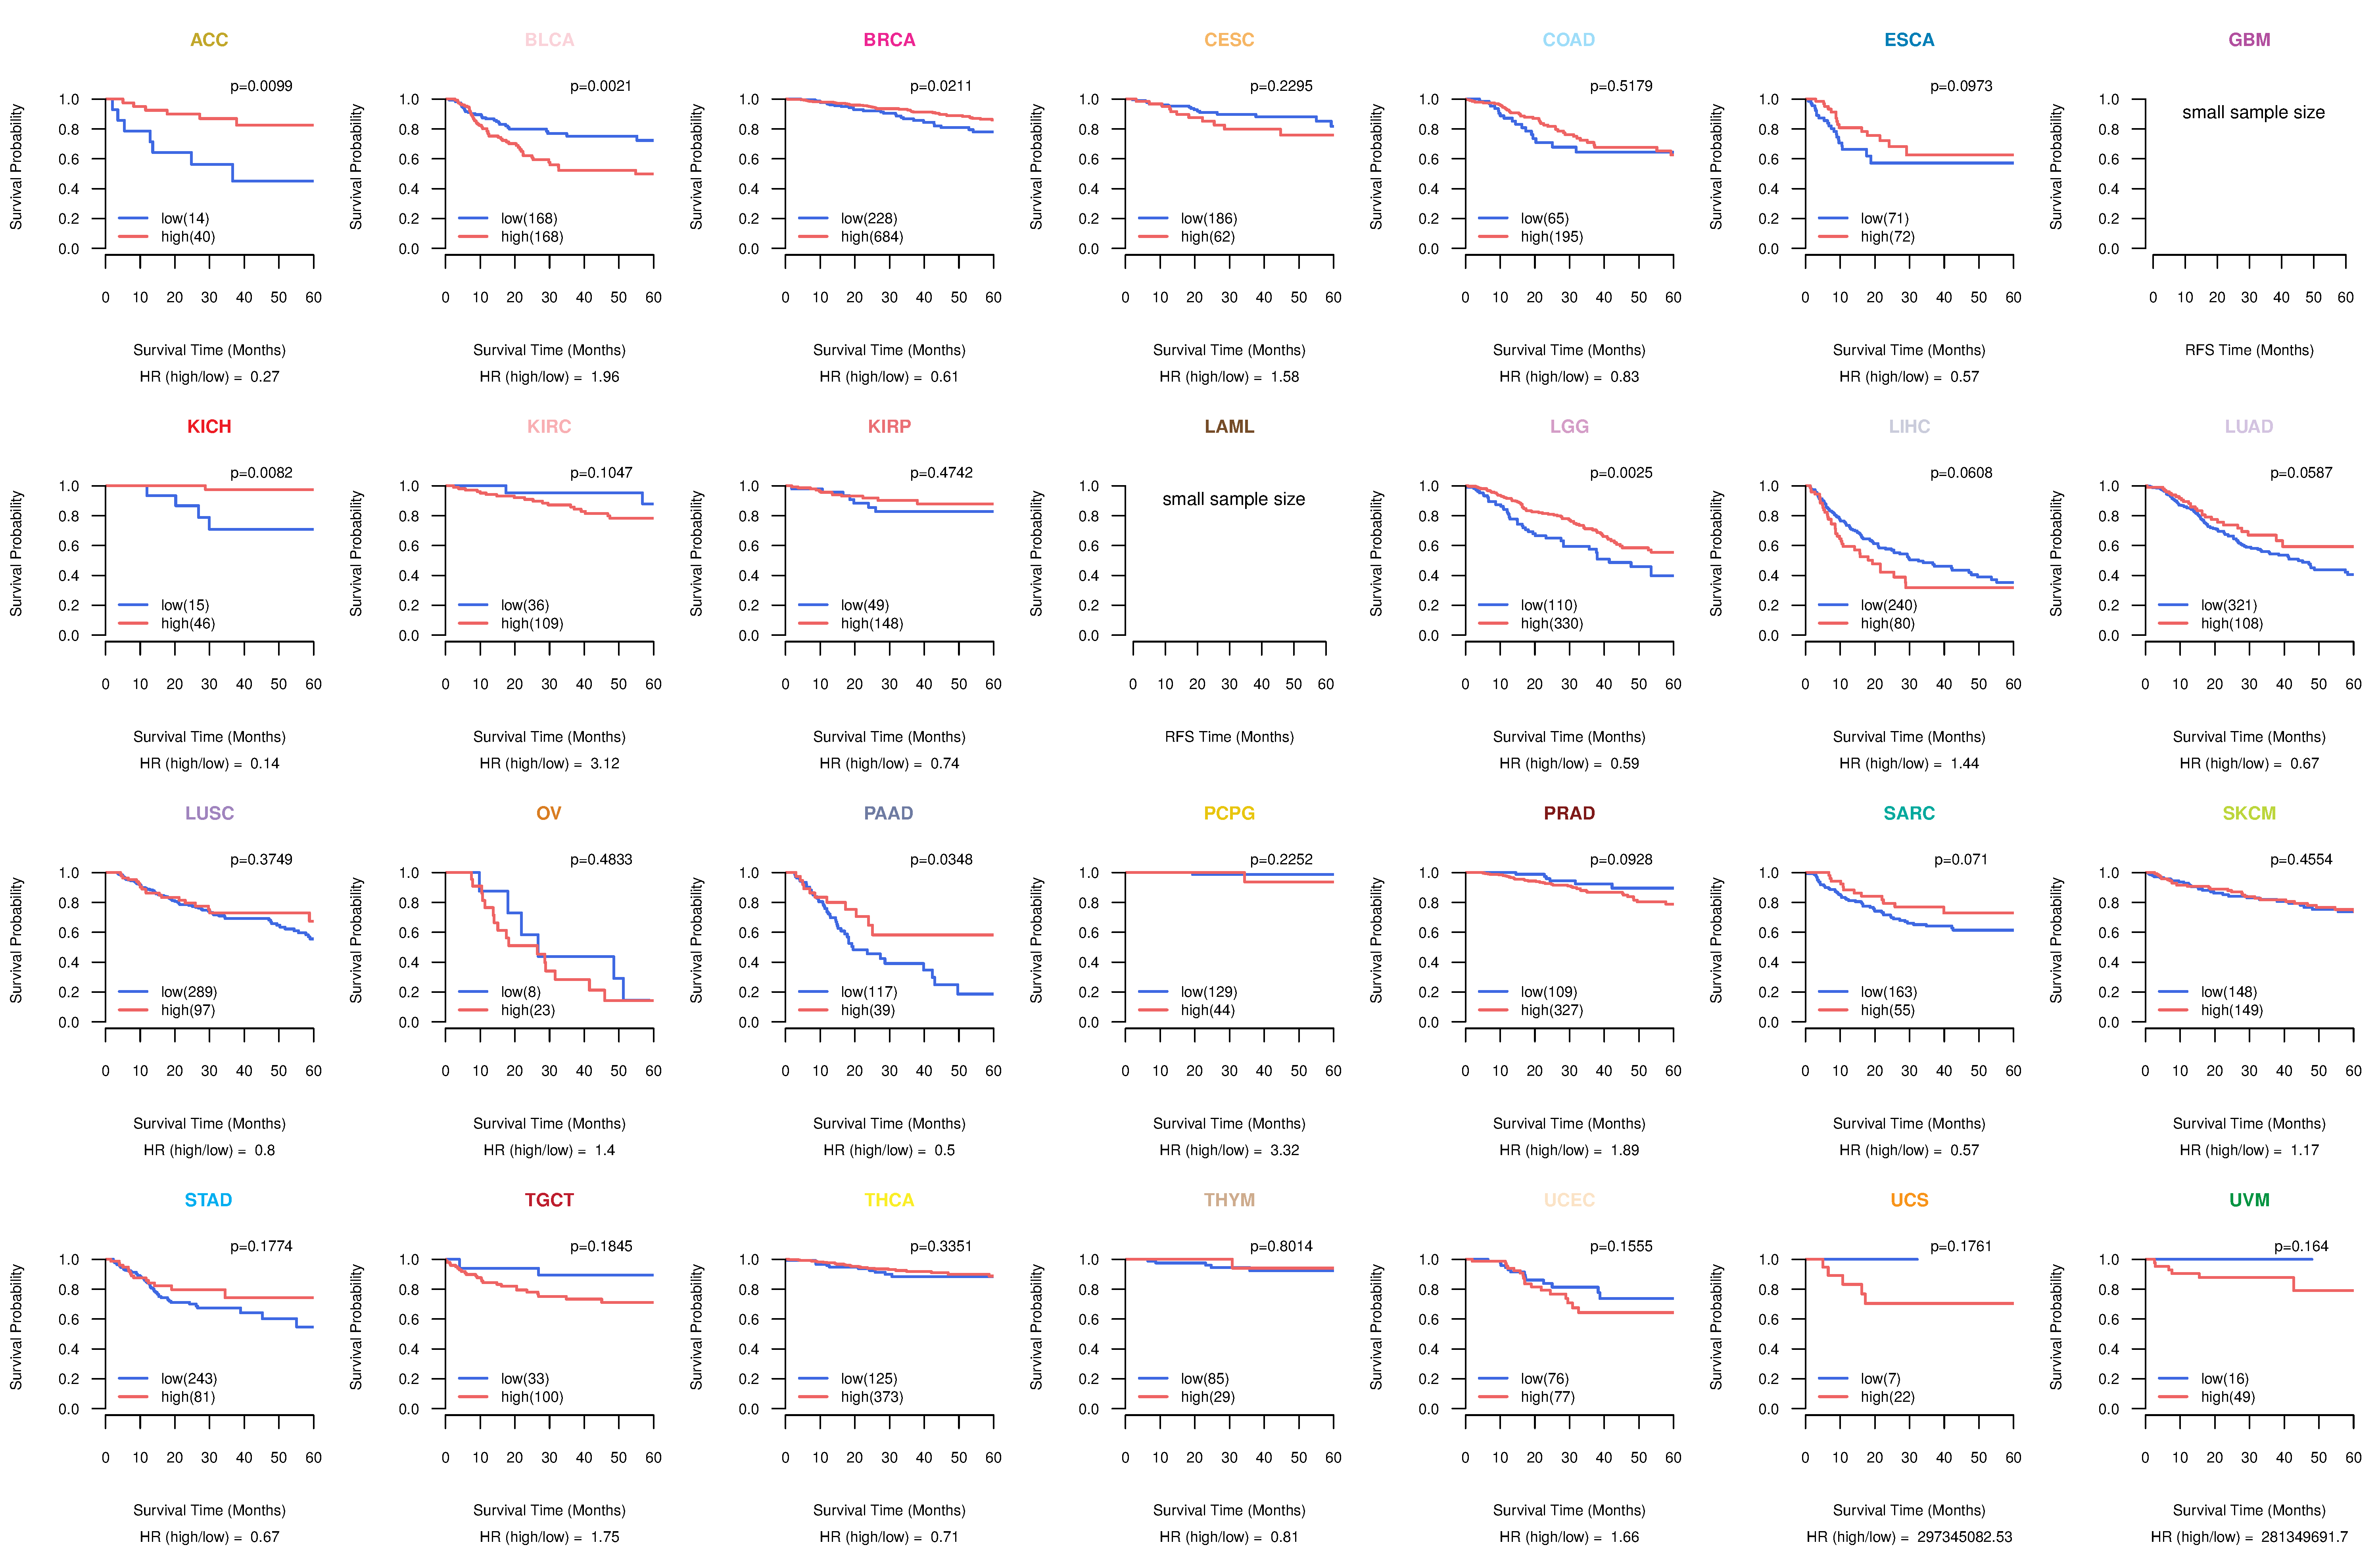
| Kaplan-Meier plots with logrank tests of overall survival (OS) using 28 cancer types (TCGA IlluminaHiSeq_RNASeqV2, pan-cancer normalized log2(norm_counts+1) data, version 2016-08-16) (TCGA clinicalMatrix, phenotype data, version 2016-04-27) * Click on the image to enlarge it in a new window. |
 |
| Kaplan-Meier plots with logrank test of relapse free survival (RFS) using 28 cancer types (TCGA IlluminaHiSeq_RNASeqV2, pan-cancer normalized log2(norm_counts+1) data, version 2016-08-16) (TCGA clinicalMatrix, phenotype data, version 2016-04-27) * Click on the image enlarge it in a new window. |
 |
| Forest plot of Cox proportional hazard ratio (HR) and 95% CI of overall survival (OS) using 28 cancer types (TCGA IlluminaHiSeq_RNASeqV2, pan-cancer normalized log2(norm_counts+1) data, version 2016-08-16) (TCGA clinicalMatrix, phenotype data, version 2016-04-27) * Click on the image enlarge it in a new window. |
 |
| Forest plot of Cox proportional hazard ratio (HR) and 95% CI of relapse free survival (RFS) using 28 cancer types (TCGA IlluminaHiSeq_RNASeqV2, pan-cancer normalized log2(norm_counts+1) data, version 2016-08-16) (TCGA clinicalMatrix, phenotype data, version 2016-04-27) * Click on the image enlarge it in a new window. |
 |
| Top |
| TissGeneClin for DAGLA |
| TissGeneDrug for DAGLA |
| Drug information targeting TissGene (DrugBank Version 5.0.6, 2017-04-01) |
| DrugBank ID | Drug name | Drug activity | Drug type | Drug status |
| Top |
| TissGeneDisease for DAGLA |
| Disease information associated with TissGene (DisGeNet, 2016-06-01) |
| Disease ID | Disease name | # pubmeds | Source |
| umls:C0036341 | Schizophrenia | 1 | BeFree |
|
Copyright 2016-Present - The University of Texas Health Science Center at Houston (UTHealth) Web File Viewing | How to Report, Fraud, Waste and Abuse | State of Texas | Statewide Search | Texas Homeland Security | Site Policies |