 |
| |
| |
| |
| |
| |
| |
|

| TissGeneSummary for ZMAT4 |
 Gene summary Gene summary |
| Basic gene information | Gene symbol | ZMAT4 |
| Gene name | zinc finger, matrin-type 4 | |
| Synonyms | - | |
| Cytomap | UCSC genome browser: 8p11.21 | |
| Type of gene | protein-coding | |
| RefGenes | NM_001135731.1, NM_024645.2, | |
| Description | zinc finger matrin-type protein 4zinc finger, matrin type 4 | |
| Modification date | 20141207 | |
| dbXrefs | HGNC : HGNC | |
| Ensembl : ENSG00000165061 | ||
| HPRD : 07837 | ||
| Vega : OTTHUMG00000164049 | ||
| Protein | UniProt: go to UniProt's Cross Reference DB Table | |
| Expression | CleanEX: HS_ZMAT4 | |
| BioGPS: 79698 | ||
| Pathway | NCI Pathway Interaction Database: ZMAT4 | |
| KEGG: ZMAT4 | ||
| REACTOME: ZMAT4 | ||
| Pathway Commons: ZMAT4 | ||
| Context | iHOP: ZMAT4 | |
| ligand binding site mutation search in PubMed: ZMAT4 | ||
| UCL Cancer Institute: ZMAT4 | ||
| Assigned class in TissGDB* | C | |
| Included tissue-specific gene expression resources | TiGER,GTEx | |
| Specific-tissues in normal samples (assigned by TissGDB using HPA, TiGER, and GTEx) | Thyroid glandEye | |
| Cancer types related to the specific-tissues in cancer samples (assigned by TissGDB using TCGA) | THCAUVM | |
| Reference showing the relevant tissue of ZMAT4 | ||
| Description by TissGene annotations | Have significant anti-correlated miRNA Fused withTSGene Fused withOncogene | |
| * Class A consists of genes with literature evidence and is part of the cTissGenes. Class B consists of only cTissGenes without additional evidence. The remaining genes belong to Class C. |
| Gene ontology having evidence of Inferred from Direct Assay (IDA) from Entrez |
| GO ID | GO term | PubMed ID |
| Top |
| TissGeneExp for ZMAT4 |
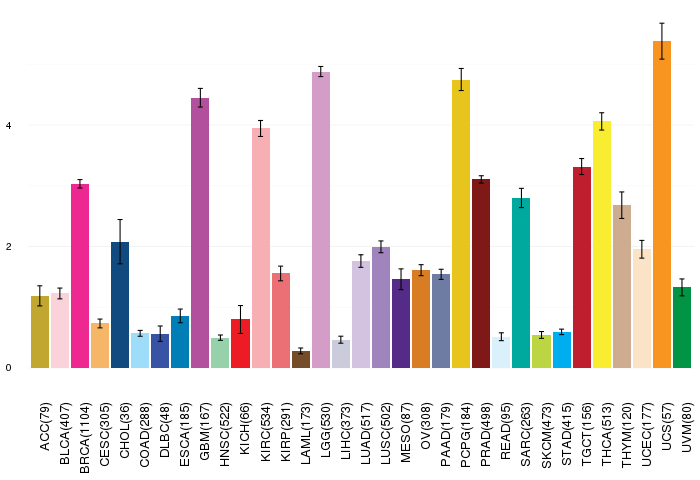
| Gene expressions across 28 cancer types (X-axis: cancer type and Y-axis: log2(norm_counts+1)) (TCGA IlluminaHiSeq_RNASeqV2, pan-cancer normalized log2(norm_counts+1) data, version 2016-08-16) |
 |
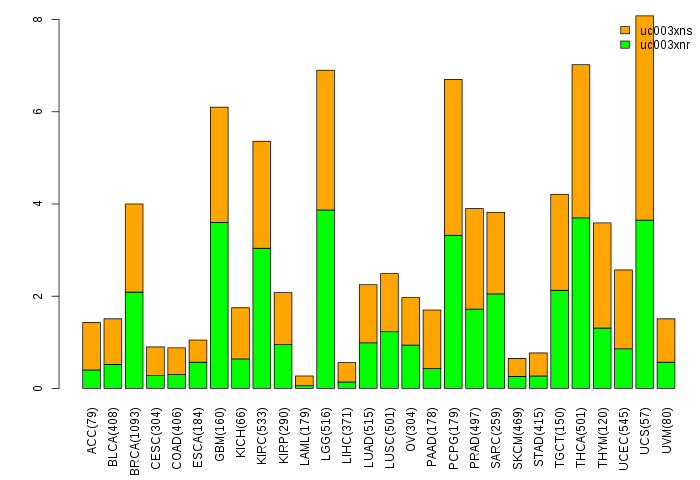
| Gene isoform expressions across 28 cancer types (X-axis: cancer type and Y-axis: log2(norm_counts+1)) (TCGA pan-cancer tcga_rsem_isoform_tpm, version 2016-09-01) |
 |
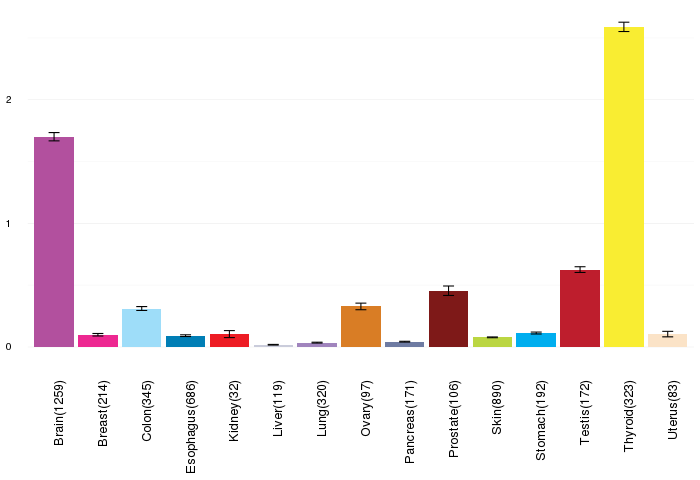
| Gene expressions across normal tissues of GTEx data (GTEx GTEx_Analysis_v6_RNA-seq_RNA-SeQCv1.1.8_gene_rpkm.gct) - Here, we shows the matched tissue types only among our 28 cancer types. |
 |
| Different expressions across 14 cancer types with more than 10 samples between matched tumors and normals (X-axis: cancer type and Y-axis: log2(norm_counts+1)) (TCGA IlluminaHiSeq_RNASeqV2, pan-cancer normalized log2(norm_counts+1) data, version 2016-08-16) |
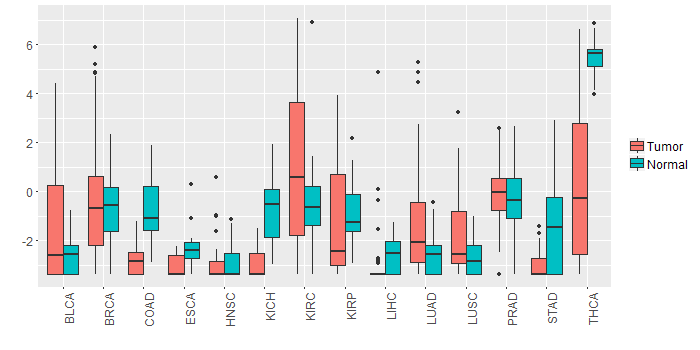 |
| - Significantly differentially expressed cancer types and information. (|Fold change|>1 and FDR<0.05) |
| Cancer type | Mean(exp) in tumor | Mean(exp) in matched normal | Log2FC | P-val. | FDR |
| COAD | -2.771353649 | -0.734080572 | -2.037273077 | 7.36E-09 | 6.78E-08 |
| THCA | 0.392921449 | 5.523963821 | -5.131042373 | 1.81E-17 | 3.75E-16 |
| KICH | -2.957080111 | -0.613968111 | -2.343112 | 3.38E-09 | 1.92E-08 |
| KIRC | 0.846210667 | -0.532089333 | 1.3783 | 0.000694 | 0.001329277 |
| LUAD | -1.332664525 | -2.602193835 | 1.26952931 | 0.000117 | 0.000292565 |
| STAD | -3.032329611 | -1.305557736 | -1.726771875 | 1.32E-05 | 0.000146964 |
| Top |
| TissGene-miRNA for ZMAT4 |
| Significantly anti-correlated miRNAs of TissGene across 28 cancer types (Gene-miRNA relations from TargetScanHuman Relsease 7.1, Conserved_Site_Context_Scores.txt.zip, 06.01.2016) (TCGA IlluminaHiSeq_miRNASeq, log2(RPM+1) data, version 2016-11-21) (TCGA IlluminaHiSeq_RNASeqV2, log2(normalized_count+1) data, version 2016-08-16) (Spearman’s Rank Correlation (p-value<0.05 and coefficient<-0.25)) |
| Cancer type | miRNA id | miRNA accession | P-val. | Coeff. | # samples |
| UCS | hsa-miR-96-5p | MIMAT0000095 | 0.024 | -0.3 | 56 |
| Top |
| TissGeneMut for ZMAT4 |
| TissGeneSNV for ZMAT4 |
| nsSNV counts per each loci. Different colors of circles represent different cancer types. Circle size denotes number of samples. (TCGA somatic mutation (SNPs and small INDELs) data, version 2016-04-25) * Click on the image to enlarge it in a new window. |
 |
 |
| Somatic nucleotide variants of TissGene across 28 cancer types (X-axis: cancer type and Y-axis: % of mutated samples) The numbers in parentheses are numbers of samples with mutation (nsSNVs). (TCGA somatic mutation (SNPs and small INDELs) data, version 2016-04-25) |
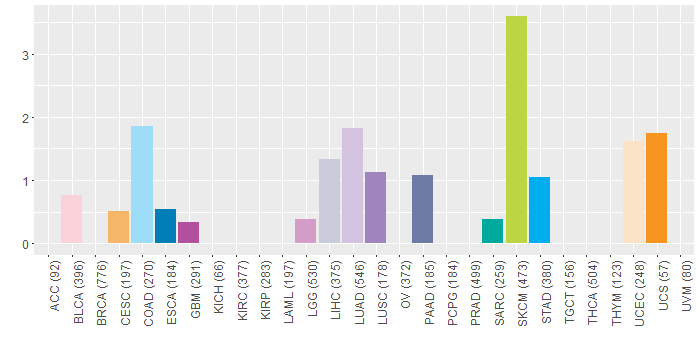 |
| - nsSNVs sorted by frequency. |
| AAchange | Cancer type | # samples |
| p.Q95* | SKCM | 3 |
| p.S92F | SKCM | 2 |
| p.S4F | LIHC | 2 |
| p.Q95X | SKCM | 2 |
| p.D72N | SKCM | 1 |
| p.D69G | BLCA | 1 |
| p.C77S | LUSC | 1 |
| p.R127Q | COAD | 1 |
| p.G148E | COAD | 1 |
| p.T115I | UCEC | 1 |
| p.S136F | SKCM | 1 |
| p.D144H | PAAD | 1 |
| p.L79H | UCEC | 1 |
| p.R36L | LUAD | 1 |
| p.M159I | SKCM | 1 |
| p.G183W | LIHC | 1 |
| p.A135T | PAAD | 1 |
| p.K124R | STAD | 1 |
| p.M188I | LUAD | 1 |
| p.E34K | COAD | 1 |
| p.S204C | LUAD | 1 |
| p.V88M | SKCM | 1 |
| p.V89A | HNSC | 1 |
| p.A57S | STAD | 1 |
| p.Y15C | UCEC | 1 |
| p.Q95E | CESC | 1 |
| p.Q161K | SARC | 1 |
| p.E63K | SKCM | 1 |
| p.Q139X | SKCM | 1 |
| p.V71L | LUAD | 1 |
| p.D91N | STAD | 1 |
| p.H222N | LUAD | 1 |
| p.L186M | LUAD | 1 |
| p.S86L | COAD | 1 |
| p.M188I | SKCM | 1 |
| p.R127W | UCEC | 1 |
| p.A173V | SKCM | 1 |
| p.C16X | COAD | 1 |
| p.R196S | LUSC | 1 |
| p.W153* | LIHC | 1 |
| p.T115I | SKCM | 1 |
| p.L217M | LUAD | 1 |
| p.M128I | SKCM | 1 |
| p.E190K | SKCM | 1 |
| p.R61Q | STAD | 1 |
| p.H99Y | SKCM | 1 |
| p.C147F | LUAD | 1 |
| p.A68D | LUAD | 1 |
| p.P132L | BLCA | 1 |
| p.R145K | SKCM | 1 |
| p.T115I | LGG | 1 |
| p.A174T | SKCM | 1 |
| p.G219A | UCS | 1 |
| p.N208K | ESCA | 1 |
| p.F84L | GBM | 1 |
| p.A90V | LIHC | 1 |
| p.R192* | LUAD | 1 |
| p.D187H | BLCA | 1 |
| p.R127Q | LGG | 1 |
| p.Q139* | SKCM | 1 |
| Top |
| TissGeneCNV for ZMAT4 |
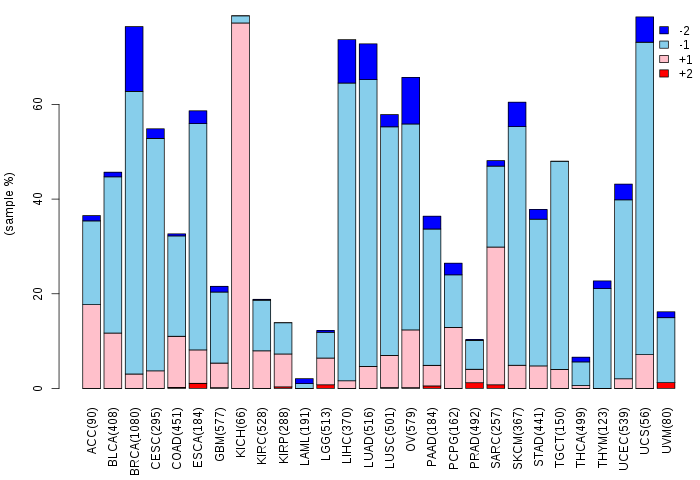
| Copy number variations of TissGene across 28 cancer types (X-axis: cancer type and Y-axis: % of CNV samples) (TCGA Gistic2_CopyNumber_Gistic2_all_data_by_genes, Gistic2 copy number data, version 2016-08-16) |
 |
| Top |
| TissGeneFusions for ZMAT4 |
| Fusion genes including TissGene (ChimerDB 3.0, 2016-12-01 and TCGA fusion Portal 2015-12-01) |
| Database | Src | Cancer type | Sample | Fusion gene | ORF | 5'-gene BP | 3'-gene BP |
| Chimerdb3.0 | ChiTaRs | NA | BY798534 | ZMAT4-ZMAT4 | chr8:40438740 | chr8:40554515 | |
| Chimerdb3.0 | FusionScan | BRCA | TCGA-AC-A2BM-01A | BAG4-ZMAT4 | CDS-5'UTR | chr8:38034657 | chr8:40683199 |
| Chimerdb3.0 | FusionScan | BRCA | TCGA-A2-A0ES-01A | UVRAG-ZMAT4 | In-Frame | chr11:75728024 | chr8:40389757 |
| Chimerdb3.0 | TopHat-Fusion | BRCA | TCGA-A2-A0EX-01A | LSM1-ZMAT4 | CDS-5'UTR | chr8:38027319 | chr8:40695251 |
| Chimerdb3.0 | TopHat-Fusion | BRCA | TCGA-A2-A0EX-01A | LSM1-ZMAT4 | CDS-5'UTR | chr8:38027319 | chr8:40696600 |
| Chimerdb3.0 | TopHat-Fusion | BRCA | TCGA-A2-A0EX-01A | LSM1-ZMAT4 | CDS-5'UTR | chr8:38029482 | chr8:40696600 |
| Chimerdb3.0 | TopHat-Fusion | BRCA | TCGA-EW-A1IX-01A | WHSC1L1-ZMAT4 | Out-of-Frame | chr8:38172164 | chr8:40389756 |
| TCGAfusionPortal | PRADA | BLCA | TCGA-GD-A2C5-01A | GGNBP2-ZMAT4 | Out-of-frame | Chr17:34913176 | Chr8:40554920 |
| TCGAfusionPortal | PRADA | BRCA | TCGA-A2-A0ES-01A | UVRAG-ZMAT4 | In-frame | Chr11:75728024 | Chr8:40389757 |
| TCGAfusionPortal | PRADA | BRCA | TCGA-A2-A0EW-01A | FNTA-ZMAT4 | CDS-5UTR | Chr8:42932507 | Chr8:40683199 |
| TCGAfusionPortal | PRADA | BRCA | TCGA-AC-A2BM-01A | BAG4-ZMAT4 | CDS-5UTR | Chr8:38034657 | Chr8:40683199 |
| TCGAfusionPortal | PRADA | BRCA | TCGA-EW-A1IX-01A | WHSC1L1-ZMAT4 | Out-of-frame | Chr8:38172165 | Chr8:40389757 |
| TCGAfusionPortal | PRADA | LUSC | TCGA-60-2708-01A | SLC20A2-ZMAT4 | 5UTR-CDS | Chr8:42358549 | Chr8:40389757 |
| Top |
| TissGeneNet for ZMAT4 |
| Co-expressed gene networks based on protein-protein interaction data (CePIN) (TCGA IlluminaHiSeq_RNASeqV2, pan-cancer normalized log2(norm_counts+1) data, version 2016-08-16) (PINA2 ppi data) |
| Top |
| TissGeneProg for ZMAT4 |
| Kaplan-Meier plots with logrank tests of overall survival (OS) using 28 cancer types (TCGA IlluminaHiSeq_RNASeqV2, pan-cancer normalized log2(norm_counts+1) data, version 2016-08-16) (TCGA clinicalMatrix, phenotype data, version 2016-04-27) * Click on the image to enlarge it in a new window. |
 |
| Kaplan-Meier plots with logrank test of relapse free survival (RFS) using 28 cancer types (TCGA IlluminaHiSeq_RNASeqV2, pan-cancer normalized log2(norm_counts+1) data, version 2016-08-16) (TCGA clinicalMatrix, phenotype data, version 2016-04-27) * Click on the image enlarge it in a new window. |
 |
| Forest plot of Cox proportional hazard ratio (HR) and 95% CI of overall survival (OS) using 28 cancer types (TCGA IlluminaHiSeq_RNASeqV2, pan-cancer normalized log2(norm_counts+1) data, version 2016-08-16) (TCGA clinicalMatrix, phenotype data, version 2016-04-27) * Click on the image enlarge it in a new window. |
 |
| Forest plot of Cox proportional hazard ratio (HR) and 95% CI of relapse free survival (RFS) using 28 cancer types (TCGA IlluminaHiSeq_RNASeqV2, pan-cancer normalized log2(norm_counts+1) data, version 2016-08-16) (TCGA clinicalMatrix, phenotype data, version 2016-04-27) * Click on the image enlarge it in a new window. |
 |
| Top |
| TissGeneClin for ZMAT4 |
| TissGeneDrug for ZMAT4 |
| Drug information targeting TissGene (DrugBank Version 5.0.6, 2017-04-01) |
| DrugBank ID | Drug name | Drug activity | Drug type | Drug status |
| Top |
| TissGeneDisease for ZMAT4 |
| Disease information associated with TissGene (DisGeNet, 2016-06-01) |
| Disease ID | Disease name | # pubmeds | Source |
| umls:C0034951 | Refractive Errors | 2 | BeFree,GWASCAT |
| umls:C0027092 | Myopia | 1 | BeFree |
|
Copyright 2016-Present - The University of Texas Health Science Center at Houston (UTHealth) Web File Viewing | How to Report, Fraud, Waste and Abuse | State of Texas | Statewide Search | Texas Homeland Security | Site Policies |