 |
| |
| |
| |
| |
| |
| |
|

| TissGeneSummary for ACSBG2 |
 Gene summary Gene summary |
| Basic gene information | Gene symbol | ACSBG2 |
| Gene name | acyl-CoA synthetase bubblegum family member 2 | |
| Synonyms | BGR|BRGL|PRTD-NY3|PRTDNY3 | |
| Cytomap | UCSC genome browser: 19p13.3 | |
| Type of gene | protein-coding | |
| RefGenes | NM_001289177.1, NM_001289178.1,NM_001289179.1,NM_001289180.1,NM_030924.4, | |
| Description | bubblegum-related proteinlong-chain-fatty-acid--CoA ligase ACSBG2 | |
| Modification date | 20141207 | |
| dbXrefs | MIM : 614363 | |
| HGNC : HGNC | ||
| Ensembl : ENSG00000130377 | ||
| HPRD : 09824 | ||
| Vega : OTTHUMG00000180754 | ||
| Protein | UniProt: go to UniProt's Cross Reference DB Table | |
| Expression | CleanEX: HS_ACSBG2 | |
| BioGPS: 81616 | ||
| Pathway | NCI Pathway Interaction Database: ACSBG2 | |
| KEGG: ACSBG2 | ||
| REACTOME: ACSBG2 | ||
| Pathway Commons: ACSBG2 | ||
| Context | iHOP: ACSBG2 | |
| ligand binding site mutation search in PubMed: ACSBG2 | ||
| UCL Cancer Institute: ACSBG2 | ||
| Assigned class in TissGDB* | A | |
| Included tissue-specific gene expression resources | HPA,TiGER,GTEx | |
| Specific-tissues in normal samples (assigned by TissGDB using HPA, TiGER, and GTEx) | Testis | |
| Cancer types related to the specific-tissues in cancer samples (assigned by TissGDB using TCGA) | TGCT | |
| Reference showing the relevant tissue of ACSBG2 | The second member of the human and murine bubblegum family is a testis- and brainstem-specific acyl-CoA synthetase. Pei Z, Jia Z, Watkins PA. J Biol Chem. 2006 Mar 10;281(10):6632-41. Epub 2005 Dec 21. (pmid:16371355 ) go to article | |
| Description by TissGene annotations | Cancer gene Fused withTSGene | |
| * Class A consists of genes with literature evidence and is part of the cTissGenes. Class B consists of only cTissGenes without additional evidence. The remaining genes belong to Class C. |
| Gene ontology having evidence of Inferred from Direct Assay (IDA) from Entrez |
| GO ID | GO term | PubMed ID | GO:0001676 | long-chain fatty acid metabolic process | 16371355 | GO:0006631 | fatty acid metabolic process | 16371355 | GO:0001676 | long-chain fatty acid metabolic process | 16371355 | GO:0006631 | fatty acid metabolic process | 16371355 |
| Top |
| TissGeneExp for ACSBG2 |
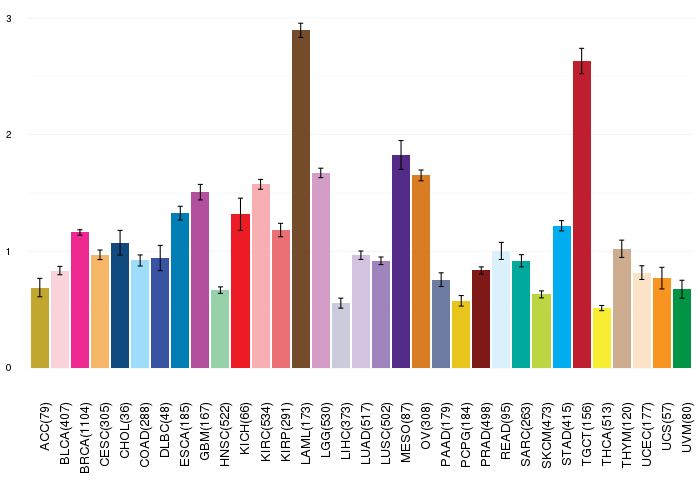
| Gene expressions across 28 cancer types (X-axis: cancer type and Y-axis: log2(norm_counts+1)) (TCGA IlluminaHiSeq_RNASeqV2, pan-cancer normalized log2(norm_counts+1) data, version 2016-08-16) |
 |
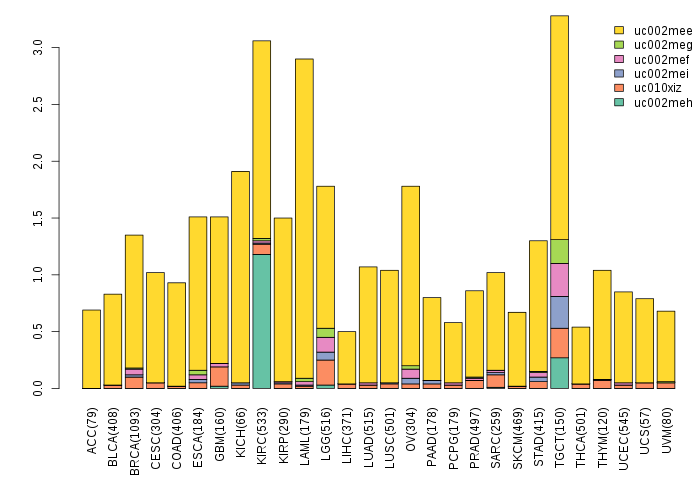
| Gene isoform expressions across 28 cancer types (X-axis: cancer type and Y-axis: log2(norm_counts+1)) (TCGA pan-cancer tcga_rsem_isoform_tpm, version 2016-09-01) |
 |
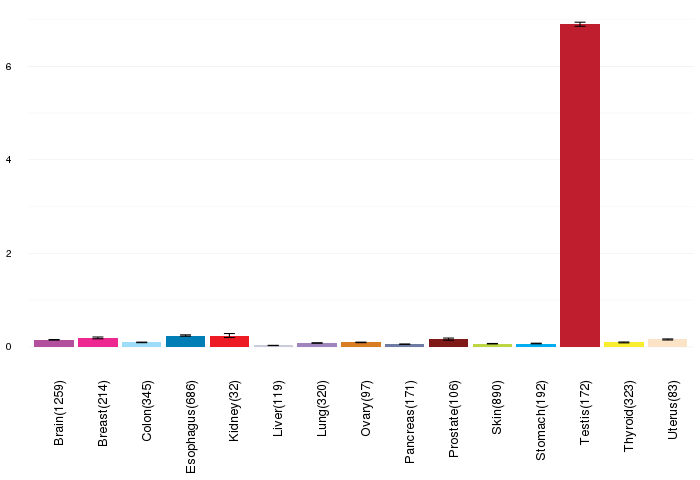
| Gene expressions across normal tissues of GTEx data (GTEx GTEx_Analysis_v6_RNA-seq_RNA-SeQCv1.1.8_gene_rpkm.gct) - Here, we shows the matched tissue types only among our 28 cancer types. |
 |
| Different expressions across 14 cancer types with more than 10 samples between matched tumors and normals (X-axis: cancer type and Y-axis: log2(norm_counts+1)) (TCGA IlluminaHiSeq_RNASeqV2, pan-cancer normalized log2(norm_counts+1) data, version 2016-08-16) |
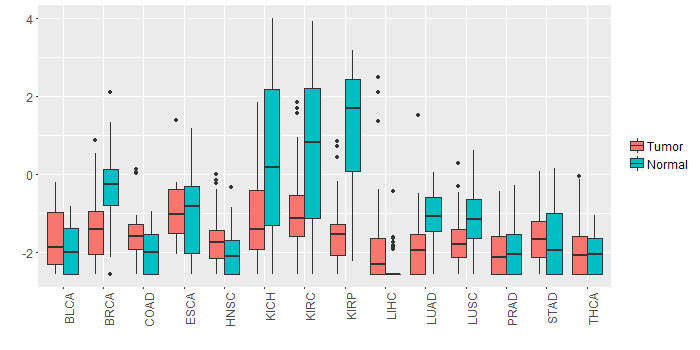 |
| - Significantly differentially expressed cancer types and information. (|Fold change|>1 and FDR<0.05) |
| Cancer type | Mean(exp) in tumor | Mean(exp) in matched normal | Log2FC | P-val. | FDR |
| BRCA | -1.444386042 | -0.363154463 | -1.081231579 | 1.28E-20 | 9.65E-20 |
| KIRC | -0.959900223 | 0.629677554 | -1.589577778 | 1.75E-08 | 5.17E-08 |
| KIRP | -1.521004737 | 1.303814013 | -2.82481875 | 3.35E-12 | 5.04E-11 |
| KICH | -1.052720112 | 0.414299888 | -1.46702 | 0.00207 | 0.0042361 |
| Top |
| TissGene-miRNA for ACSBG2 |
| Significantly anti-correlated miRNAs of TissGene across 28 cancer types (Gene-miRNA relations from TargetScanHuman Relsease 7.1, Conserved_Site_Context_Scores.txt.zip, 06.01.2016) (TCGA IlluminaHiSeq_miRNASeq, log2(RPM+1) data, version 2016-11-21) (TCGA IlluminaHiSeq_RNASeqV2, log2(normalized_count+1) data, version 2016-08-16) (Spearman’s Rank Correlation (p-value<0.05 and coefficient<-0.25)) |
| Cancer type | miRNA id | miRNA accession | P-val. | Coeff. | # samples |
| Top |
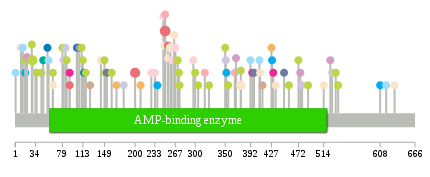
| TissGeneMut for ACSBG2 |
| TissGeneSNV for ACSBG2 |
| nsSNV counts per each loci. Different colors of circles represent different cancer types. Circle size denotes number of samples. (TCGA somatic mutation (SNPs and small INDELs) data, version 2016-04-25) * Click on the image to enlarge it in a new window. |
 |
 |
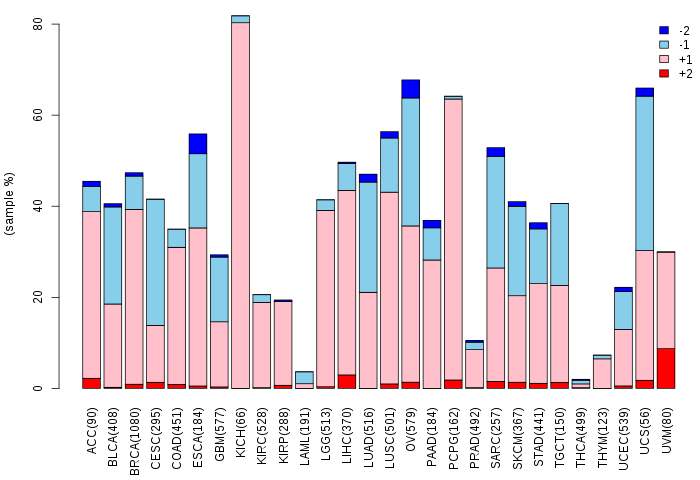
| Somatic nucleotide variants of TissGene across 28 cancer types (X-axis: cancer type and Y-axis: % of mutated samples) The numbers in parentheses are numbers of samples with mutation (nsSNVs). (TCGA somatic mutation (SNPs and small INDELs) data, version 2016-04-25) |
 |
| - nsSNVs sorted by frequency. |
| AAchange | Cancer type | # samples |
| p.I250M | KIRP | 4 |
| p.I200M | KIRP | 3 |
| p.E29K | SKCM | 3 |
| p.I250M | UCEC | 2 |
| p.T376A | UCEC | 2 |
| p.K259Q | UCEC | 2 |
| p.R350K | SKCM | 1 |
| p.I181V | LIHC | 1 |
| p.H392P | COAD | 1 |
| p.Q434H | UCEC | 1 |
| p.P525S | LGG | 1 |
| p.R91Q | BRCA | 1 |
| p.P475S | LGG | 1 |
| p.E632D | UCEC | 1 |
| p.G398E | PAAD | 1 |
| p.S376L | SKCM | 1 |
| p.D111N | SKCM | 1 |
| p.E368K | LGG | 1 |
| p.Q8E | HNSC | 1 |
| p.R91Q | KIRP | 1 |
| p.R300K | SKCM | 1 |
| p.P478T | LUAD | 1 |
| p.F267L | BLCA | 1 |
| p.A618V | COAD | 1 |
| p.I395M | BRCA | 1 |
| p.W28* | SKCM | 1 |
| p.N84K | LIHC | 1 |
| p.N316H | KIRC | 1 |
| p.E261K | BLCA | 1 |
| p.S494F | HNSC | 1 |
| p.P271L | SKCM | 1 |
| p.R104C | ESCA | 1 |
| p.C415S | HNSC | 1 |
| p.D17N | STAD | 1 |
| p.A125S | THYM | 1 |
| p.Y86N | SKCM | 1 |
| p.A227S | BLCA | 1 |
| p.F150L | SKCM | 1 |
| p.P528T | LUAD | 1 |
| p.K209Q | CESC | 1 |
| p.S169L | CESC | 1 |
| p.Y36N | SKCM | 1 |
| p.R54C | ESCA | 1 |
| p.E427* | CESC | 1 |
| p.P538S | SKCM | 1 |
| p.N366H | KIRC | 1 |
| p.G107* | LUSC | 1 |
| p.I489M | HNSC | 1 |
| p.T430M | BRCA | 1 |
| p.G44E | SKCM | 1 |
| p.E632D | CHOL | 1 |
| p.E407K | COAD | 1 |
| p.P488S | SKCM | 1 |
| p.K355E | SKCM | 1 |
| p.I233M | BLCA | 1 |
| p.R63Q | READ | 1 |
| p.T255A | UCEC | 1 |
| p.Q623* | HNSC | 1 |
| p.A399V | READ | 1 |
| p.T255A | KIRP | 1 |
| p.F408L | UCEC | 1 |
| p.L47F | SARC | 1 |
| p.Q608P | STAD | 1 |
| p.F63L | SKCM | 1 |
| p.L351I | LUAD | 1 |
| p.D13E | COAD | 1 |
| p.G534S | SKCM | 1 |
| p.M1I | COAD | 1 |
| p.F56L | COAD | 1 |
| p.E265D | UCEC | 1 |
| p.D17G | SKCM | 1 |
| p.I237M | STAD | 1 |
| p.D161N | SKCM | 1 |
| p.Q297* | BLCA | 1 |
| p.Q573* | HNSC | 1 |
| p.N34K | LIHC | 1 |
| p.D149N | SKCM | 1 |
| p.V153A | PAAD | 1 |
| p.E472K | SKCM | 1 |
| p.L81I | LUAD | 1 |
| p.E514* | UCEC | 1 |
| p.S115Y | ESCA | 1 |
| p.K360N | READ | 1 |
| p.W274L | SKCM | 1 |
| p.L111M | READ | 1 |
| p.D487N | READ | 1 |
| p.L118F | SKCM | 1 |
| p.I250M | KIRC | 1 |
| p.V103A | PAAD | 1 |
| p.G448E | PAAD | 1 |
| p.L412F | THYM | 1 |
| p.L456R | SKCM | 1 |
| p.R63Q | UCEC | 1 |
| p.I323F | SKCM | 1 |
| p.S444F | HNSC | 1 |
| p.G10A | BLCA | 1 |
| p.L20I | LGG | 1 |
| p.Q247* | BLCA | 1 |
| p.I273F | SKCM | 1 |
| p.F113L | SKCM | 1 |
| p.P428S | STAD | 1 |
| p.K305E | SKCM | 1 |
| p.I352T | STAD | 1 |
| p.E79K | SKCM | 1 |
| p.V143I | UCEC | 1 |
| Top |
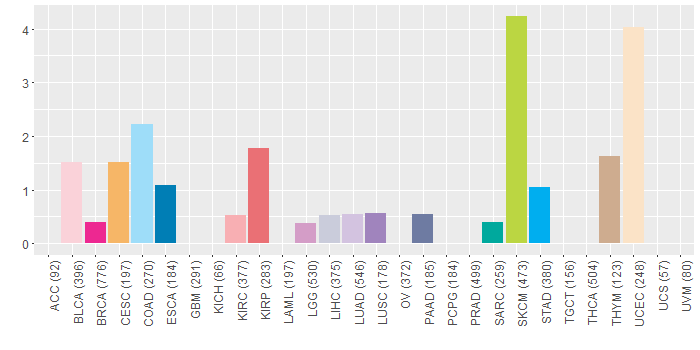
| TissGeneCNV for ACSBG2 |
| Copy number variations of TissGene across 28 cancer types (X-axis: cancer type and Y-axis: % of CNV samples) (TCGA Gistic2_CopyNumber_Gistic2_all_data_by_genes, Gistic2 copy number data, version 2016-08-16) |
 |
| Top |
| TissGeneFusions for ACSBG2 |
| Fusion genes including TissGene (ChimerDB 3.0, 2016-12-01 and TCGA fusion Portal 2015-12-01) |
| Database | Src | Cancer type | Sample | Fusion gene | ORF | 5'-gene BP | 3'-gene BP |
| Chimerdb3.0 | ChiTaRs | NA | AA868830 | ACSBG2-SLC14A2 | chr19:6193105 | chr18:43063380 | |
| Chimerdb3.0 | ChiTaRs | NA | AI939380 | ACSBG2-IGFBP5 | chr19:6138285 | chr2:217539795 | |
| Chimerdb3.0 | FusionScan | LUAD | TCGA-75-5125-01A | NCLN-ACSBG2 | In-Frame | chr19:3193426 | chr19:6187293 |
| TCGAfusionPortal | PRADA | LUAD | TCGA-75-5125-01A | NCLN-ACSBG2 | In-frame | Chr19:3193426 | Chr19:6187294 |
| Top |
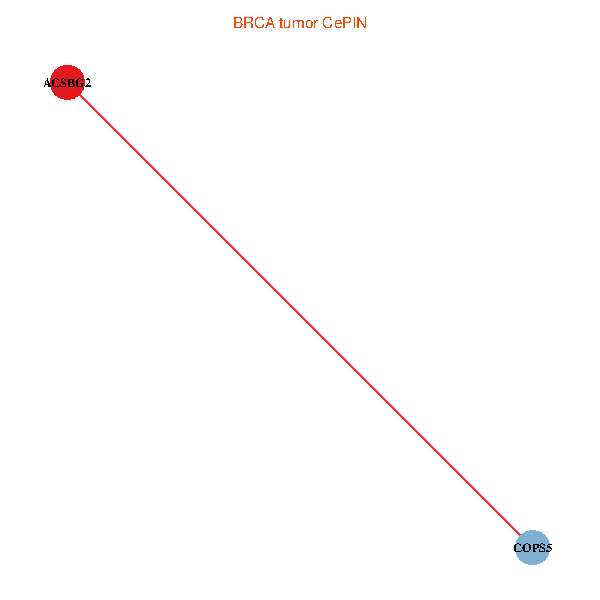
| TissGeneNet for ACSBG2 |
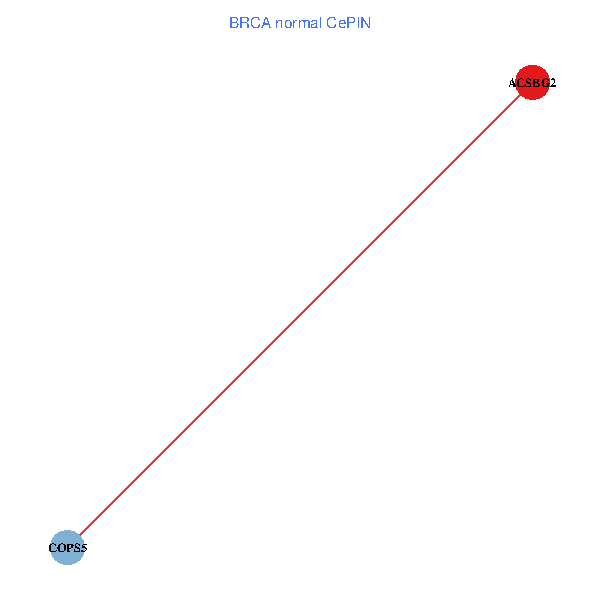
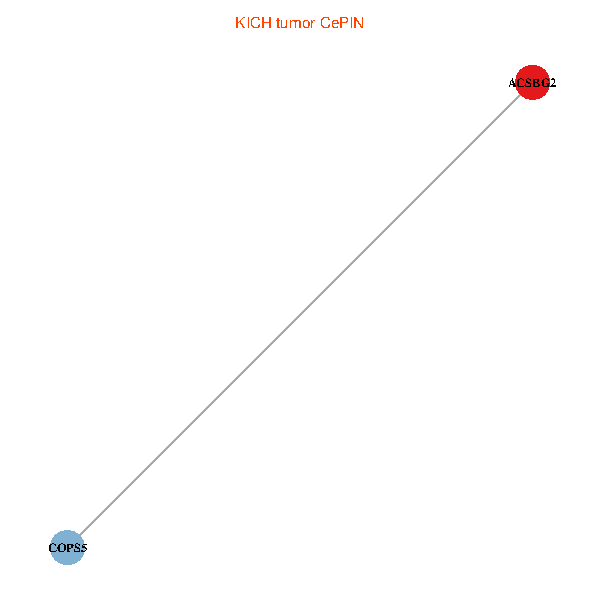
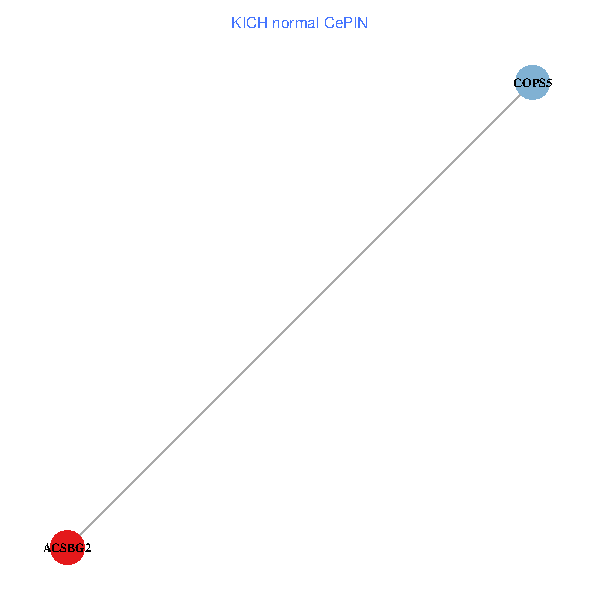
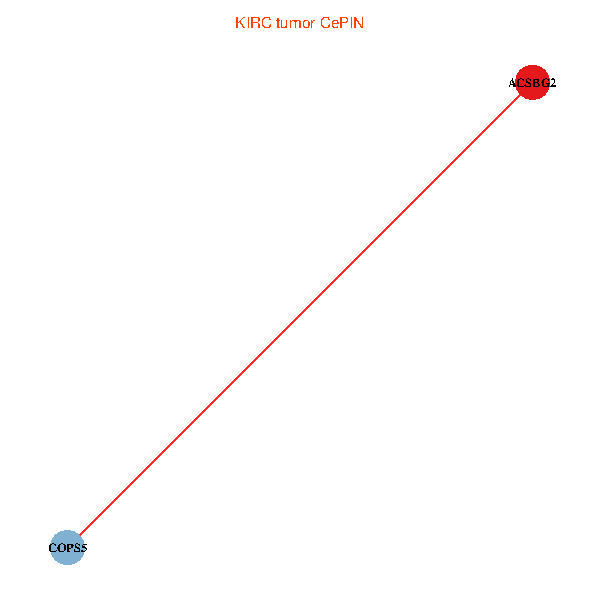
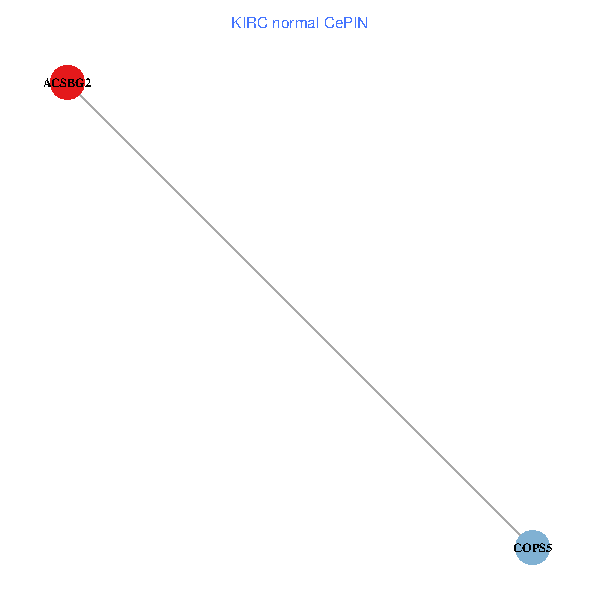
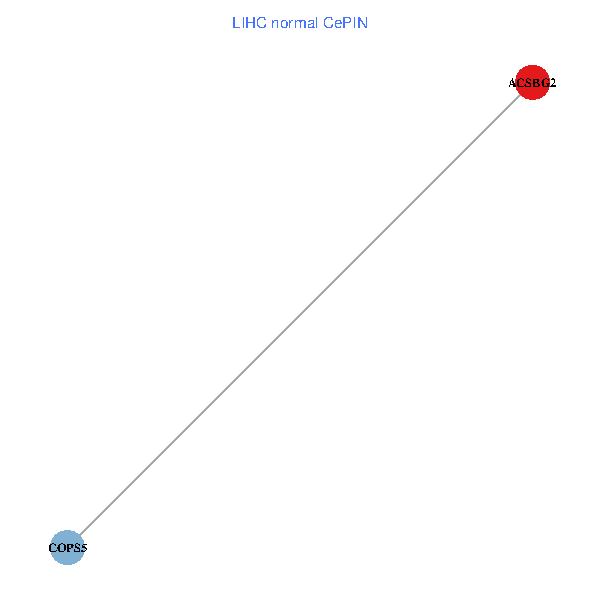
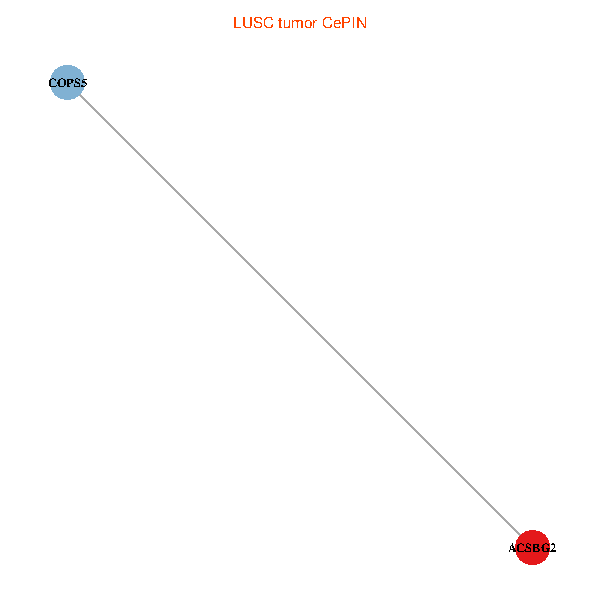
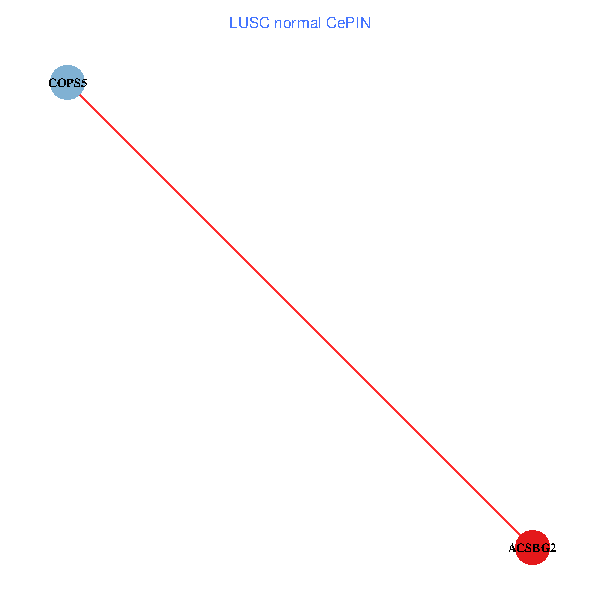
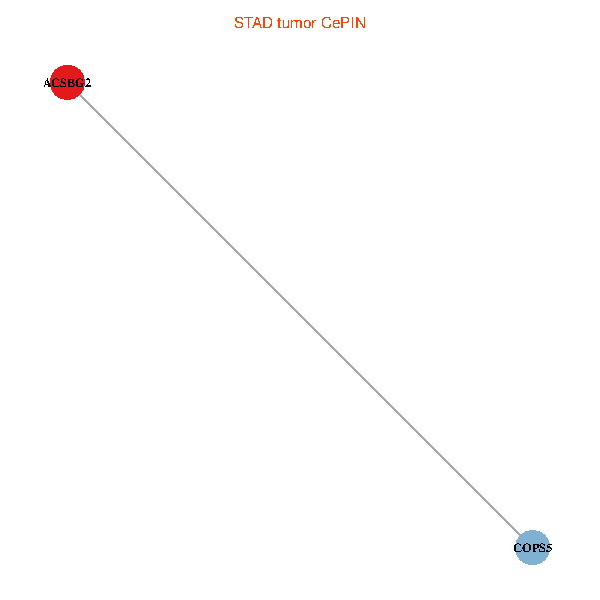
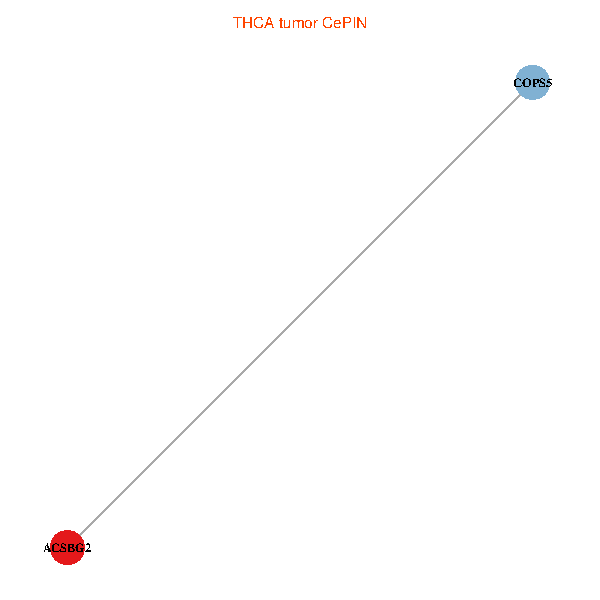
| Co-expressed gene networks based on protein-protein interaction data (CePIN) (TCGA IlluminaHiSeq_RNASeqV2, pan-cancer normalized log2(norm_counts+1) data, version 2016-08-16) (PINA2 ppi data) |
| BRCA (tumor) | BRCA (normal) |
| ACSBG2, COPS5 (tumor) | ACSBG2, COPS5 (normal) |
 |  |
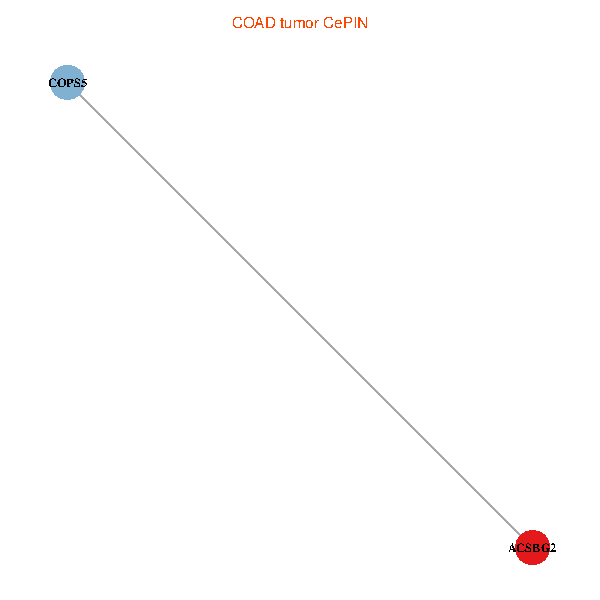
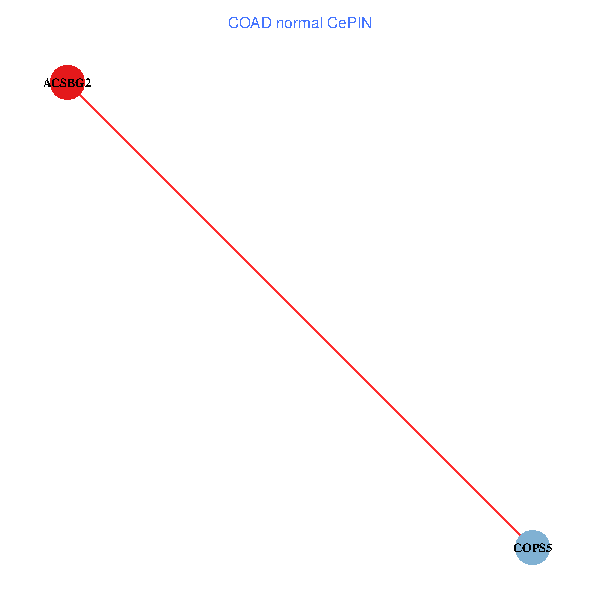
| COAD (tumor) | COAD (normal) |
| ACSBG2, COPS5 (tumor) | ACSBG2, COPS5 (normal) |
 |  |
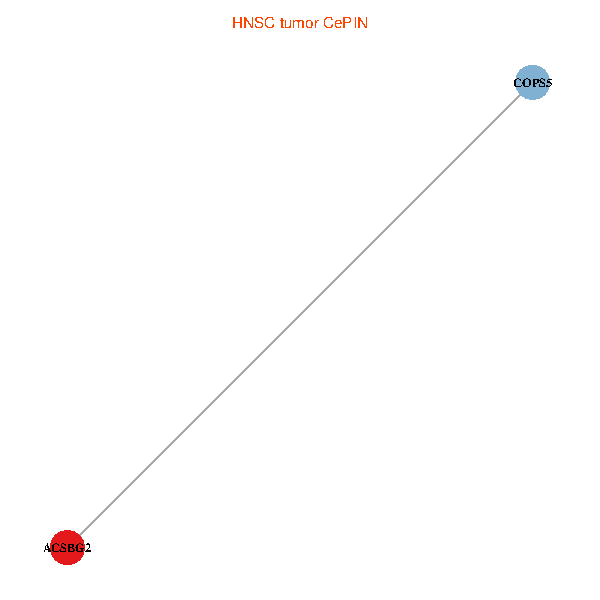
| HNSC (tumor) | HNSC (normal) |
| ACSBG2, COPS5 (tumor) | ACSBG2, COPS5 (normal) |
 |  |
| KICH (tumor) | KICH (normal) |
| ACSBG2, COPS5 (tumor) | ACSBG2, COPS5 (normal) |
 |  |
| KIRC (tumor) | KIRC (normal) |
| ACSBG2, COPS5 (tumor) | ACSBG2, COPS5 (normal) |
 |  |
| KIRP (tumor) | KIRP (normal) |
| ACSBG2, COPS5 (tumor) | ACSBG2, COPS5 (normal) |
 |  |
| LIHC (tumor) | LIHC (normal) |
| ACSBG2, COPS5 (tumor) | ACSBG2, COPS5 (normal) |
 |  |
| LUAD (tumor) | LUAD (normal) |
| ACSBG2, COPS5 (tumor) | ACSBG2, COPS5 (normal) |
 |  |
| LUSC (tumor) | LUSC (normal) |
| ACSBG2, COPS5 (tumor) | ACSBG2, COPS5 (normal) |
 |  |
| PRAD (tumor) | PRAD (normal) |
| ACSBG2, COPS5 (tumor) | ACSBG2, COPS5 (normal) |
 |  |
| STAD (tumor) | STAD (normal) |
| ACSBG2, COPS5 (tumor) | ACSBG2, COPS5 (normal) |
 |  |
| THCA (tumor) | THCA (normal) |
| ACSBG2, COPS5 (tumor) | ACSBG2, COPS5 (normal) |
 |  |
| Top |
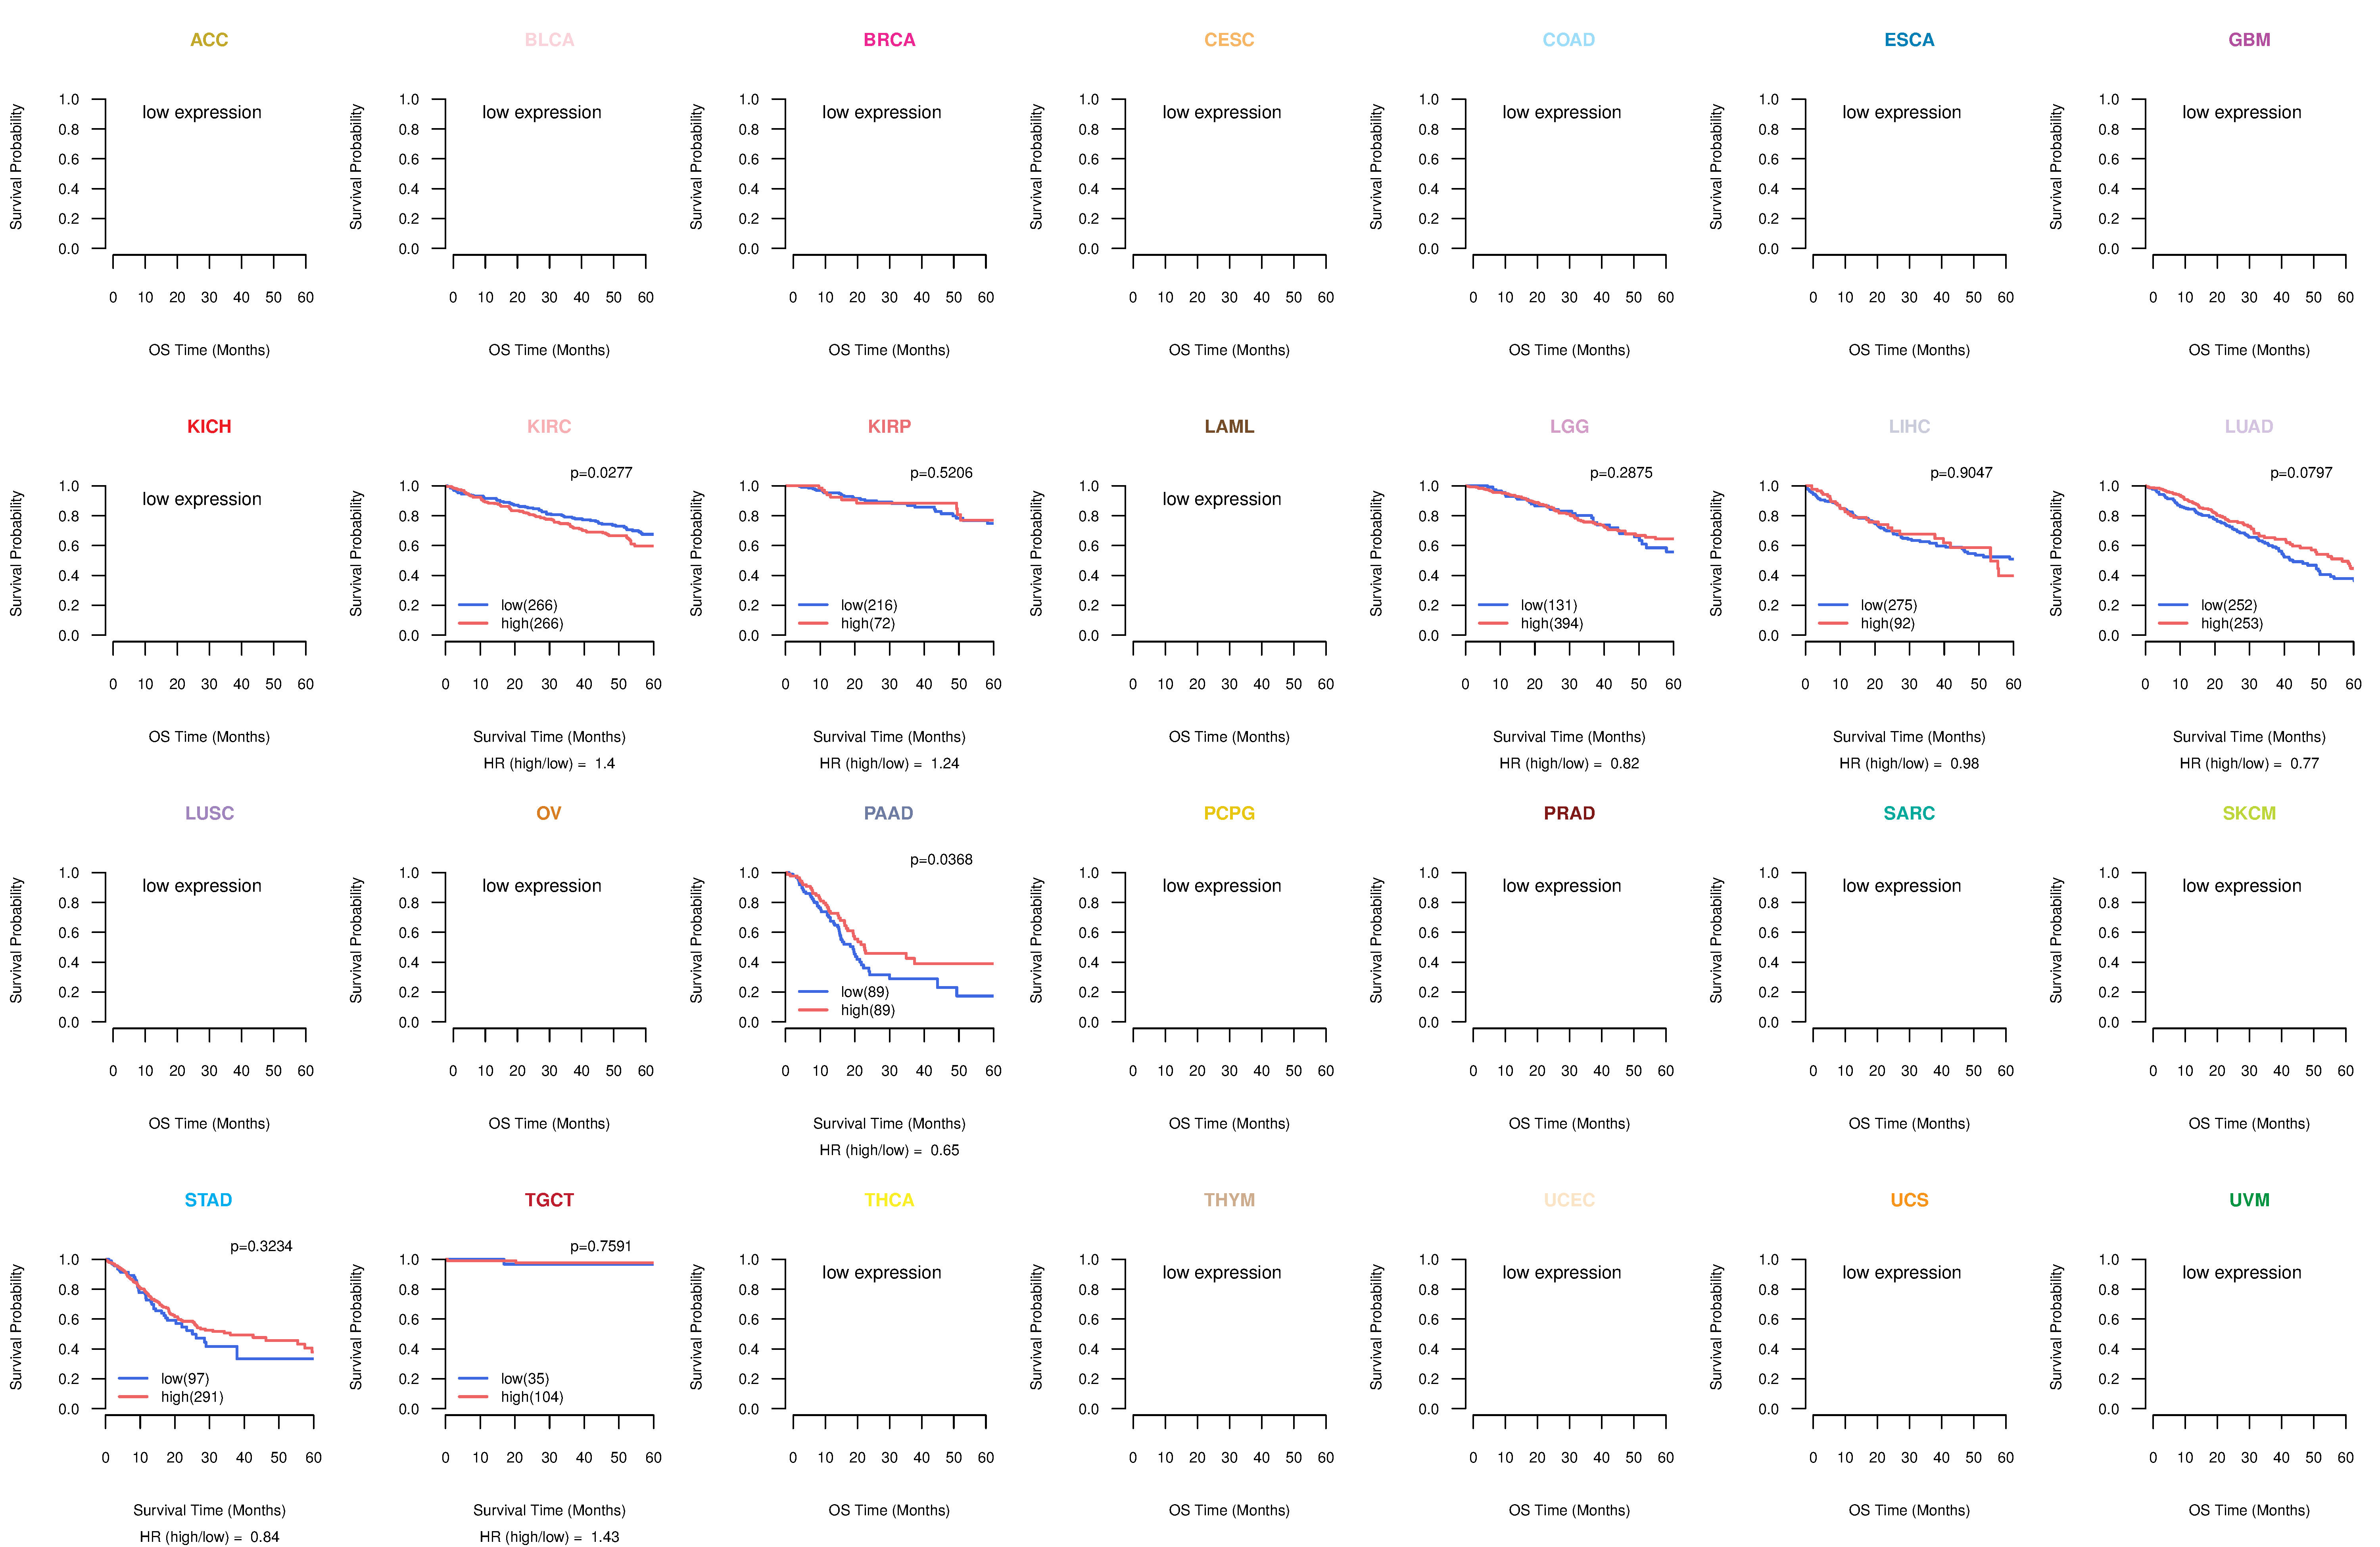
| TissGeneProg for ACSBG2 |
| Kaplan-Meier plots with logrank tests of overall survival (OS) using 28 cancer types (TCGA IlluminaHiSeq_RNASeqV2, pan-cancer normalized log2(norm_counts+1) data, version 2016-08-16) (TCGA clinicalMatrix, phenotype data, version 2016-04-27) * Click on the image to enlarge it in a new window. |
 |
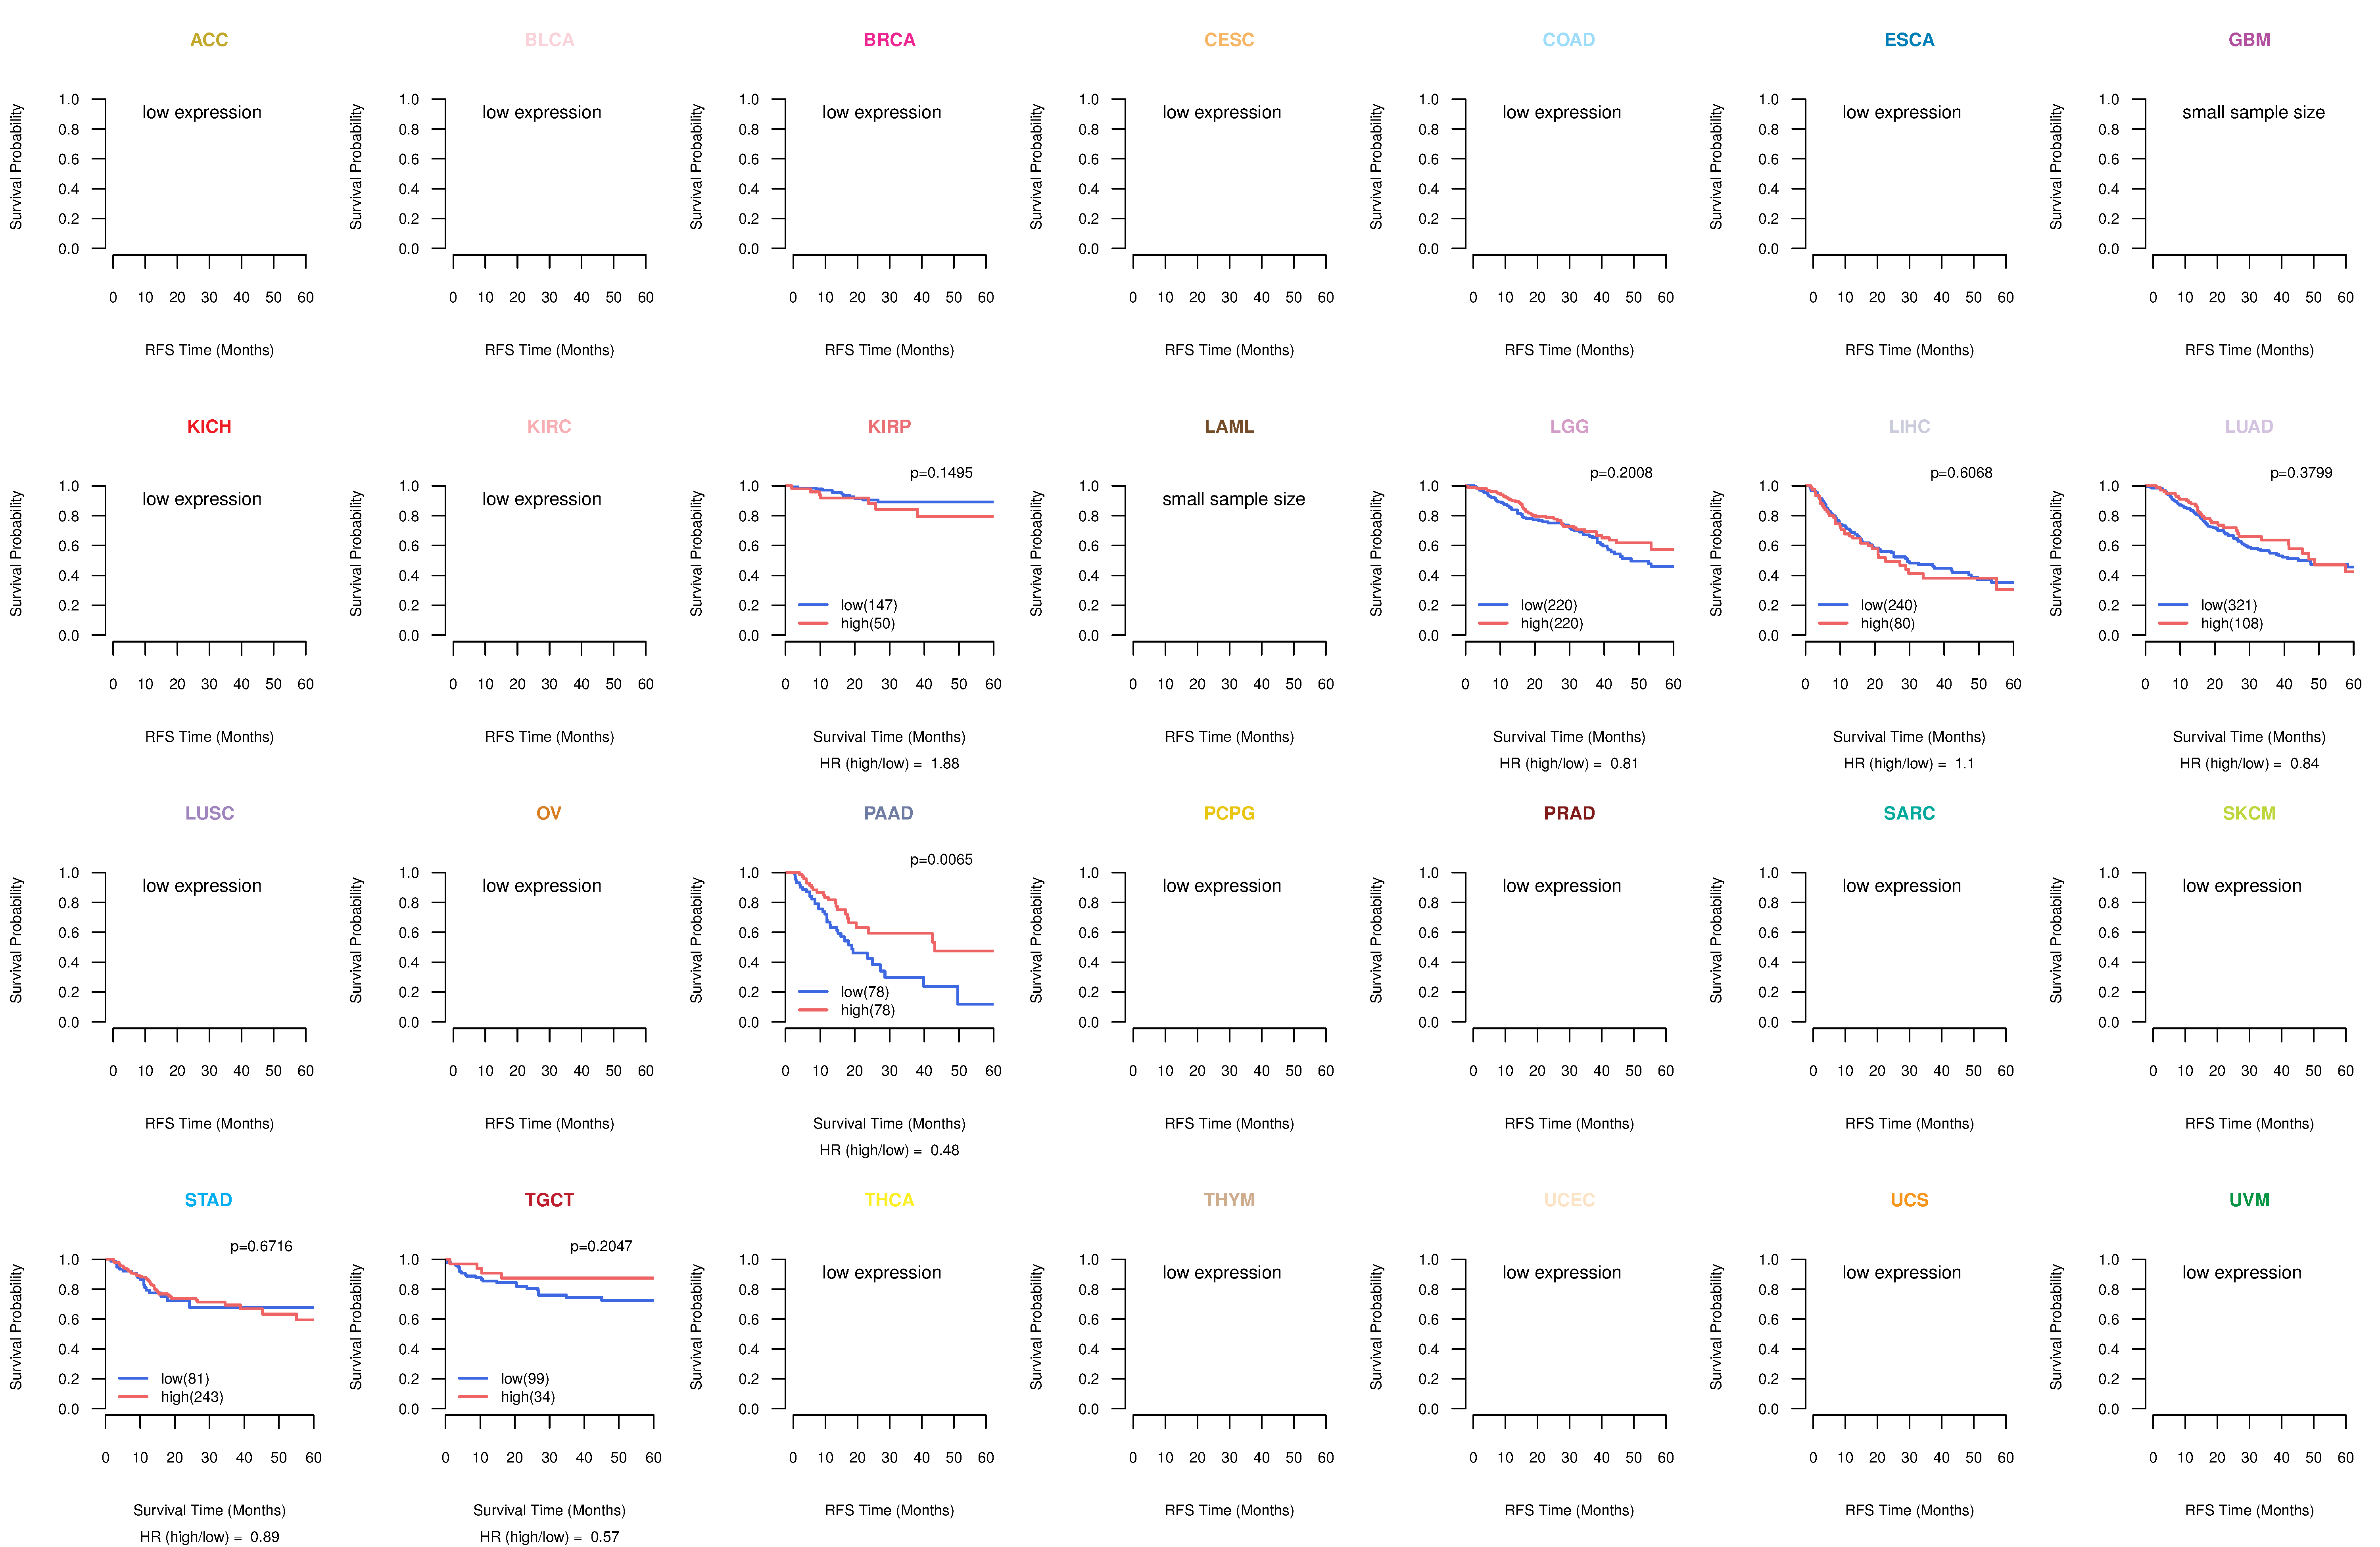
| Kaplan-Meier plots with logrank test of relapse free survival (RFS) using 28 cancer types (TCGA IlluminaHiSeq_RNASeqV2, pan-cancer normalized log2(norm_counts+1) data, version 2016-08-16) (TCGA clinicalMatrix, phenotype data, version 2016-04-27) * Click on the image enlarge it in a new window. |
 |
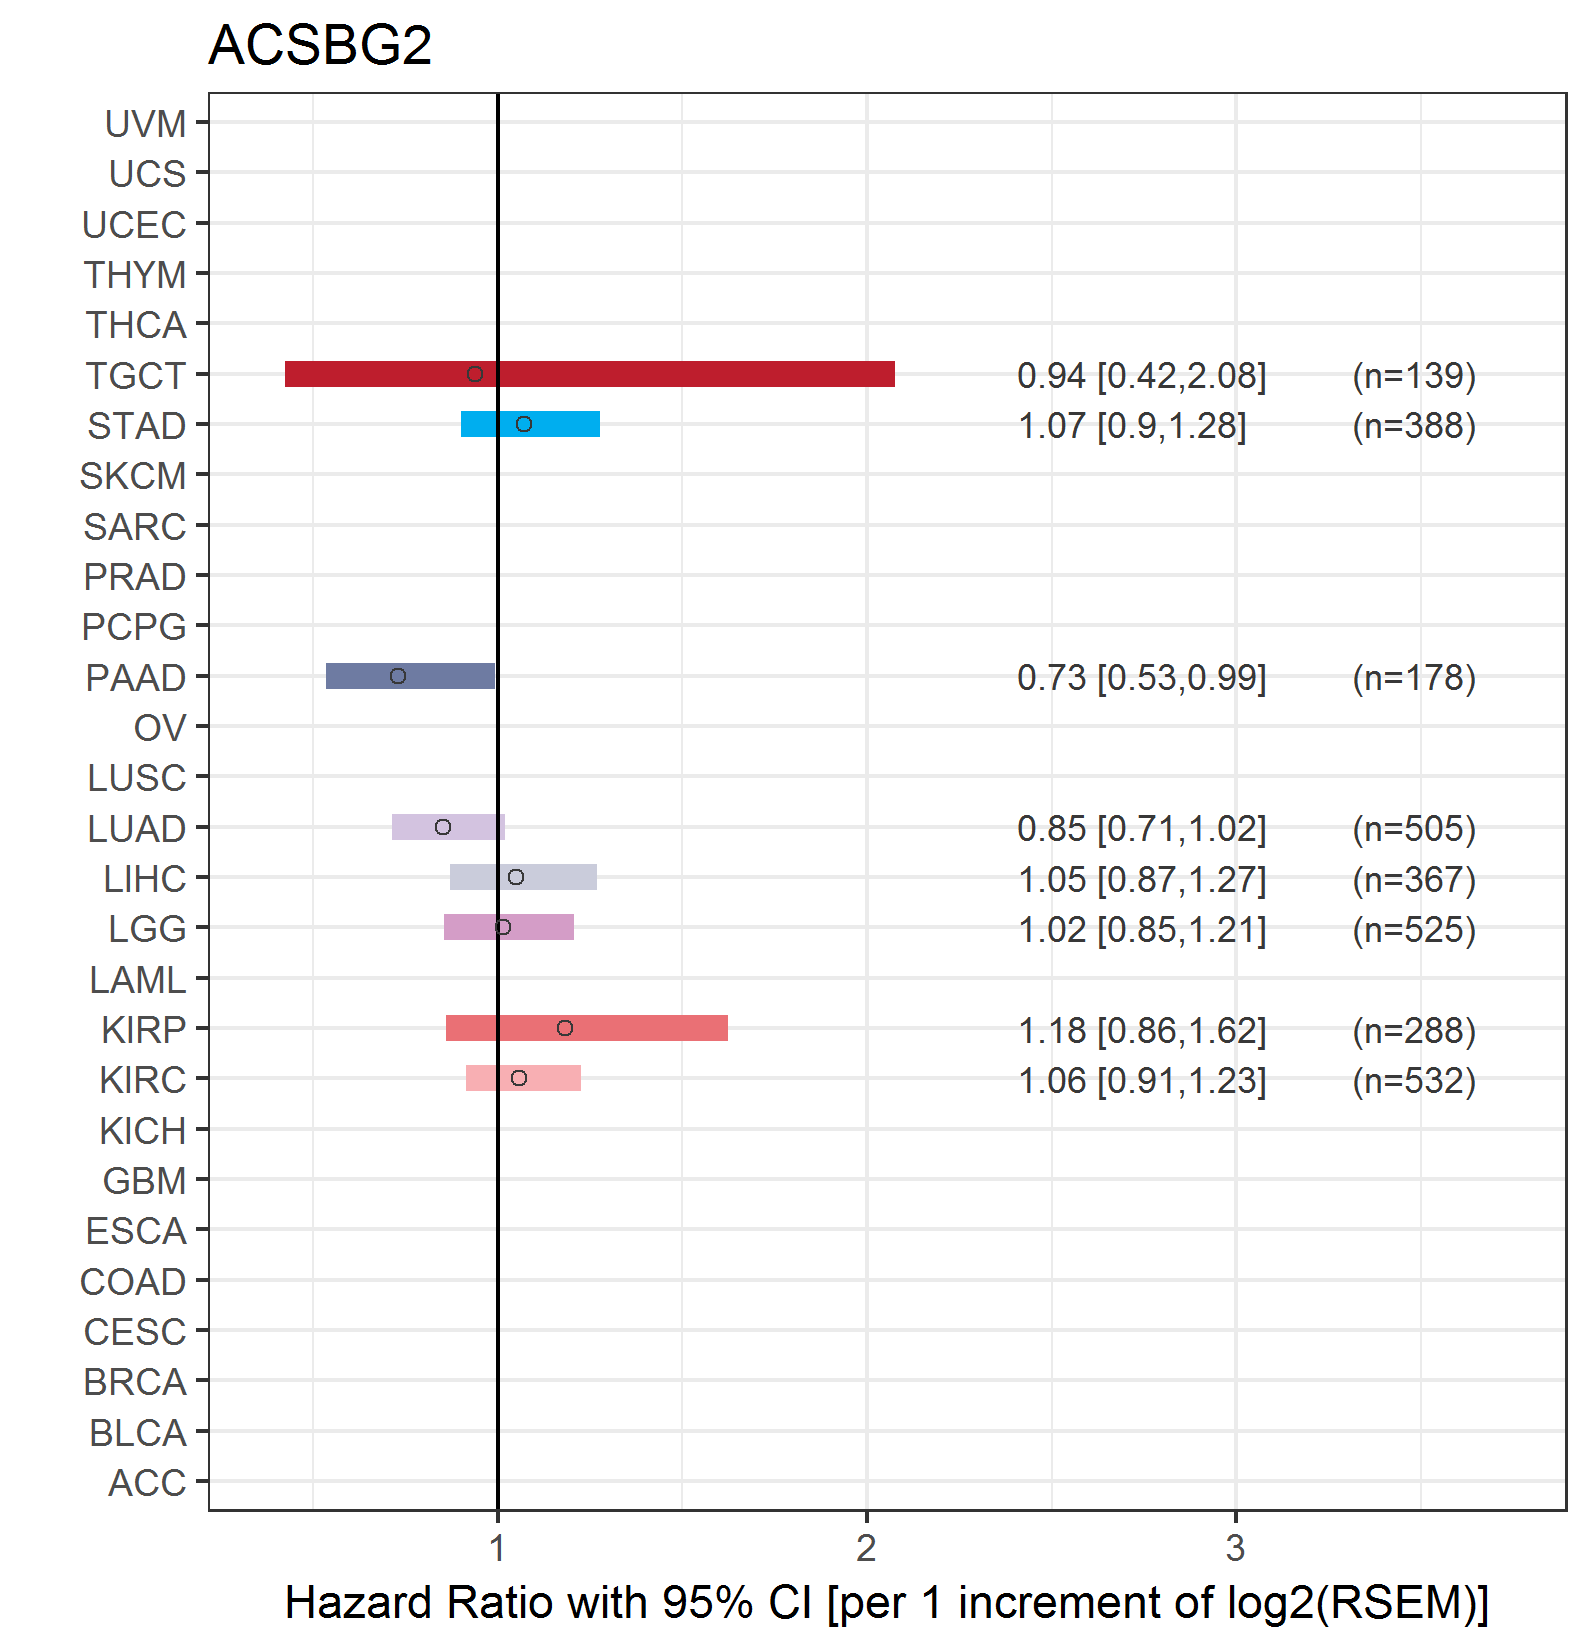
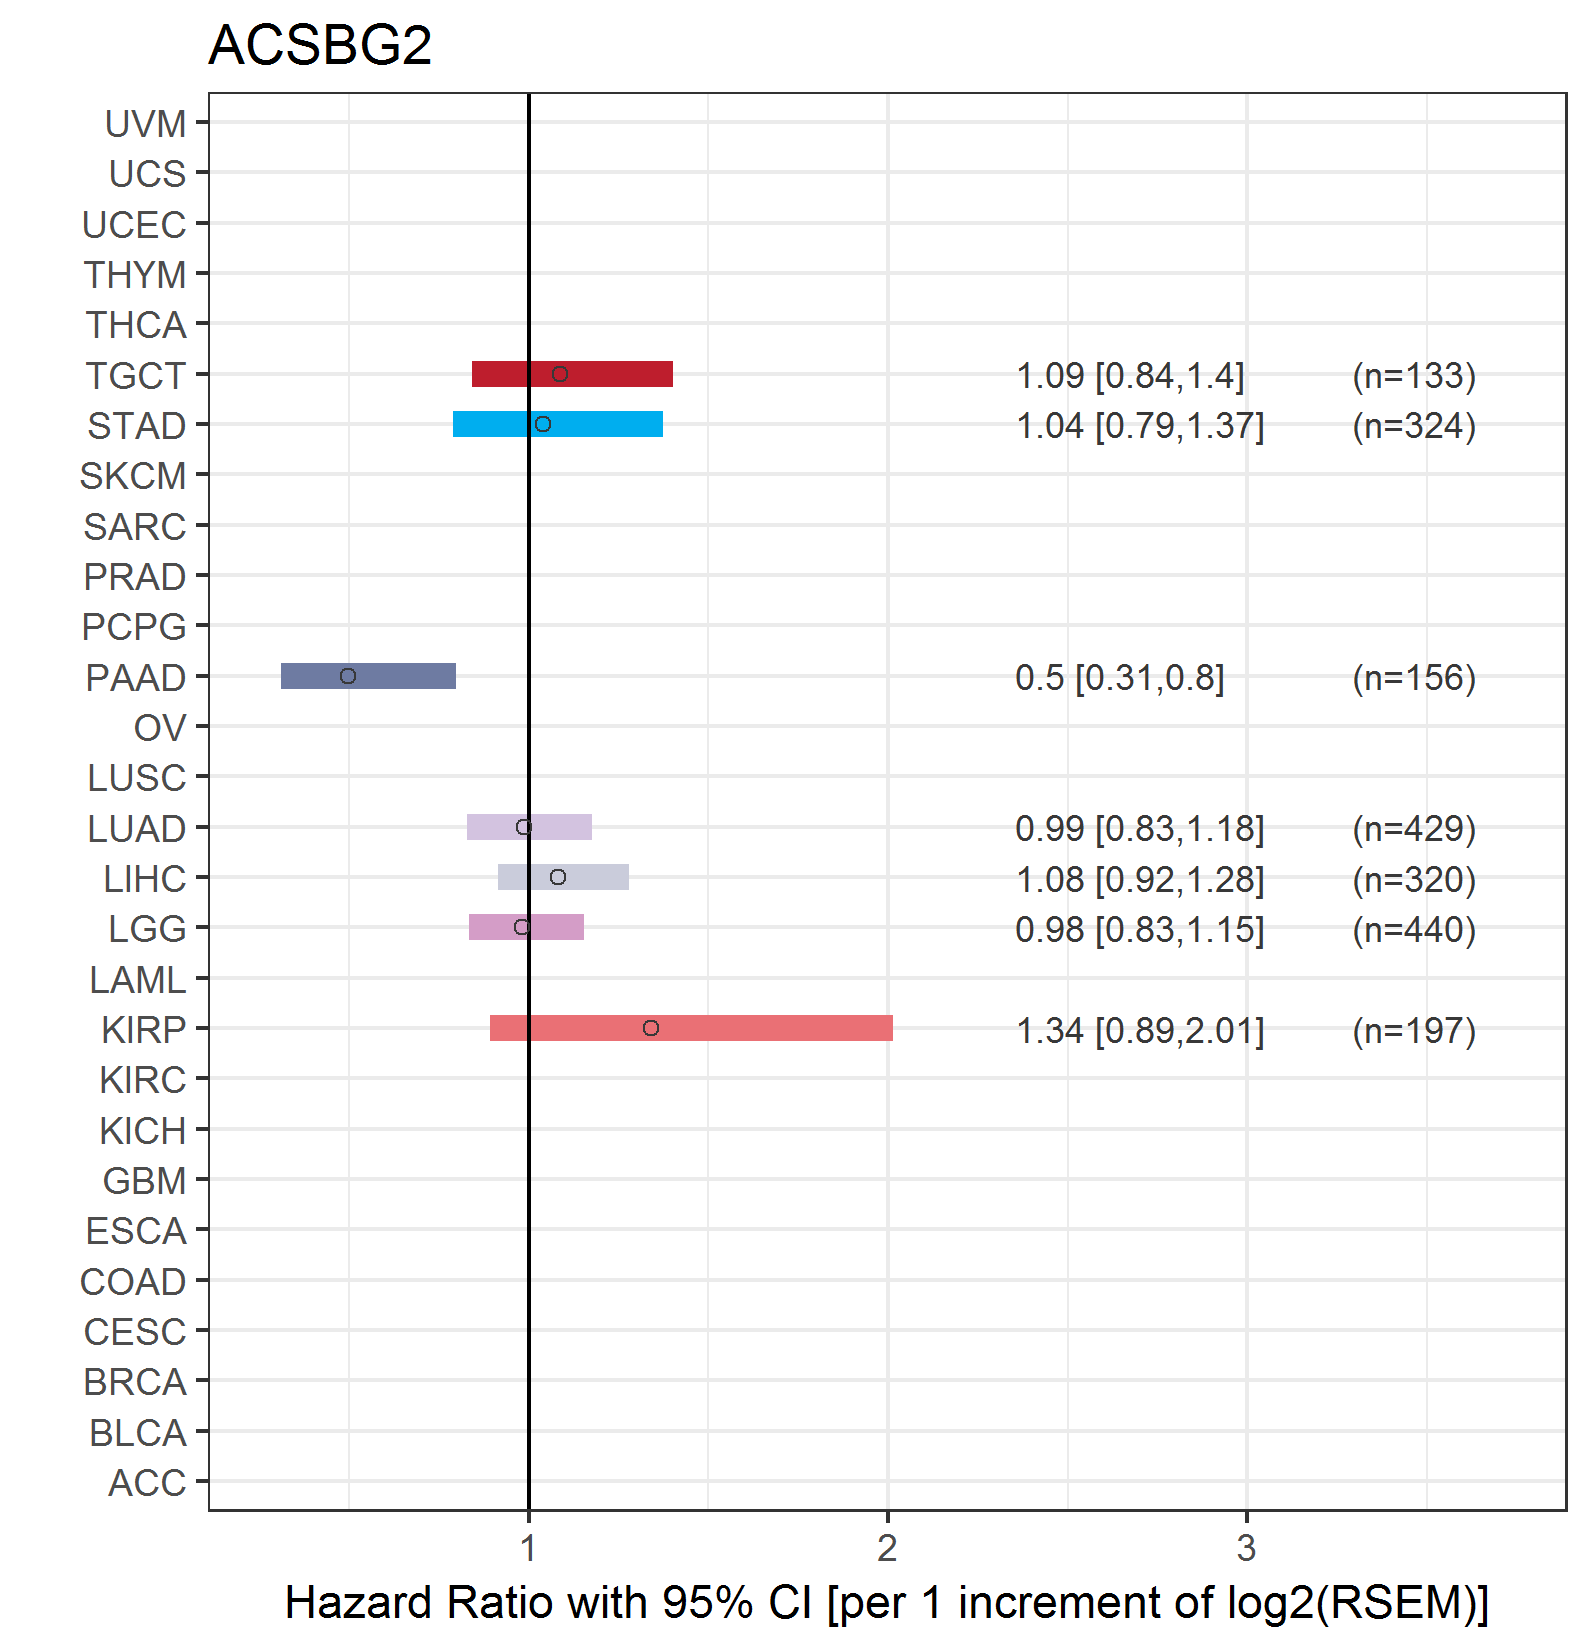
| Forest plot of Cox proportional hazard ratio (HR) and 95% CI of overall survival (OS) using 28 cancer types (TCGA IlluminaHiSeq_RNASeqV2, pan-cancer normalized log2(norm_counts+1) data, version 2016-08-16) (TCGA clinicalMatrix, phenotype data, version 2016-04-27) * Click on the image enlarge it in a new window. |
 |
| Forest plot of Cox proportional hazard ratio (HR) and 95% CI of relapse free survival (RFS) using 28 cancer types (TCGA IlluminaHiSeq_RNASeqV2, pan-cancer normalized log2(norm_counts+1) data, version 2016-08-16) (TCGA clinicalMatrix, phenotype data, version 2016-04-27) * Click on the image enlarge it in a new window. |
 |
| Top |
| TissGeneClin for ACSBG2 |
| TissGeneDrug for ACSBG2 |
| Drug information targeting TissGene (DrugBank Version 5.0.6, 2017-04-01) |
| DrugBank ID | Drug name | Drug activity | Drug type | Drug status |
| Top |
| TissGeneDisease for ACSBG2 |
| Disease information associated with TissGene (DisGeNet, 2016-06-01) |
| Disease ID | Disease name | # pubmeds | Source |
| umls:C0021364 | Male infertility | 1 | BeFree |
| umls:C0041296 | Tuberculosis | 1 | BeFree |
| umls:C0162309 | Adrenoleukodystrophy | 1 | BeFree,LHGDN |
|
Copyright 2016-Present - The University of Texas Health Science Center at Houston (UTHealth) Web File Viewing | How to Report, Fraud, Waste and Abuse | State of Texas | Statewide Search | Texas Homeland Security | Site Policies |