 |
| |
| |
| |
| |
| |
| |
|

| TissGeneSummary for KIF18A |
 Gene summary Gene summary |
| Basic gene information | Gene symbol | KIF18A |
| Gene name | kinesin family member 18A | |
| Synonyms | MS-KIF18A|PPP1R99 | |
| Cytomap | UCSC genome browser: 11p14.1 | |
| Type of gene | protein-coding | |
| RefGenes | NM_031217.3, | |
| Description | kinesin-like protein KIF18Aprotein phosphatase 1, regulatory subunit 99 | |
| Modification date | 20141207 | |
| dbXrefs | MIM : 611271 | |
| HGNC : HGNC | ||
| Ensembl : ENSG00000121621 | ||
| HPRD : 11177 | ||
| Vega : OTTHUMG00000166195 | ||
| Protein | UniProt: go to UniProt's Cross Reference DB Table | |
| Expression | CleanEX: HS_KIF18A | |
| BioGPS: 81930 | ||
| Pathway | NCI Pathway Interaction Database: KIF18A | |
| KEGG: KIF18A | ||
| REACTOME: KIF18A | ||
| Pathway Commons: KIF18A | ||
| Context | iHOP: KIF18A | |
| ligand binding site mutation search in PubMed: KIF18A | ||
| UCL Cancer Institute: KIF18A | ||
| Assigned class in TissGDB* | C | |
| Included tissue-specific gene expression resources | TiGER,GTEx | |
| Specific-tissues in normal samples (assigned by TissGDB using HPA, TiGER, and GTEx) | Testis | |
| Cancer types related to the specific-tissues in cancer samples (assigned by TissGDB using TCGA) | TGCT | |
| Reference showing the relevant tissue of KIF18A | ||
| Description by TissGene annotations | ||
| * Class A consists of genes with literature evidence and is part of the cTissGenes. Class B consists of only cTissGenes without additional evidence. The remaining genes belong to Class C. |
| Gene ontology having evidence of Inferred from Direct Assay (IDA) from Entrez |
| GO ID | GO term | PubMed ID | GO:0006200 | ATP catabolic process | 17346968 | GO:0007019 | microtubule depolymerization | 17346968 | GO:0007080 | mitotic metaphase plate congression | 17346968 | GO:0008152 | metabolic process | 17346968 | GO:0006200 | ATP catabolic process | 17346968 | GO:0007019 | microtubule depolymerization | 17346968 | GO:0007080 | mitotic metaphase plate congression | 17346968 | GO:0008152 | metabolic process | 17346968 |
| Top |
| TissGeneExp for KIF18A |
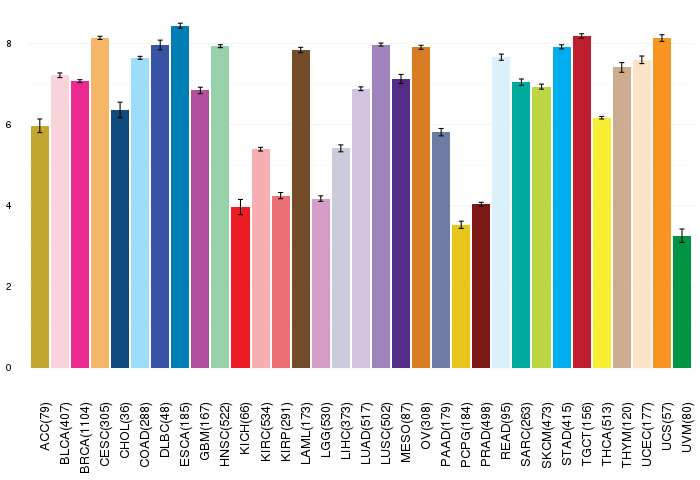
| Gene expressions across 28 cancer types (X-axis: cancer type and Y-axis: log2(norm_counts+1)) (TCGA IlluminaHiSeq_RNASeqV2, pan-cancer normalized log2(norm_counts+1) data, version 2016-08-16) |
 |
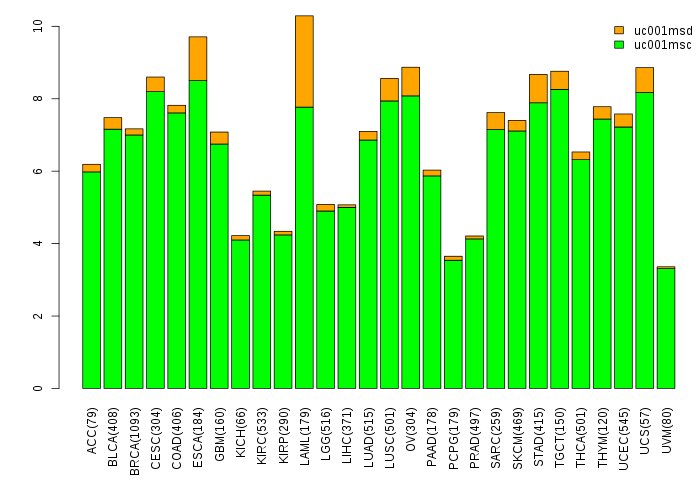
| Gene isoform expressions across 28 cancer types (X-axis: cancer type and Y-axis: log2(norm_counts+1)) (TCGA pan-cancer tcga_rsem_isoform_tpm, version 2016-09-01) |
 |
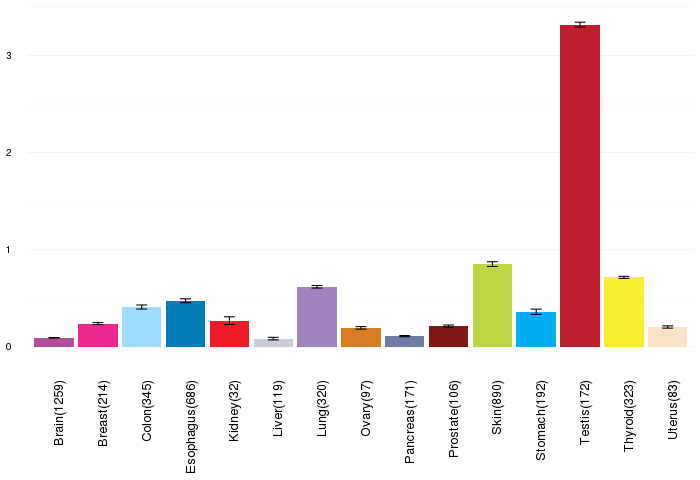
| Gene expressions across normal tissues of GTEx data (GTEx GTEx_Analysis_v6_RNA-seq_RNA-SeQCv1.1.8_gene_rpkm.gct) - Here, we shows the matched tissue types only among our 28 cancer types. |
 |
| Different expressions across 14 cancer types with more than 10 samples between matched tumors and normals (X-axis: cancer type and Y-axis: log2(norm_counts+1)) (TCGA IlluminaHiSeq_RNASeqV2, pan-cancer normalized log2(norm_counts+1) data, version 2016-08-16) |
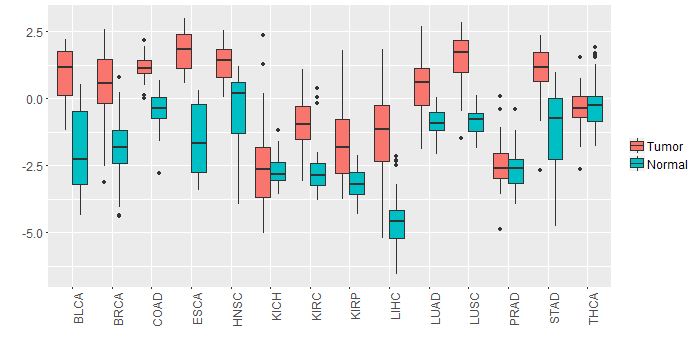 |
| - Significantly differentially expressed cancer types and information. (|Fold change|>1 and FDR<0.05) |
| Cancer type | Mean(exp) in tumor | Mean(exp) in matched normal | Log2FC | P-val. | FDR |
| KIRC | -0.91985987 | -2.759290426 | 1.839430556 | 6.40E-27 | 9.14E-26 |
| LIHC | -1.293560148 | -4.583112148 | 3.289552 | 1.18E-21 | 8.74E-20 |
| LUSC | 1.499597891 | -0.859368776 | 2.358966667 | 2.43E-27 | 7.30E-26 |
| STAD | 1.074749852 | -1.307584523 | 2.382334375 | 1.46E-08 | 6.08E-07 |
| KIRP | -1.590068898 | -3.137703273 | 1.547634375 | 1.22E-06 | 6.06E-06 |
| HNSC | 1.328623108 | -0.375230381 | 1.703853488 | 2.92E-10 | 5.39E-09 |
| COAD | 1.108926775 | -0.461319379 | 1.570246154 | 1.77E-11 | 3.26E-10 |
| BRCA | 0.590631431 | -1.853590499 | 2.44422193 | 8.46E-43 | 3.18E-41 |
| BLCA | 0.940268273 | -1.897073832 | 2.837342105 | 3.10E-07 | 1.33E-05 |
| LUAD | 0.434677438 | -0.894677734 | 1.329355172 | 1.27E-13 | 1.10E-12 |
| ESCA | 1.74448167 | -1.417163785 | 3.161645455 | 6.71E-06 | 0.000913862 |
| Top |
| TissGene-miRNA for KIF18A |
| Significantly anti-correlated miRNAs of TissGene across 28 cancer types (Gene-miRNA relations from TargetScanHuman Relsease 7.1, Conserved_Site_Context_Scores.txt.zip, 06.01.2016) (TCGA IlluminaHiSeq_miRNASeq, log2(RPM+1) data, version 2016-11-21) (TCGA IlluminaHiSeq_RNASeqV2, log2(normalized_count+1) data, version 2016-08-16) (Spearman’s Rank Correlation (p-value<0.05 and coefficient<-0.25)) |
| Cancer type | miRNA id | miRNA accession | P-val. | Coeff. | # samples |
| Top |
| TissGeneMut for KIF18A |
| TissGeneSNV for KIF18A |
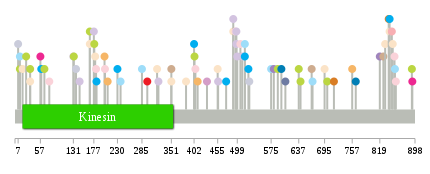
| nsSNV counts per each loci. Different colors of circles represent different cancer types. Circle size denotes number of samples. (TCGA somatic mutation (SNPs and small INDELs) data, version 2016-04-25) * Click on the image to enlarge it in a new window. |
 |
 |
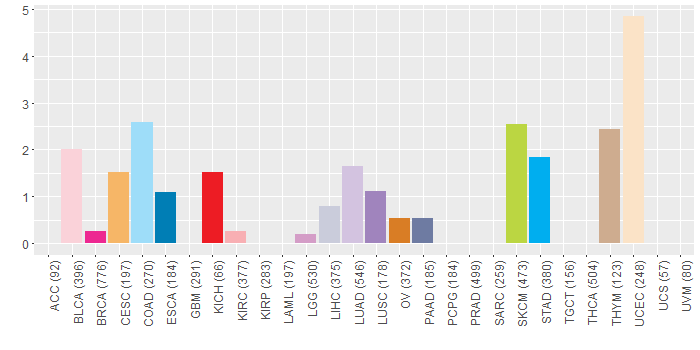
| Somatic nucleotide variants of TissGene across 28 cancer types (X-axis: cancer type and Y-axis: % of mutated samples) The numbers in parentheses are numbers of samples with mutation (nsSNVs). (TCGA somatic mutation (SNPs and small INDELs) data, version 2016-04-25) |
 |
| - nsSNVs sorted by frequency. |
| AAchange | Cancer type | # samples |
| p.A230D | STAD | 1 |
| p.I892V | BRCA | 1 |
| p.D765N | ESCA | 1 |
| p.L641P | SKCM | 1 |
| p.A178V | SKCM | 1 |
| p.S841L | STAD | 1 |
| p.N402D | STAD | 1 |
| p.E474Q | STAD | 1 |
| p.N891H | SKCM | 1 |
| p.S819C | LUSC | 1 |
| p.D182H | BLCA | 1 |
| p.K66T | SKCM | 1 |
| p.N743K | READ | 1 |
| p.L177H | LUAD | 1 |
| p.D7Y | LIHC | 1 |
| p.H11R | COAD | 1 |
| p.E403K | SKCM | 1 |
| p.E516K | COAD | 1 |
| p.R581G | LUSC | 1 |
| p.T637I | SKCM | 1 |
| p.V846I | KIRC | 1 |
| p.E516K | STAD | 1 |
| p.R497M | LUAD | 1 |
| p.G322V | LUAD | 1 |
| p.Y456C | LUAD | 1 |
| p.R17C | UCEC | 1 |
| p.I384M | UCEC | 1 |
| p.V132G | SKCM | 1 |
| p.L285I | COAD | 1 |
| p.R237X | COAD | 1 |
| p.K852N | BLCA | 1 |
| p.R168C | SKCM | 1 |
| p.D405N | BLCA | 1 |
| p.Q431H | LGG | 1 |
| p.V34I | SKCM | 1 |
| p.R855* | BLCA | 1 |
| p.A590V | SKCM | 1 |
| p.E25K | SKCM | 1 |
| p.D77H | BLCA | 1 |
| p.K533N | HNSC | 1 |
| p.M137L | LIHC | 1 |
| p.R351W | THYM | 1 |
| p.S695Y | UCEC | 1 |
| p.Q524E | STAD | 1 |
| p.A575V | COAD | 1 |
| p.E495Q | BLCA | 1 |
| p.S841L | HNSC | 1 |
| p.E499D | LUAD | 1 |
| p.K57N | BRCA | 1 |
| p.D506H | BLCA | 1 |
| p.G131* | LUAD | 1 |
| p.I419V | HNSC | 1 |
| p.R497S | LUAD | 1 |
| p.A827V | THYM | 1 |
| p.N839K | OV | 1 |
| p.E507K | HNSC | 1 |
| p.G526S | LIHC | 1 |
| p.D297H | KICH | 1 |
| p.D145G | LUAD | 1 |
| p.F455V | UCEC | 1 |
| p.R17C | READ | 1 |
| p.R490C | UCEC | 1 |
| p.N716Y | OV | 1 |
| p.T401S | HNSC | 1 |
| p.D208H | CESC | 1 |
| p.N510Y | LUAD | 1 |
| p.N793S | HNSC | 1 |
| p.T59I | STAD | 1 |
| p.S848Y | UCEC | 1 |
| p.E202K | BLCA | 1 |
| p.R668Q | COAD | 1 |
| p.R168C | UCEC | 1 |
| p.E598K | ESCA | 1 |
| p.L607F | PAAD | 1 |
| p.S841L | UCEC | 1 |
| p.H11Y | SKCM | 1 |
| p.S319Y | UCEC | 1 |
| p.V34I | UCEC | 1 |
| p.E201Q | CESC | 1 |
| p.T183A | STAD | 1 |
| p.R757K | CESC | 1 |
| p.M410I | CESC | 1 |
| p.R490C | LUAD | 1 |
| p.V846I | HNSC | 1 |
| p.Q701* | SKCM | 1 |
| p.R666G | THYM | 1 |
| p.R351Q | UCEC | 1 |
| p.R180Q | UCEC | 1 |
| p.R831W | UCEC | 1 |
| p.R853C | COAD | 1 |
| Top |
| TissGeneCNV for KIF18A |
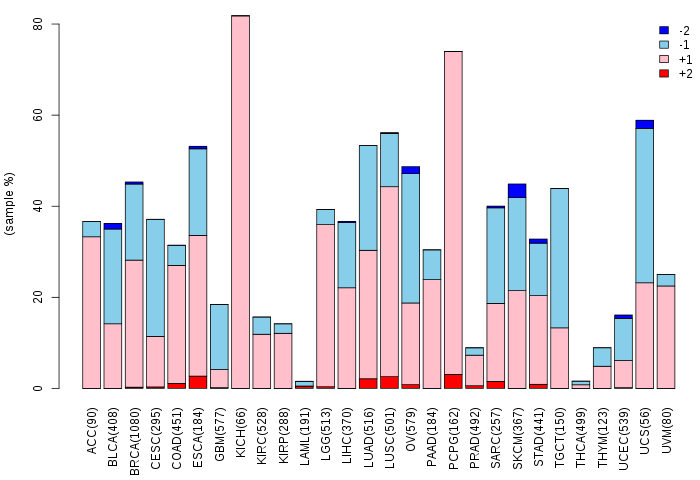
| Copy number variations of TissGene across 28 cancer types (X-axis: cancer type and Y-axis: % of CNV samples) (TCGA Gistic2_CopyNumber_Gistic2_all_data_by_genes, Gistic2 copy number data, version 2016-08-16) |
 |
| Top |
| TissGeneFusions for KIF18A |
| Fusion genes including TissGene (ChimerDB 3.0, 2016-12-01 and TCGA fusion Portal 2015-12-01) |
| Database | Src | Cancer type | Sample | Fusion gene | ORF | 5'-gene BP | 3'-gene BP |
| Top |
| TissGeneNet for KIF18A |
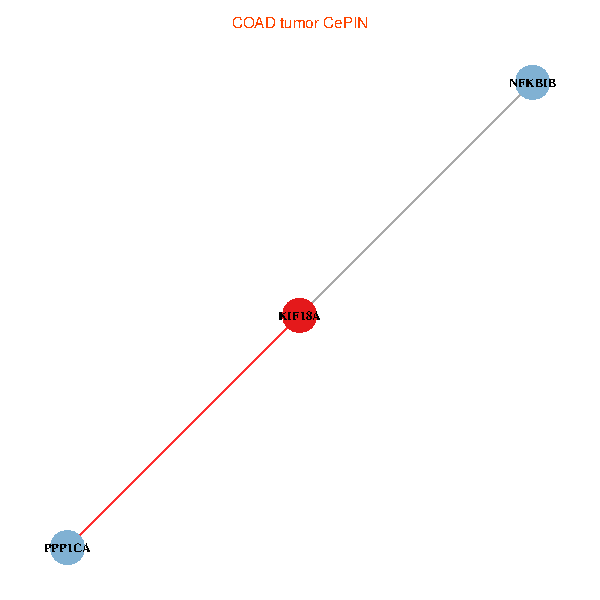
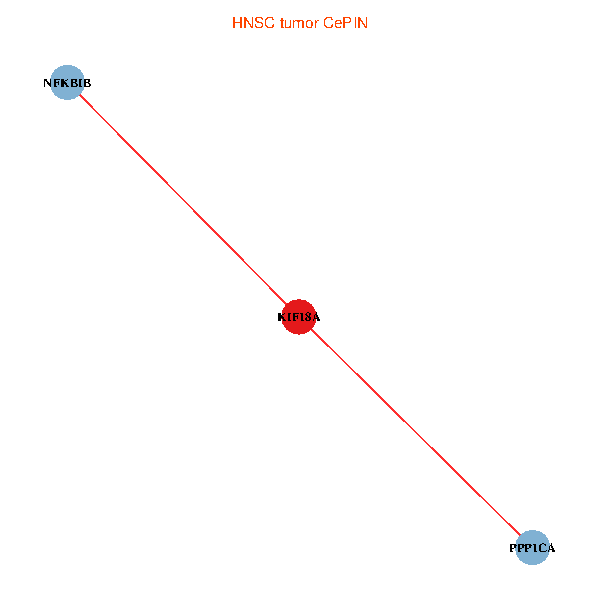
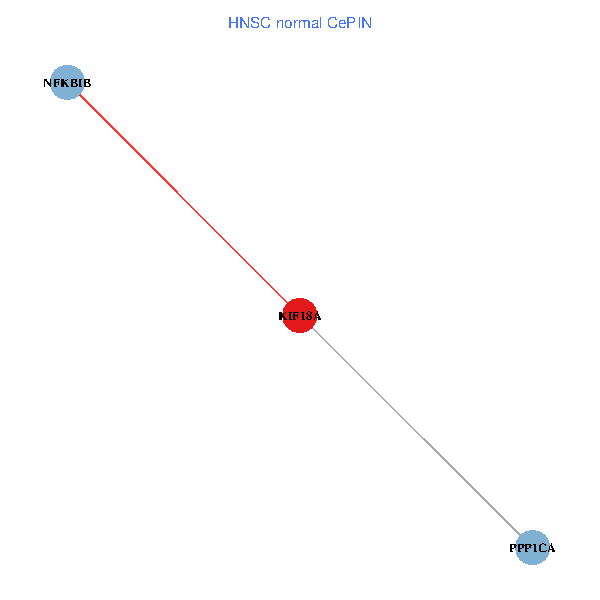
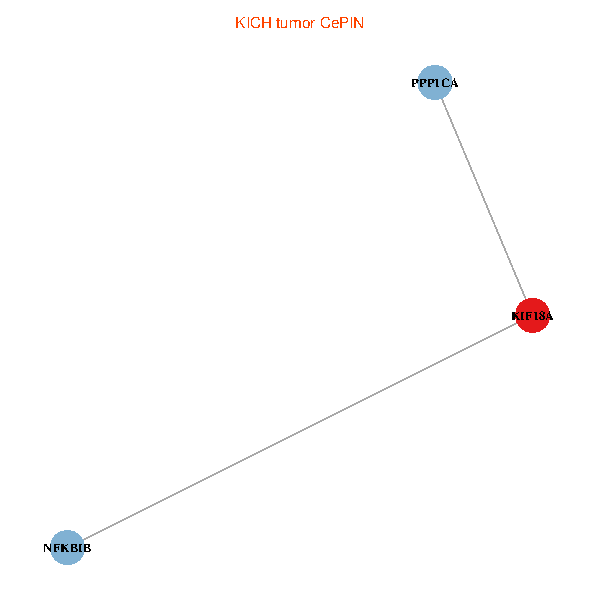
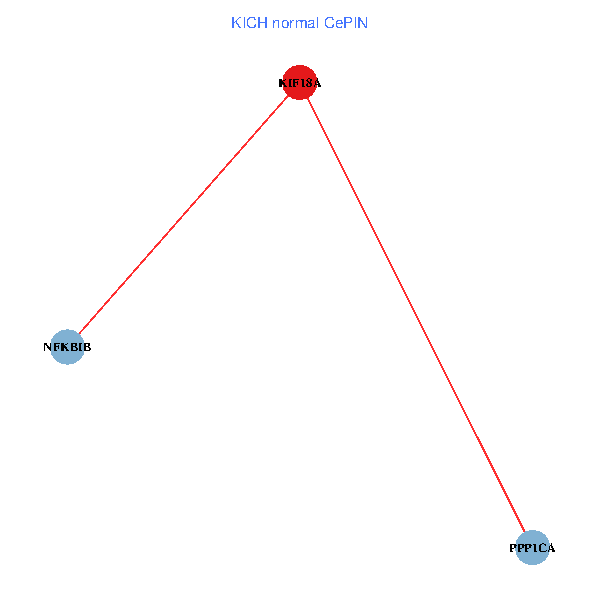
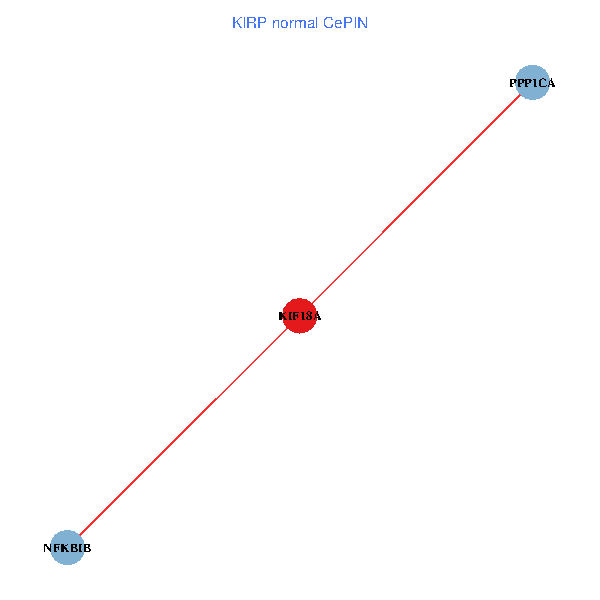
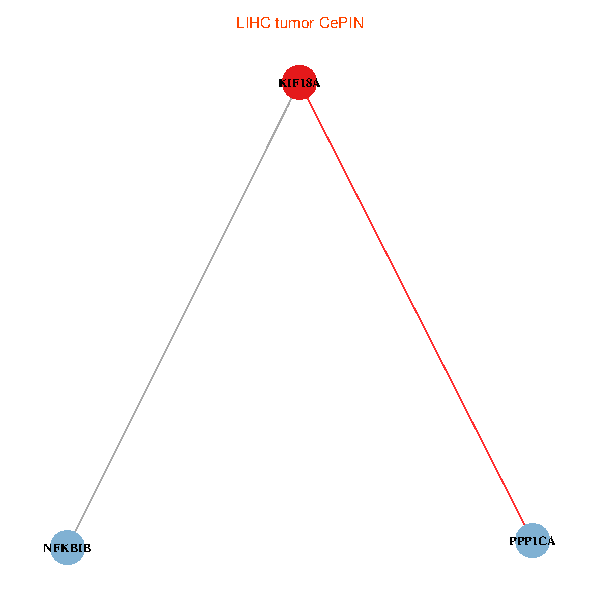
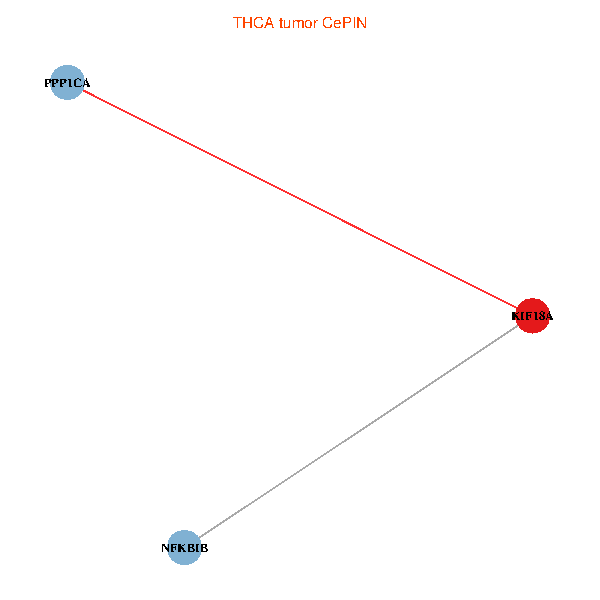
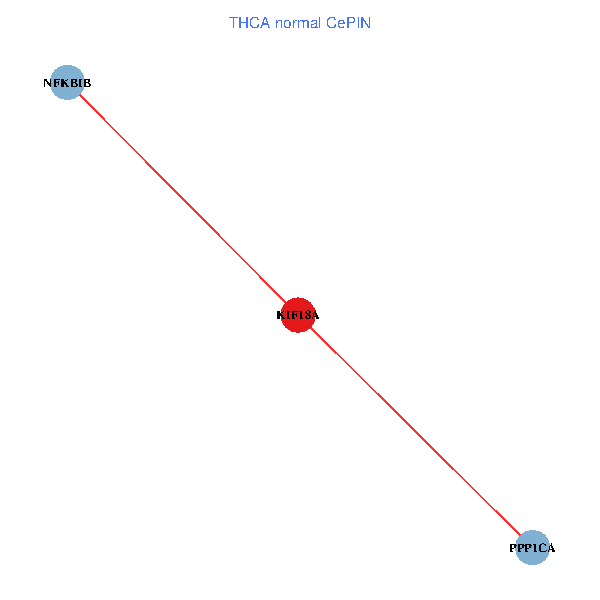
| Co-expressed gene networks based on protein-protein interaction data (CePIN) (TCGA IlluminaHiSeq_RNASeqV2, pan-cancer normalized log2(norm_counts+1) data, version 2016-08-16) (PINA2 ppi data) |
| BRCA (tumor) | BRCA (normal) |
| KIF18A, PPP1CA, NFKBIB (tumor) | KIF18A, PPP1CA, NFKBIB (normal) |
 |  |
| COAD (tumor) | COAD (normal) |
| KIF18A, PPP1CA, NFKBIB (tumor) | KIF18A, PPP1CA, NFKBIB (normal) |
 |  |
| HNSC (tumor) | HNSC (normal) |
| KIF18A, PPP1CA, NFKBIB (tumor) | KIF18A, PPP1CA, NFKBIB (normal) |
 |  |
| KICH (tumor) | KICH (normal) |
| KIF18A, PPP1CA, NFKBIB (tumor) | KIF18A, PPP1CA, NFKBIB (normal) |
 |  |
| KIRC (tumor) | KIRC (normal) |
| KIF18A, PPP1CA, NFKBIB (tumor) | KIF18A, PPP1CA, NFKBIB (normal) |
 |  |
| KIRP (tumor) | KIRP (normal) |
| KIF18A, PPP1CA, NFKBIB (tumor) | KIF18A, PPP1CA, NFKBIB (normal) |
 |  |
| LIHC (tumor) | LIHC (normal) |
| KIF18A, PPP1CA, NFKBIB (tumor) | KIF18A, PPP1CA, NFKBIB (normal) |
 |  |
| LUAD (tumor) | LUAD (normal) |
| KIF18A, PPP1CA, NFKBIB (tumor) | KIF18A, PPP1CA, NFKBIB (normal) |
 |  |
| LUSC (tumor) | LUSC (normal) |
| KIF18A, PPP1CA, NFKBIB (tumor) | KIF18A, PPP1CA, NFKBIB (normal) |
 |  |
| PRAD (tumor) | PRAD (normal) |
| KIF18A, PPP1CA, NFKBIB (tumor) | KIF18A, PPP1CA, NFKBIB (normal) |
 |  |
| STAD (tumor) | STAD (normal) |
| KIF18A, PPP1CA, NFKBIB (tumor) | KIF18A, PPP1CA, NFKBIB (normal) |
 |  |
| THCA (tumor) | THCA (normal) |
| KIF18A, PPP1CA, NFKBIB (tumor) | KIF18A, PPP1CA, NFKBIB (normal) |
 |  |
| Top |
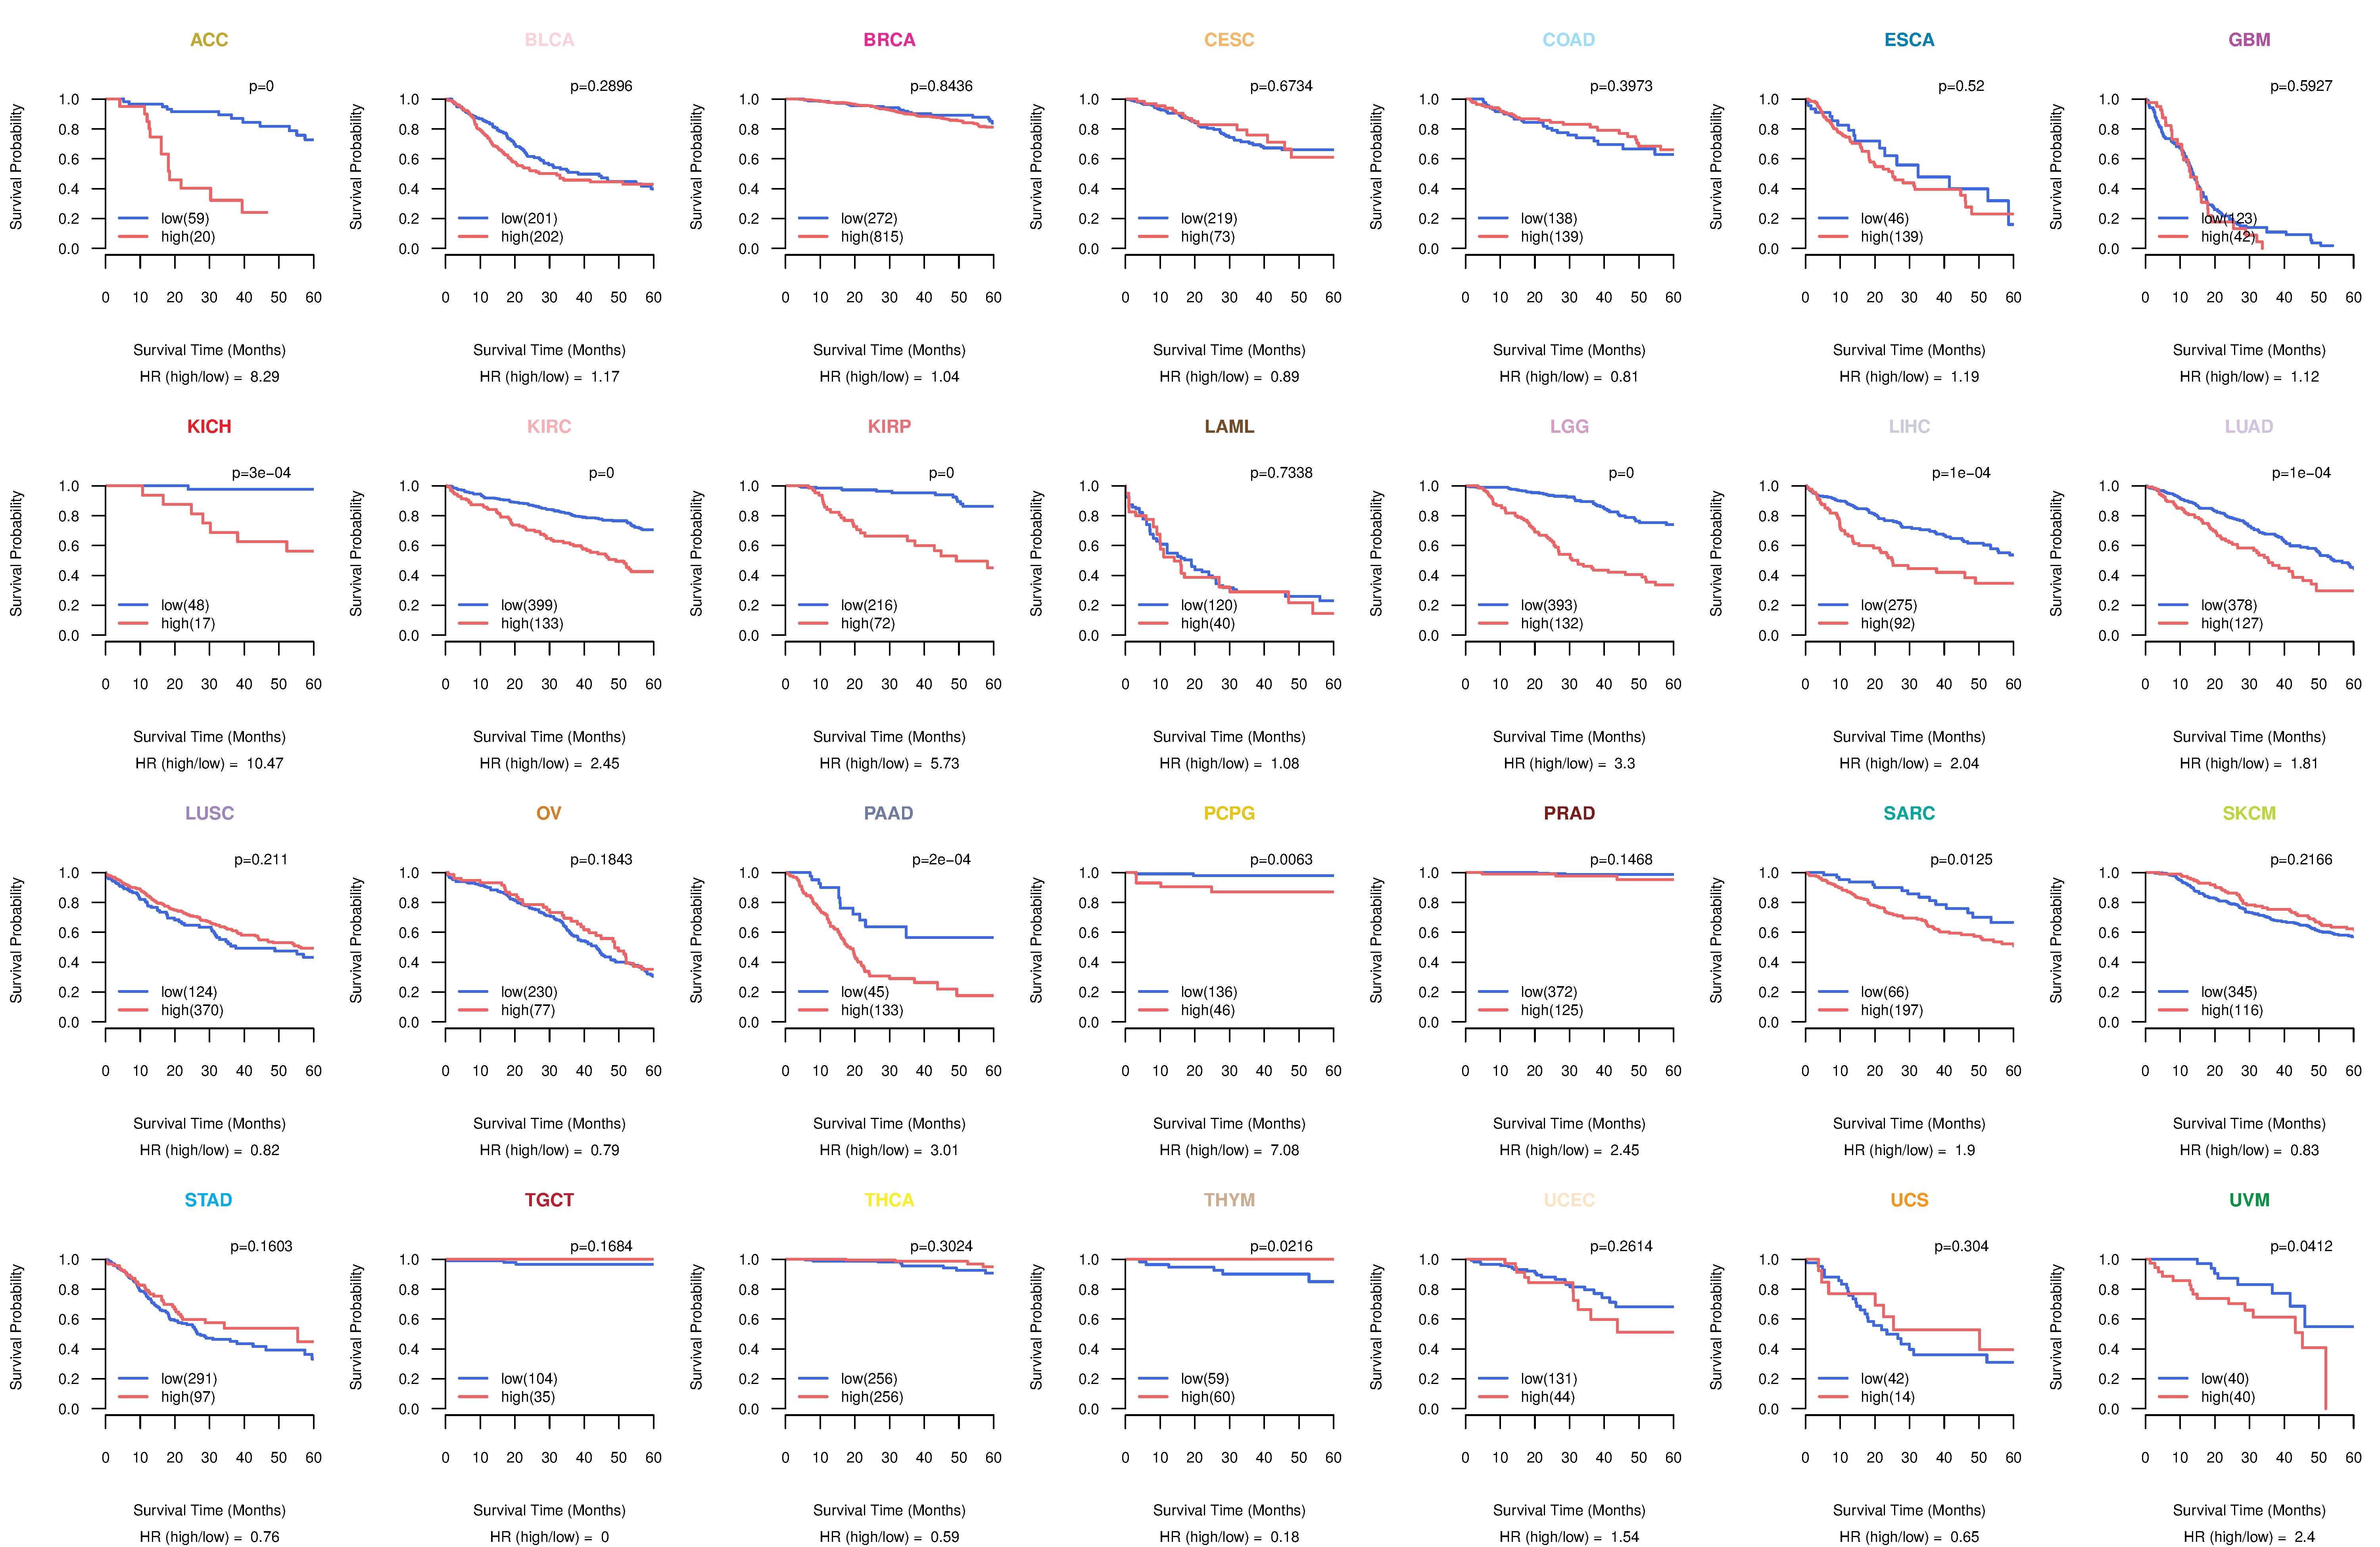
| TissGeneProg for KIF18A |
| Kaplan-Meier plots with logrank tests of overall survival (OS) using 28 cancer types (TCGA IlluminaHiSeq_RNASeqV2, pan-cancer normalized log2(norm_counts+1) data, version 2016-08-16) (TCGA clinicalMatrix, phenotype data, version 2016-04-27) * Click on the image to enlarge it in a new window. |
 |
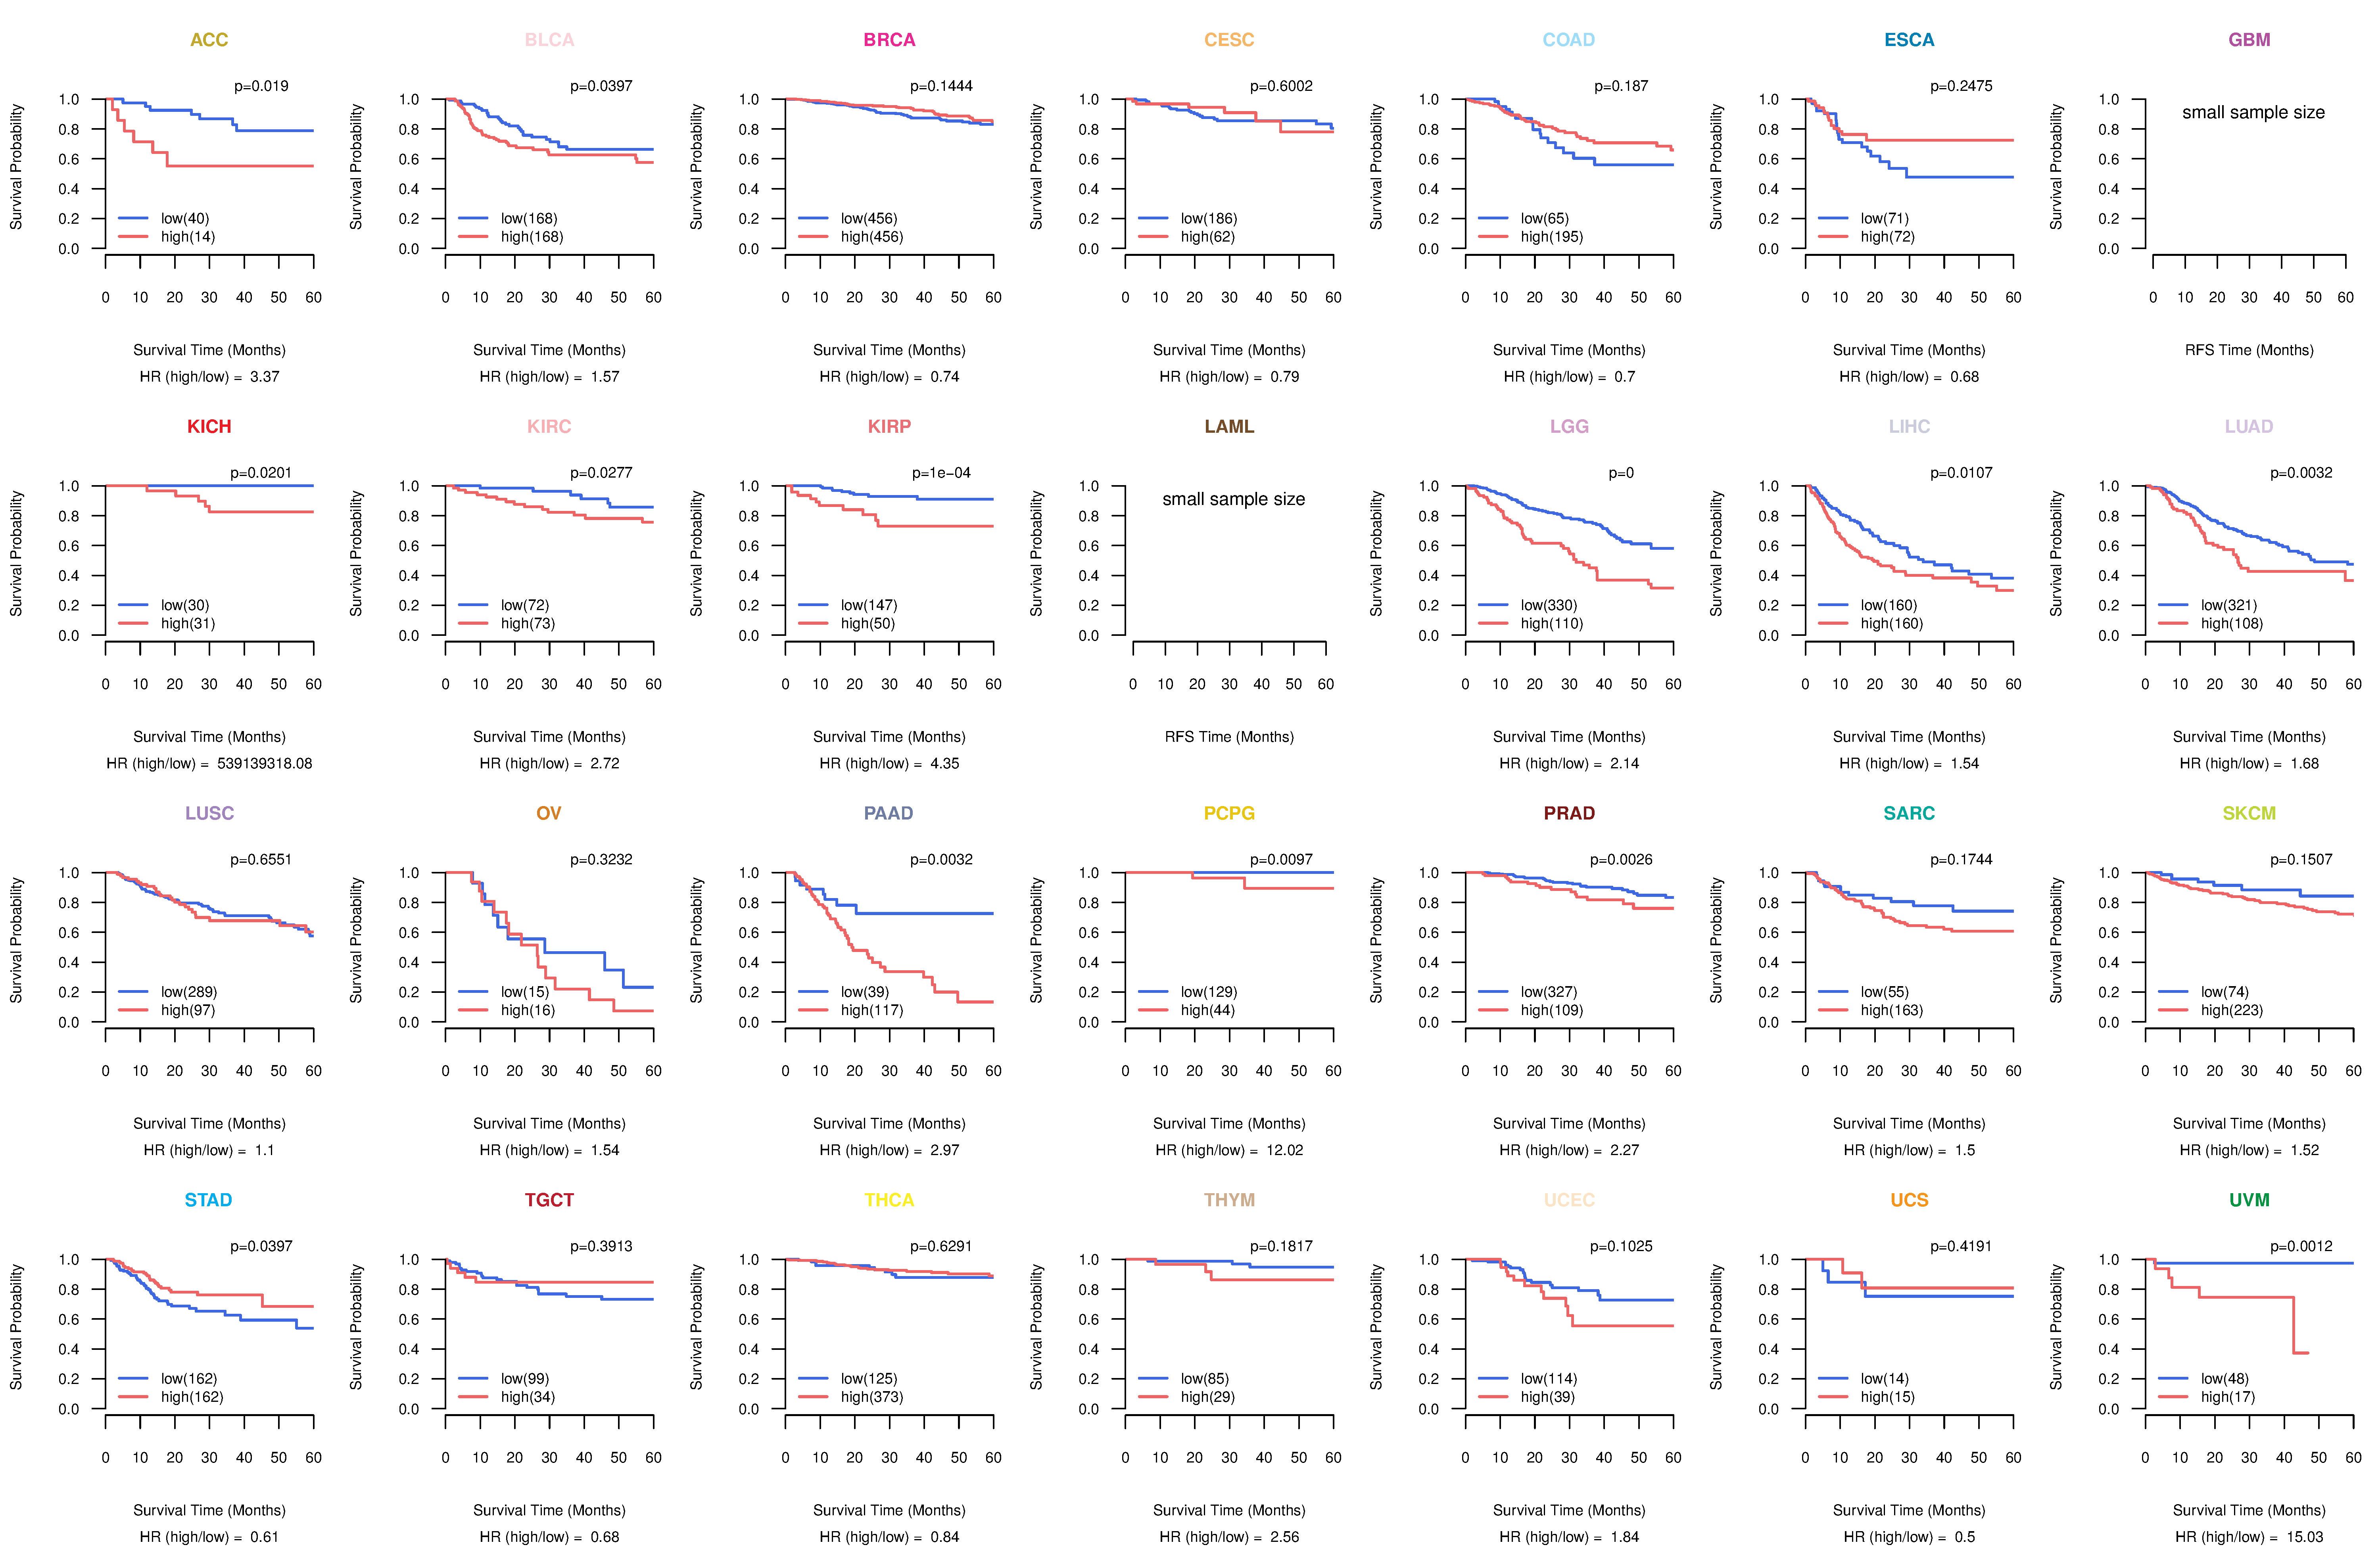
| Kaplan-Meier plots with logrank test of relapse free survival (RFS) using 28 cancer types (TCGA IlluminaHiSeq_RNASeqV2, pan-cancer normalized log2(norm_counts+1) data, version 2016-08-16) (TCGA clinicalMatrix, phenotype data, version 2016-04-27) * Click on the image enlarge it in a new window. |
 |
| Forest plot of Cox proportional hazard ratio (HR) and 95% CI of overall survival (OS) using 28 cancer types (TCGA IlluminaHiSeq_RNASeqV2, pan-cancer normalized log2(norm_counts+1) data, version 2016-08-16) (TCGA clinicalMatrix, phenotype data, version 2016-04-27) * Click on the image enlarge it in a new window. |
 |
| Forest plot of Cox proportional hazard ratio (HR) and 95% CI of relapse free survival (RFS) using 28 cancer types (TCGA IlluminaHiSeq_RNASeqV2, pan-cancer normalized log2(norm_counts+1) data, version 2016-08-16) (TCGA clinicalMatrix, phenotype data, version 2016-04-27) * Click on the image enlarge it in a new window. |
 |
| Top |
| TissGeneClin for KIF18A |
| TissGeneDrug for KIF18A |
| Drug information targeting TissGene (DrugBank Version 5.0.6, 2017-04-01) |
| DrugBank ID | Drug name | Drug activity | Drug type | Drug status |
| Top |
| TissGeneDisease for KIF18A |
| Disease information associated with TissGene (DisGeNet, 2016-06-01) |
| Disease ID | Disease name | # pubmeds | Source |
| umls:C0027627 | Neoplasm Metastasis | 2 | BeFree |
| umls:C0006142 | Malignant neoplasm of breast | 1 | BeFree |
| umls:C0009402 | Colorectal Carcinoma | 1 | BeFree |
| umls:C0017661 | IGA Glomerulonephritis | 1 | CTD_human |
| umls:C0178874 | Tumor Progression | 1 | BeFree |
| umls:C0279000 | Liver and Intrahepatic Biliary Tract Carcinoma | 1 | BeFree |
| umls:C0345904 | Malignant neoplasm of liver | 1 | BeFree |
| umls:C0596263 | Carcinogenesis | 1 | BeFree |
| umls:C0678222 | Breast Carcinoma | 1 | BeFree |
| umls:C0686619 | Secondary malignant neoplasm of lymph node | 1 | BeFree |
| umls:C1527249 | Colorectal Cancer | 1 | BeFree |
| umls:C2239176 | Liver carcinoma | 1 | BeFree |
|
Copyright 2016-Present - The University of Texas Health Science Center at Houston (UTHealth) Web File Viewing | How to Report, Fraud, Waste and Abuse | State of Texas | Statewide Search | Texas Homeland Security | Site Policies |