 |
| |
| |
| |
| |
| |
| |
|

| TissGeneSummary for TEX101 |
 Gene summary Gene summary |
| Basic gene information | Gene symbol | TEX101 |
| Gene name | testis expressed 101 | |
| Synonyms | CT131|GTPR867|NYD-SP8|PRO1884|SGRG|SPATA44|TES101RP | |
| Cytomap | UCSC genome browser: 19q13.31 | |
| Type of gene | protein-coding | |
| RefGenes | NM_001130011.1, NM_031451.4, | |
| Description | cancer/testis antigen 131cell surface receptor NYD-SP8scleroderma-associated autoantigenspermatogenesis associated 44spermatogenesis-related gene proteintestis expressed sequence 101testis-expressed protein 101testis-expressed sequence 101 protein | |
| Modification date | 20141207 | |
| dbXrefs | MIM : 612665 | |
| HGNC : HGNC | ||
| Ensembl : ENSG00000131126 | ||
| HPRD : 15490 | ||
| Vega : OTTHUMG00000182695 | ||
| Protein | UniProt: go to UniProt's Cross Reference DB Table | |
| Expression | CleanEX: HS_TEX101 | |
| BioGPS: 83639 | ||
| Pathway | NCI Pathway Interaction Database: TEX101 | |
| KEGG: TEX101 | ||
| REACTOME: TEX101 | ||
| Pathway Commons: TEX101 | ||
| Context | iHOP: TEX101 | |
| ligand binding site mutation search in PubMed: TEX101 | ||
| UCL Cancer Institute: TEX101 | ||
| Assigned class in TissGDB* | A | |
| Included tissue-specific gene expression resources | ||
| Specific-tissues in normal samples (assigned by TissGDB using HPA, TiGER, and GTEx) | Testis | |
| Cancer types related to the specific-tissues in cancer samples (assigned by TissGDB using TCGA) | TGCT | |
| Reference showing the relevant tissue of TEX101 | Gene suppression of mouse testis in vivo using small interfering RNA derived from plasmid vectors. Acta Histochem Cytochem. 2012 Feb 29;45(1):77-81. doi: 10.1267/ahc.11024. Epub 2011 Dec 28. (pmid:22489107) go to article | |
| Description by TissGene annotations | ||
| * Class A consists of genes with literature evidence and is part of the cTissGenes. Class B consists of only cTissGenes without additional evidence. The remaining genes belong to Class C. |
| Gene ontology having evidence of Inferred from Direct Assay (IDA) from Entrez |
| GO ID | GO term | PubMed ID |
| Top |
| TissGeneExp for TEX101 |
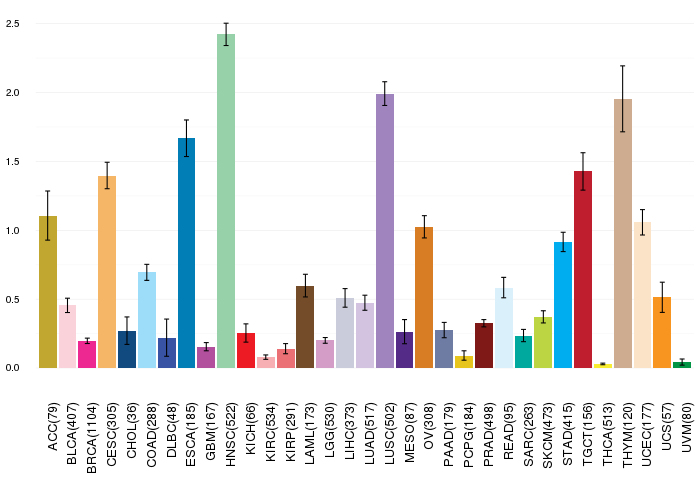
| Gene expressions across 28 cancer types (X-axis: cancer type and Y-axis: log2(norm_counts+1)) (TCGA IlluminaHiSeq_RNASeqV2, pan-cancer normalized log2(norm_counts+1) data, version 2016-08-16) |
 |
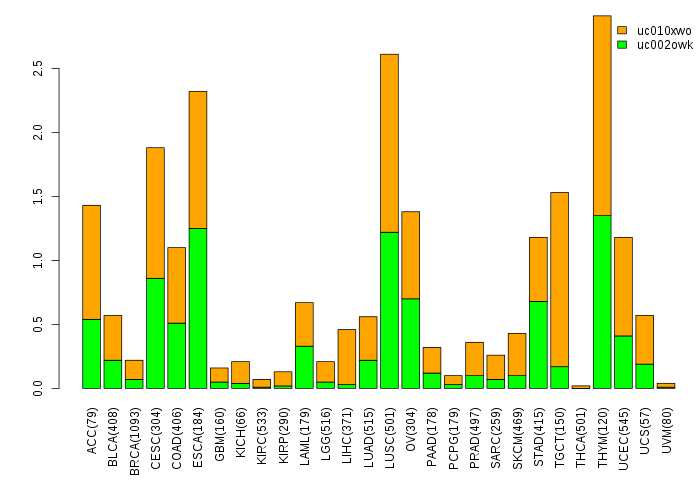
| Gene isoform expressions across 28 cancer types (X-axis: cancer type and Y-axis: log2(norm_counts+1)) (TCGA pan-cancer tcga_rsem_isoform_tpm, version 2016-09-01) |
 |
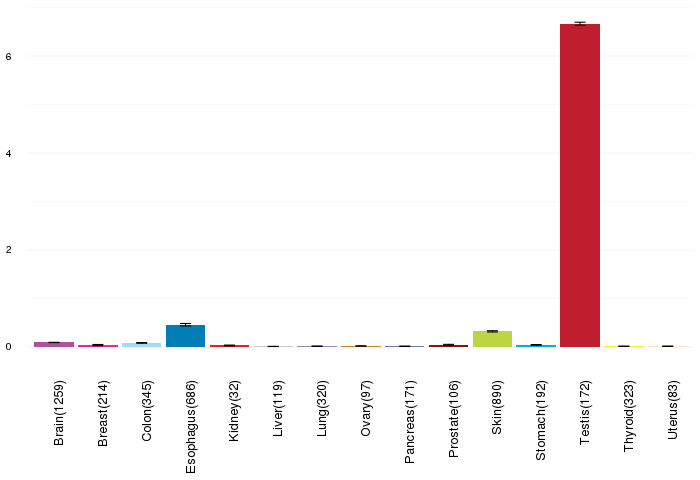
| Gene expressions across normal tissues of GTEx data (GTEx GTEx_Analysis_v6_RNA-seq_RNA-SeQCv1.1.8_gene_rpkm.gct) - Here, we shows the matched tissue types only among our 28 cancer types. |
 |
| Different expressions across 14 cancer types with more than 10 samples between matched tumors and normals (X-axis: cancer type and Y-axis: log2(norm_counts+1)) (TCGA IlluminaHiSeq_RNASeqV2, pan-cancer normalized log2(norm_counts+1) data, version 2016-08-16) |
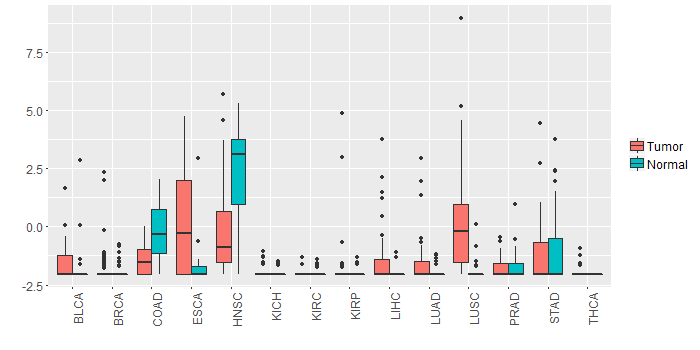 |
| - Significantly differentially expressed cancer types and information. (|Fold change|>1 and FDR<0.05) |
| Cancer type | Mean(exp) in tumor | Mean(exp) in matched normal | Log2FC | P-val. | FDR |
| HNSC | -0.214303992 | 2.151735543 | -2.366039535 | 9.76E-07 | 7.44E-06 |
| LUSC | 0.26932045 | -1.939283472 | 2.208603922 | 6.63E-09 | 2.12E-08 |
| COAD | -1.44080587 | -0.177352024 | -1.263453846 | 4.49E-05 | 0.000176935 |
| Top |
| TissGene-miRNA for TEX101 |
| Significantly anti-correlated miRNAs of TissGene across 28 cancer types (Gene-miRNA relations from TargetScanHuman Relsease 7.1, Conserved_Site_Context_Scores.txt.zip, 06.01.2016) (TCGA IlluminaHiSeq_miRNASeq, log2(RPM+1) data, version 2016-11-21) (TCGA IlluminaHiSeq_RNASeqV2, log2(normalized_count+1) data, version 2016-08-16) (Spearman’s Rank Correlation (p-value<0.05 and coefficient<-0.25)) |
| Cancer type | miRNA id | miRNA accession | P-val. | Coeff. | # samples |
| Top |
| TissGeneMut for TEX101 |
| TissGeneSNV for TEX101 |
| nsSNV counts per each loci. Different colors of circles represent different cancer types. Circle size denotes number of samples. (TCGA somatic mutation (SNPs and small INDELs) data, version 2016-04-25) * Click on the image to enlarge it in a new window. |
 |
 |
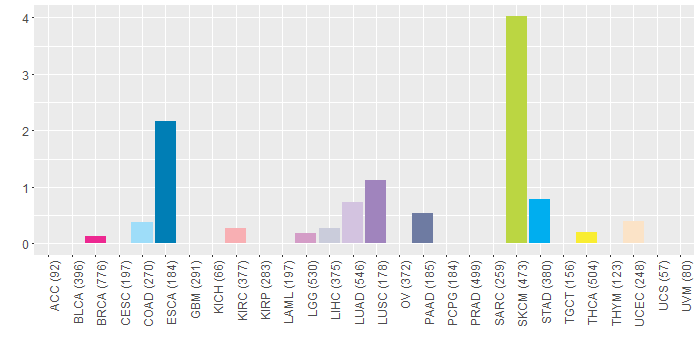
| Somatic nucleotide variants of TissGene across 28 cancer types (X-axis: cancer type and Y-axis: % of mutated samples) The numbers in parentheses are numbers of samples with mutation (nsSNVs). (TCGA somatic mutation (SNPs and small INDELs) data, version 2016-04-25) |
 |
| - nsSNVs sorted by frequency. |
| AAchange | Cancer type | # samples |
| p.P248S | SKCM | 2 |
| p.S267F | SKCM | 2 |
| p.P174L | SKCM | 2 |
| p.E225K | SKCM | 2 |
| p.G75W | ESCA | 1 |
| p.W64X | STAD | 1 |
| p.G75R | SKCM | 1 |
| p.T81S | BRCA | 1 |
| p.T151S | KIRC | 1 |
| p.S178* | PAAD | 1 |
| p.S196* | PAAD | 1 |
| p.T190N | LUAD | 1 |
| p.C175F | LUSC | 1 |
| p.Q140H | LUAD | 1 |
| p.C132R | HNSC | 1 |
| p.G208S | SKCM | 1 |
| p.E110Q | LUAD | 1 |
| p.G103R | SKCM | 1 |
| p.T13I | STAD | 1 |
| p.T155I | SKCM | 1 |
| p.P261T | THCA | 1 |
| p.A205T | SKCM | 1 |
| p.E80K | SKCM | 1 |
| p.G185E | SKCM | 1 |
| p.R236Q | LGG | 1 |
| p.G202C | LUAD | 1 |
| p.T172N | LUAD | 1 |
| p.A95V | ESCA | 1 |
| p.S196X | PAAD | 1 |
| p.P176T | SKCM | 1 |
| p.H229Q | LUSC | 1 |
| p.G185V | ESCA | 1 |
| p.W142L | SKCM | 1 |
| p.E104K | LIHC | 1 |
| p.P101L | ESCA | 1 |
| p.T96M | COAD | 1 |
| p.A208V | STAD | 1 |
| p.Q122H | LUAD | 1 |
| p.C114R | HNSC | 1 |
| p.A226V | STAD | 1 |
| p.W46* | STAD | 1 |
| p.P116L | SKCM | 1 |
| p.S213P | SKCM | 1 |
| p.W142* | SKCM | 1 |
| p.I215L | UCEC | 1 |
| Top |
| TissGeneCNV for TEX101 |
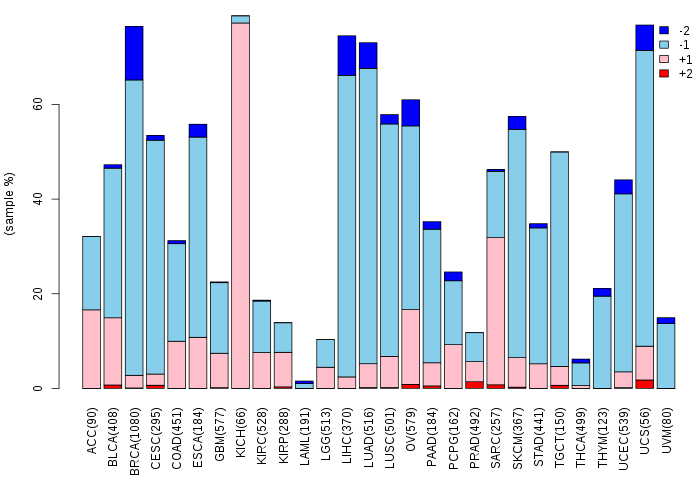
| Copy number variations of TissGene across 28 cancer types (X-axis: cancer type and Y-axis: % of CNV samples) (TCGA Gistic2_CopyNumber_Gistic2_all_data_by_genes, Gistic2 copy number data, version 2016-08-16) |
 |
| Top |
| TissGeneFusions for TEX101 |
| Fusion genes including TissGene (ChimerDB 3.0, 2016-12-01 and TCGA fusion Portal 2015-12-01) |
| Database | Src | Cancer type | Sample | Fusion gene | ORF | 5'-gene BP | 3'-gene BP |
| Top |
| TissGeneNet for TEX101 |
| Co-expressed gene networks based on protein-protein interaction data (CePIN) (TCGA IlluminaHiSeq_RNASeqV2, pan-cancer normalized log2(norm_counts+1) data, version 2016-08-16) (PINA2 ppi data) |
| Top |
| TissGeneProg for TEX101 |
| Kaplan-Meier plots with logrank tests of overall survival (OS) using 28 cancer types (TCGA IlluminaHiSeq_RNASeqV2, pan-cancer normalized log2(norm_counts+1) data, version 2016-08-16) (TCGA clinicalMatrix, phenotype data, version 2016-04-27) * Click on the image to enlarge it in a new window. |
 |
| Kaplan-Meier plots with logrank test of relapse free survival (RFS) using 28 cancer types (TCGA IlluminaHiSeq_RNASeqV2, pan-cancer normalized log2(norm_counts+1) data, version 2016-08-16) (TCGA clinicalMatrix, phenotype data, version 2016-04-27) * Click on the image enlarge it in a new window. |
 |
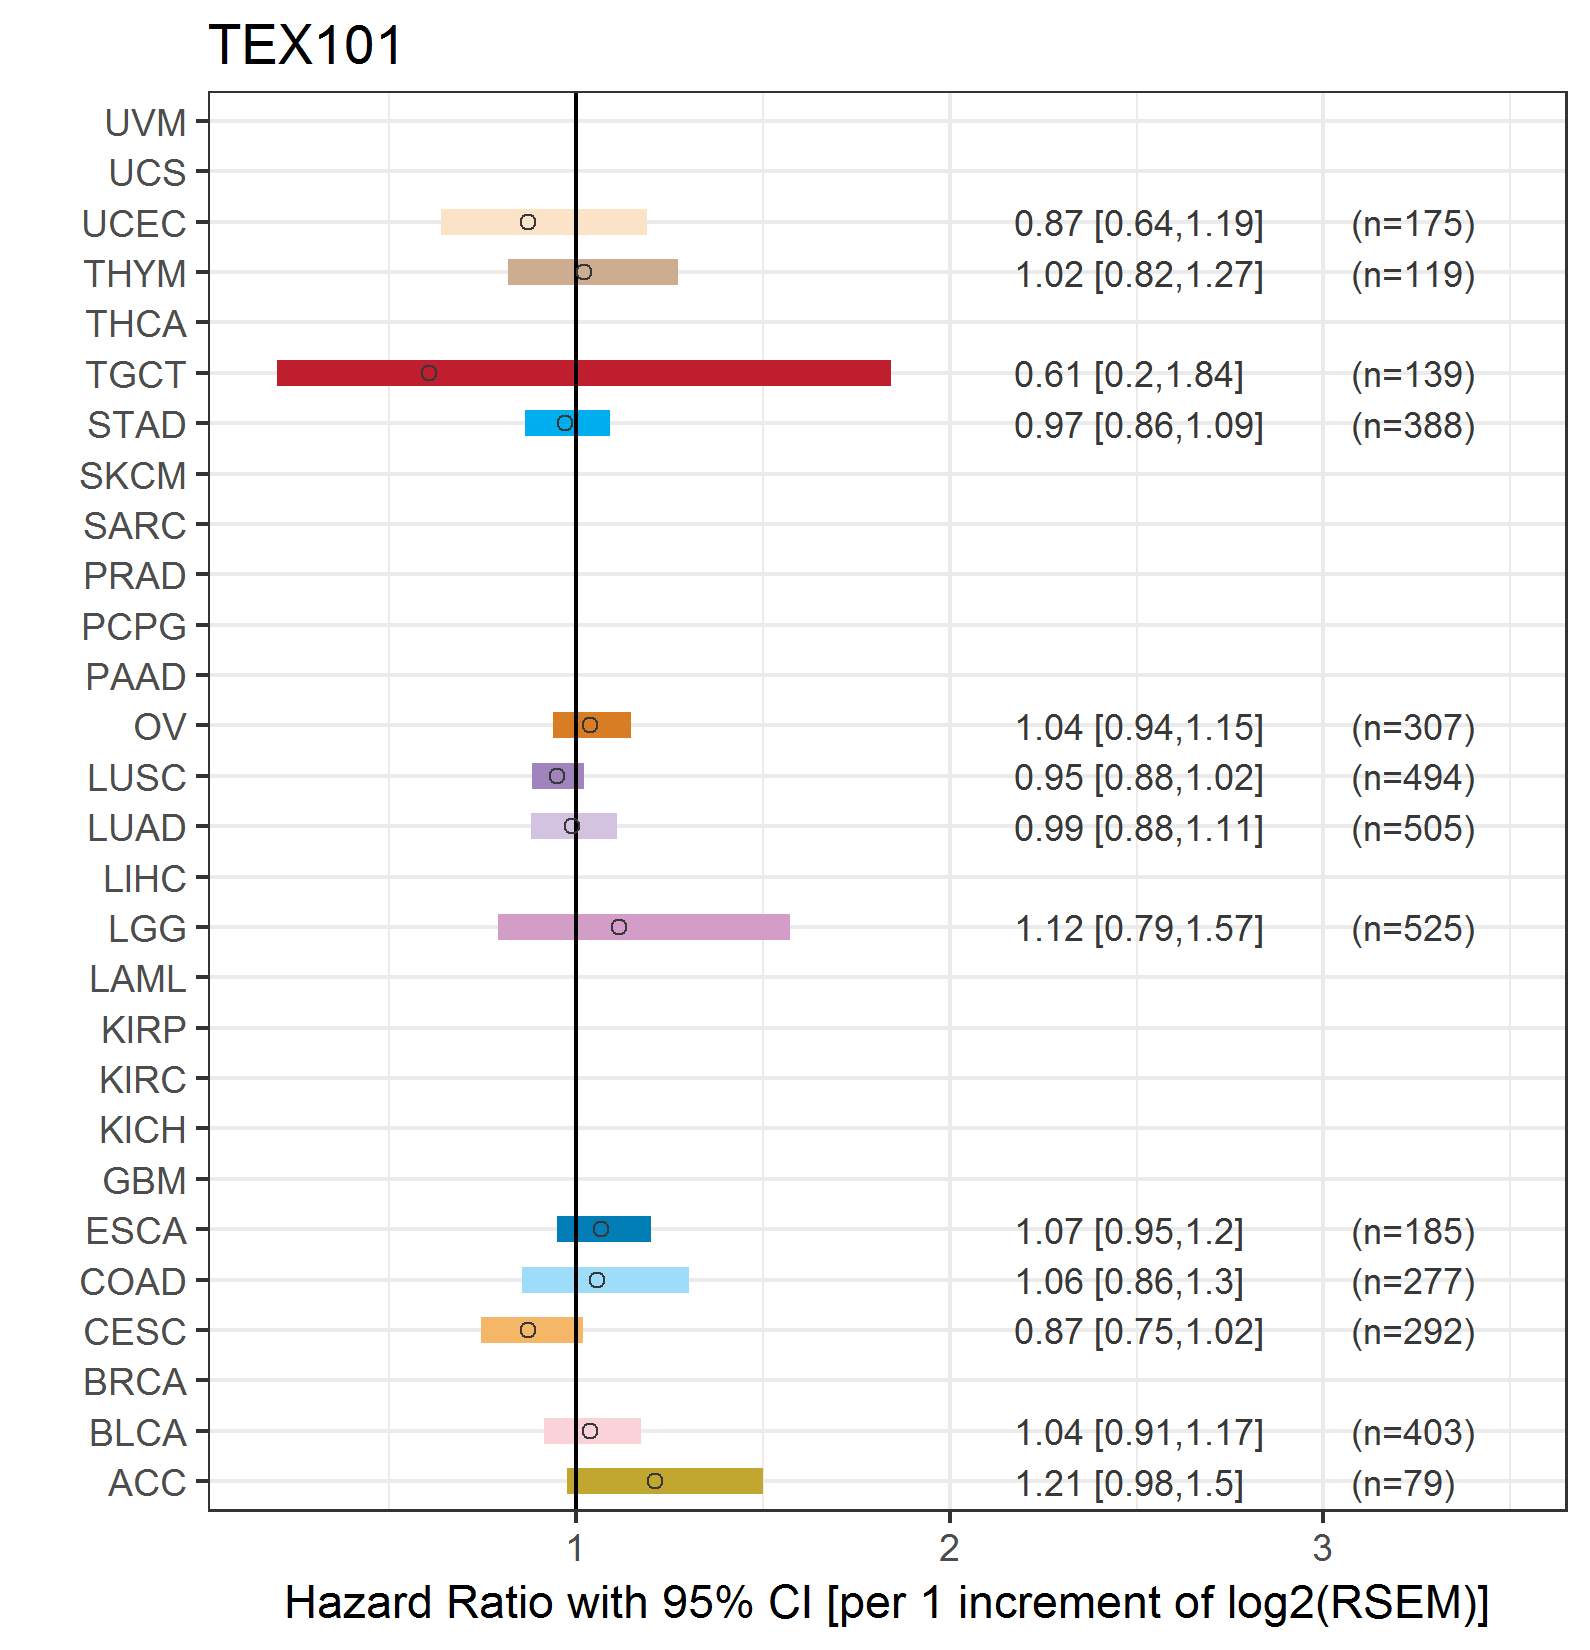
| Forest plot of Cox proportional hazard ratio (HR) and 95% CI of overall survival (OS) using 28 cancer types (TCGA IlluminaHiSeq_RNASeqV2, pan-cancer normalized log2(norm_counts+1) data, version 2016-08-16) (TCGA clinicalMatrix, phenotype data, version 2016-04-27) * Click on the image enlarge it in a new window. |
 |
| Forest plot of Cox proportional hazard ratio (HR) and 95% CI of relapse free survival (RFS) using 28 cancer types (TCGA IlluminaHiSeq_RNASeqV2, pan-cancer normalized log2(norm_counts+1) data, version 2016-08-16) (TCGA clinicalMatrix, phenotype data, version 2016-04-27) * Click on the image enlarge it in a new window. |
 |
| Top |
| TissGeneClin for TEX101 |
| TissGeneDrug for TEX101 |
| Drug information targeting TissGene (DrugBank Version 5.0.6, 2017-04-01) |
| DrugBank ID | Drug name | Drug activity | Drug type | Drug status |
| Top |
| TissGeneDisease for TEX101 |
| Disease information associated with TissGene (DisGeNet, 2016-06-01) |
| Disease ID | Disease name | # pubmeds | Source |
| umls:C0001418 | Adenocarcinoma | 1 | BeFree |
| umls:C0006142 | Malignant neoplasm of breast | 1 | BeFree |
| umls:C0678222 | Breast Carcinoma | 1 | BeFree |
| umls:C1176475 | Ductal Carcinoma | 1 | BeFree |
| umls:C1527349 | Ductal Breast Carcinoma | 1 | BeFree |
| umls:C3811653 | Experimental Organism Basal Cell Carcinoma | 1 | BeFree |
|
Copyright 2016-Present - The University of Texas Health Science Center at Houston (UTHealth) Web File Viewing | How to Report, Fraud, Waste and Abuse | State of Texas | Statewide Search | Texas Homeland Security | Site Policies |