 |
| |
| |
| |
| |
| |
| |
|

| TissGeneSummary for TSSK6 |
 Gene summary Gene summary |
| Basic gene information | Gene symbol | TSSK6 |
| Gene name | testis-specific serine kinase 6 | |
| Synonyms | CT72|SSTK|TSSK4 | |
| Cytomap | UCSC genome browser: 19p13.11 | |
| Type of gene | protein-coding | |
| RefGenes | NM_032037.3, | |
| Description | TSK-6cancer/testis antigen 72serine/threonine protein kinase SSTKsmall serine/threonine kinasetestis-specific serine/threonine-protein kinase 6 | |
| Modification date | 20141207 | |
| dbXrefs | MIM : 610712 | |
| HGNC : HGNC | ||
| Ensembl : ENSG00000178093 | ||
| HPRD : 15441 | ||
| Vega : OTTHUMG00000182146 | ||
| Protein | UniProt: go to UniProt's Cross Reference DB Table | |
| Expression | CleanEX: HS_TSSK6 | |
| BioGPS: 83983 | ||
| Pathway | NCI Pathway Interaction Database: TSSK6 | |
| KEGG: TSSK6 | ||
| REACTOME: TSSK6 | ||
| Pathway Commons: TSSK6 | ||
| Context | iHOP: TSSK6 | |
| ligand binding site mutation search in PubMed: TSSK6 | ||
| UCL Cancer Institute: TSSK6 | ||
| Assigned class in TissGDB* | A | |
| Included tissue-specific gene expression resources | HPA,TiGER,GTEx | |
| Specific-tissues in normal samples (assigned by TissGDB using HPA, TiGER, and GTEx) | Testis | |
| Cancer types related to the specific-tissues in cancer samples (assigned by TissGDB using TCGA) | TGCT | |
| Reference showing the relevant tissue of TSSK6 | Cloning, sequence characterization, and expression patterns of members of the porcine TSSK family. Genet Mol Res. 2015 Nov 23;14(4):14908-19. doi: 10.4238/2015.October.18.56. (pmid:) go to article | |
| Description by TissGene annotations | Cancer gene Have significant anti-correlated miRNA TissgsLTS | |
| * Class A consists of genes with literature evidence and is part of the cTissGenes. Class B consists of only cTissGenes without additional evidence. The remaining genes belong to Class C. |
| Gene ontology having evidence of Inferred from Direct Assay (IDA) from Entrez |
| GO ID | GO term | PubMed ID | GO:0006468 | protein phosphorylation | 15870294 | GO:0006468 | protein phosphorylation | 15870294 |
| Top |
| TissGeneExp for TSSK6 |
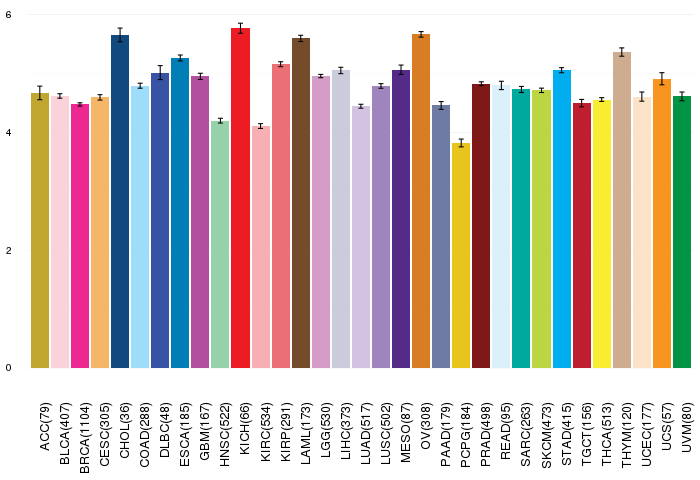
| Gene expressions across 28 cancer types (X-axis: cancer type and Y-axis: log2(norm_counts+1)) (TCGA IlluminaHiSeq_RNASeqV2, pan-cancer normalized log2(norm_counts+1) data, version 2016-08-16) |
 |
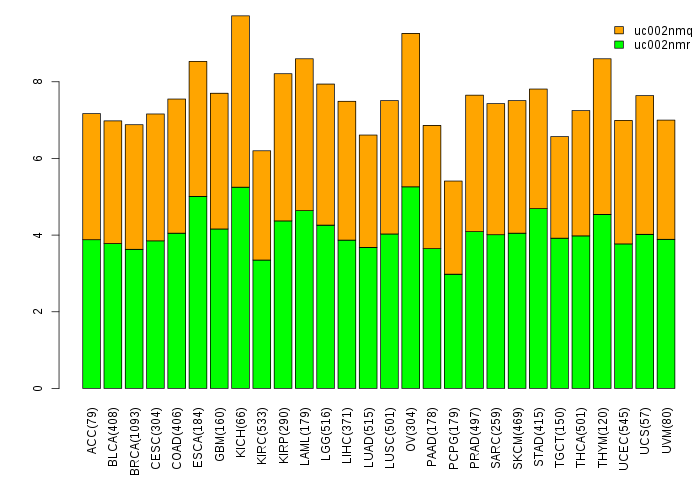
| Gene isoform expressions across 28 cancer types (X-axis: cancer type and Y-axis: log2(norm_counts+1)) (TCGA pan-cancer tcga_rsem_isoform_tpm, version 2016-09-01) |
 |
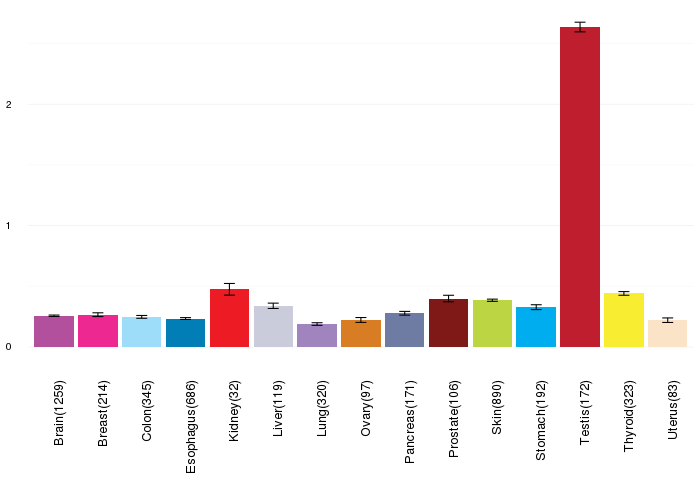
| Gene expressions across normal tissues of GTEx data (GTEx GTEx_Analysis_v6_RNA-seq_RNA-SeQCv1.1.8_gene_rpkm.gct) - Here, we shows the matched tissue types only among our 28 cancer types. |
 |
| Different expressions across 14 cancer types with more than 10 samples between matched tumors and normals (X-axis: cancer type and Y-axis: log2(norm_counts+1)) (TCGA IlluminaHiSeq_RNASeqV2, pan-cancer normalized log2(norm_counts+1) data, version 2016-08-16) |
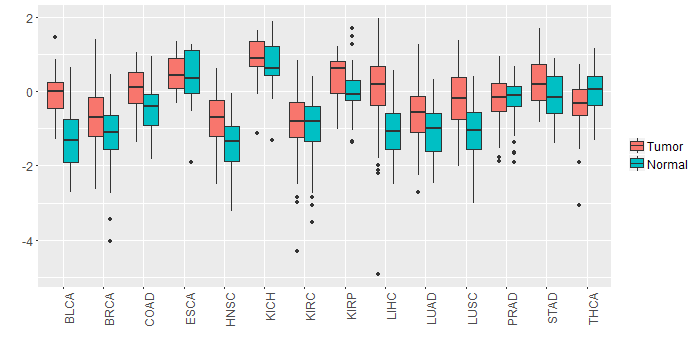 |
| - Significantly differentially expressed cancer types and information. (|Fold change|>1 and FDR<0.05) |
| Cancer type | Mean(exp) in tumor | Mean(exp) in matched normal | Log2FC | P-val. | FDR |
| LIHC | -0.017029984 | -1.117223984 | 1.100194 | 2.79E-07 | 1.72E-06 |
| BLCA | -0.051273669 | -1.282778932 | 1.231505263 | 4.04E-05 | 0.000547239 |
| Top |
| TissGene-miRNA for TSSK6 |
| Significantly anti-correlated miRNAs of TissGene across 28 cancer types (Gene-miRNA relations from TargetScanHuman Relsease 7.1, Conserved_Site_Context_Scores.txt.zip, 06.01.2016) (TCGA IlluminaHiSeq_miRNASeq, log2(RPM+1) data, version 2016-11-21) (TCGA IlluminaHiSeq_RNASeqV2, log2(normalized_count+1) data, version 2016-08-16) (Spearman’s Rank Correlation (p-value<0.05 and coefficient<-0.25)) |
| Cancer type | miRNA id | miRNA accession | P-val. | Coeff. | # samples |
| UCS | hsa-miR-363-3p | MIMAT0000707 | 0.041 | -0.28 | 56 |
| UCS | hsa-miR-92a-3p | MIMAT0000092 | 0.0081 | -0.35 | 56 |
| Top |
| TissGeneMut for TSSK6 |
| TissGeneSNV for TSSK6 |
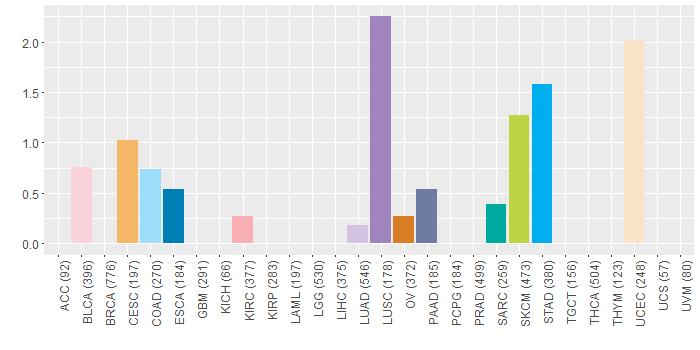
| nsSNV counts per each loci. Different colors of circles represent different cancer types. Circle size denotes number of samples. (TCGA somatic mutation (SNPs and small INDELs) data, version 2016-04-25) * Click on the image to enlarge it in a new window. |
 |
 |
| Somatic nucleotide variants of TissGene across 28 cancer types (X-axis: cancer type and Y-axis: % of mutated samples) The numbers in parentheses are numbers of samples with mutation (nsSNVs). (TCGA somatic mutation (SNPs and small INDELs) data, version 2016-04-25) |
 |
| - nsSNVs sorted by frequency. |
| AAchange | Cancer type | # samples |
| p.G227C | SKCM | 1 |
| p.E20Q | LUSC | 1 |
| p.D114N | HNSC | 1 |
| p.D51N | LUSC | 1 |
| p.E77K | UCEC | 1 |
| p.E20D | BLCA | 1 |
| p.E20K | OV | 1 |
| p.P252L | COAD | 1 |
| p.D96Y | PAAD | 1 |
| p.R59X | STAD | 1 |
| p.R65W | STAD | 1 |
| p.R47Q | CESC | 1 |
| p.R59* | STAD | 1 |
| p.D216H | BLCA | 1 |
| p.P70S | SARC | 1 |
| p.S174A | LUSC | 1 |
| p.D135N | UCEC | 1 |
| p.P50S | SKCM | 1 |
| p.E80K | KIRC | 1 |
| p.G109R | LUSC | 1 |
| p.P50L | SKCM | 1 |
| p.Q111E | CESC | 1 |
| p.R149H | COAD | 1 |
| p.G156D | UCEC | 1 |
| p.V38M | UCEC | 1 |
| p.L236V | LUAD | 1 |
| p.R124H | STAD | 1 |
| p.G199S | STAD | 1 |
| p.S257F | SKCM | 1 |
| p.A48V | STAD | 1 |
| p.P58L | PAAD | 1 |
| p.V53I | STAD | 1 |
| p.P231L | SKCM | 1 |
| p.D146N | SKCM | 1 |
| p.D114N | LUSC | 1 |
| p.R103H | HNSC | 1 |
| p.R106C | UCEC | 1 |
| p.R16H | ESCA | 1 |
| p.F250L | BLCA | 1 |
| p.E235K | SKCM | 1 |
| p.F76L | HNSC | 1 |
| Top |
| TissGeneCNV for TSSK6 |
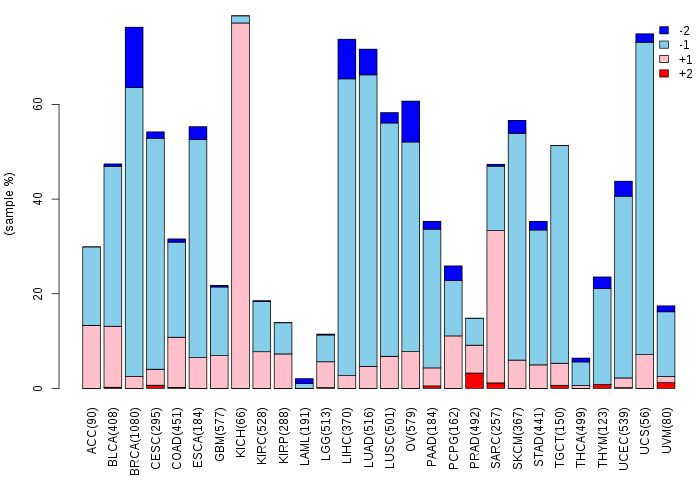
| Copy number variations of TissGene across 28 cancer types (X-axis: cancer type and Y-axis: % of CNV samples) (TCGA Gistic2_CopyNumber_Gistic2_all_data_by_genes, Gistic2 copy number data, version 2016-08-16) |
 |
| Top |
| TissGeneFusions for TSSK6 |
| Fusion genes including TissGene (ChimerDB 3.0, 2016-12-01 and TCGA fusion Portal 2015-12-01) |
| Database | Src | Cancer type | Sample | Fusion gene | ORF | 5'-gene BP | 3'-gene BP |
| Top |
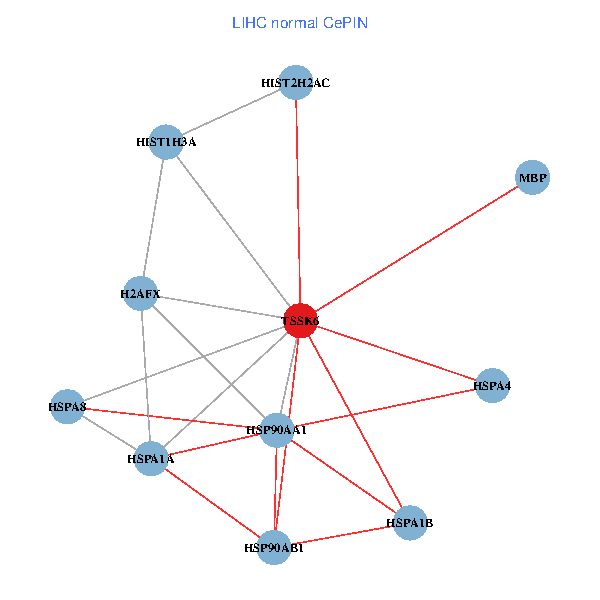
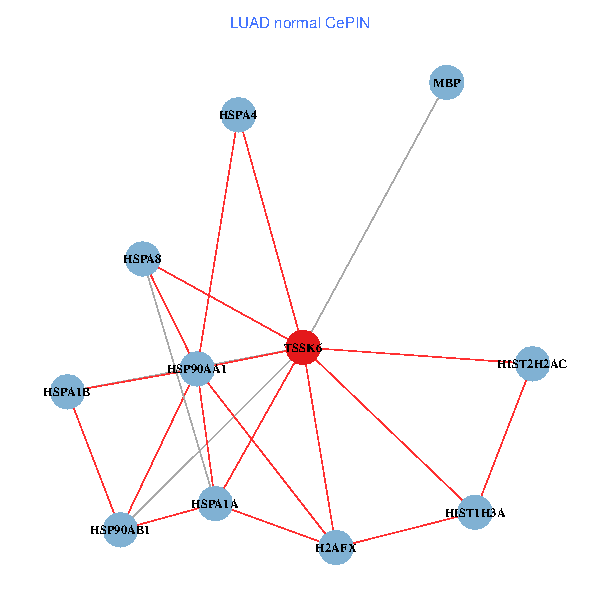
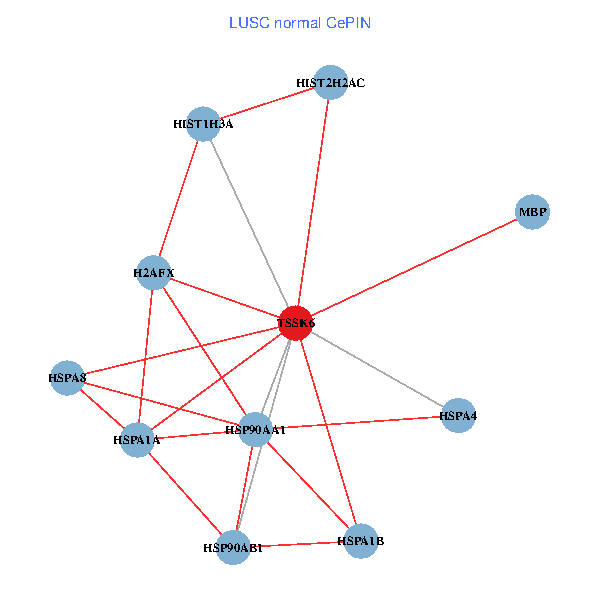
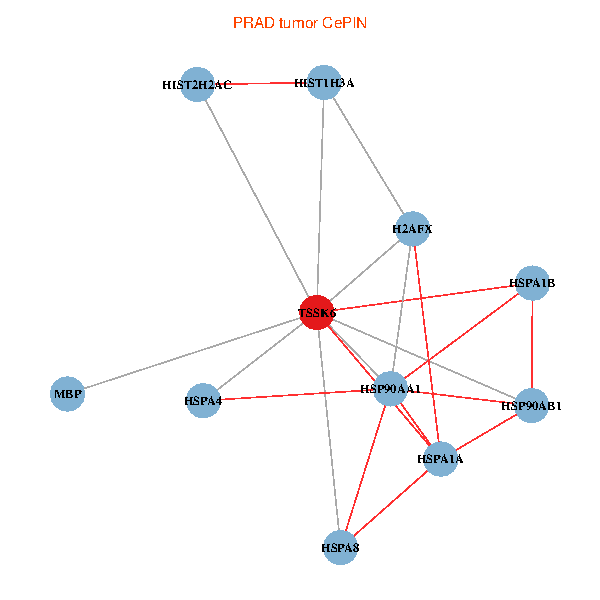
| TissGeneNet for TSSK6 |
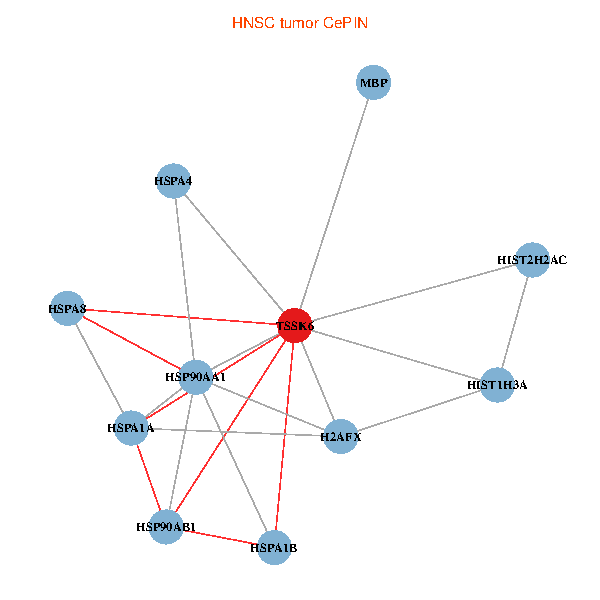
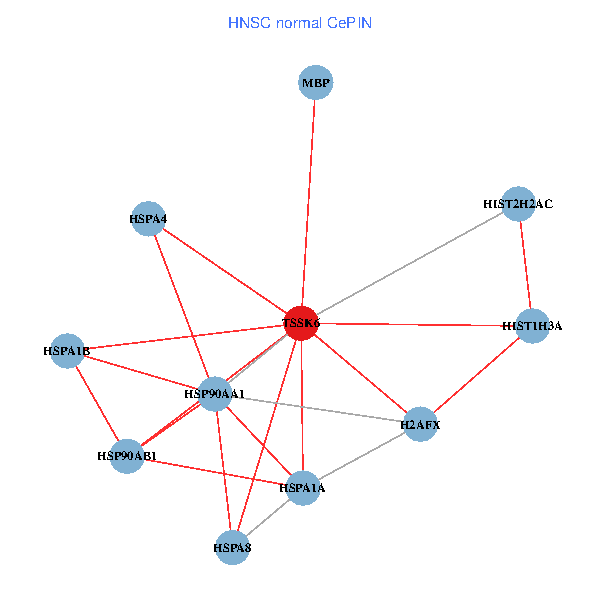
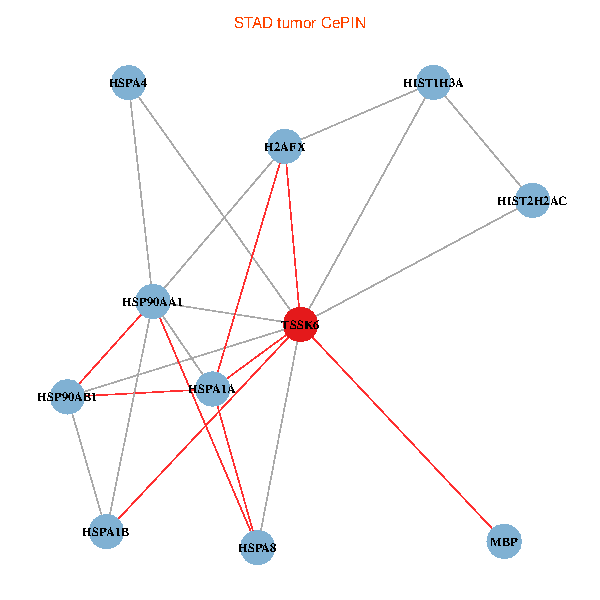
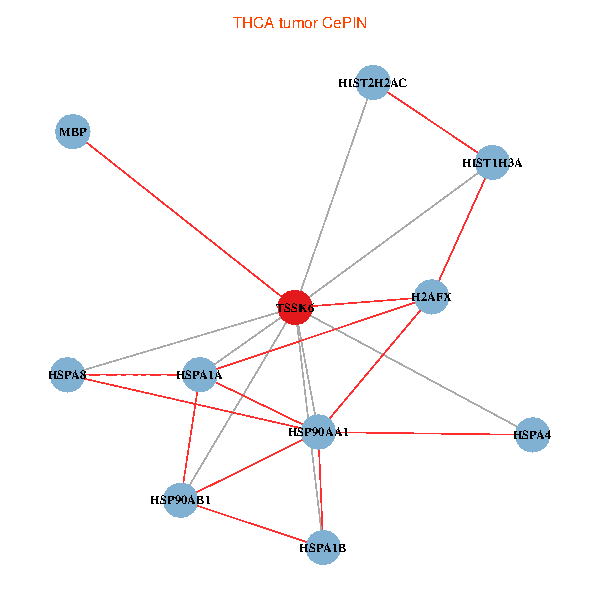
| Co-expressed gene networks based on protein-protein interaction data (CePIN) (TCGA IlluminaHiSeq_RNASeqV2, pan-cancer normalized log2(norm_counts+1) data, version 2016-08-16) (PINA2 ppi data) |
| BRCA (tumor) | BRCA (normal) |
| TSSK6, HSP90AB1, HIST2H2AC, HSPA4, HIST1H3A, HSPA8, MBP, HSPA1B, HSP90AA1, HSPA1A, H2AFX (tumor) | TSSK6, HSP90AB1, HIST2H2AC, HSPA4, HIST1H3A, HSPA8, MBP, HSPA1B, HSP90AA1, HSPA1A, H2AFX (normal) |
 |  |
| COAD (tumor) | COAD (normal) |
| TSSK6, HSP90AB1, HIST2H2AC, HSPA4, HIST1H3A, HSPA8, MBP, HSPA1B, HSP90AA1, HSPA1A, H2AFX (tumor) | TSSK6, HSP90AB1, HIST2H2AC, HSPA4, HIST1H3A, HSPA8, MBP, HSPA1B, HSP90AA1, HSPA1A, H2AFX (normal) |
 |  |
| HNSC (tumor) | HNSC (normal) |
| TSSK6, HSP90AB1, HIST2H2AC, HSPA4, HIST1H3A, HSPA8, MBP, HSPA1B, HSP90AA1, HSPA1A, H2AFX (tumor) | TSSK6, HSP90AB1, HIST2H2AC, HSPA4, HIST1H3A, HSPA8, MBP, HSPA1B, HSP90AA1, HSPA1A, H2AFX (normal) |
 |  |
| KICH (tumor) | KICH (normal) |
| TSSK6, HSP90AB1, HIST2H2AC, HSPA4, HIST1H3A, HSPA8, MBP, HSPA1B, HSP90AA1, HSPA1A, H2AFX (tumor) | TSSK6, HSP90AB1, HIST2H2AC, HSPA4, HIST1H3A, HSPA8, MBP, HSPA1B, HSP90AA1, HSPA1A, H2AFX (normal) |
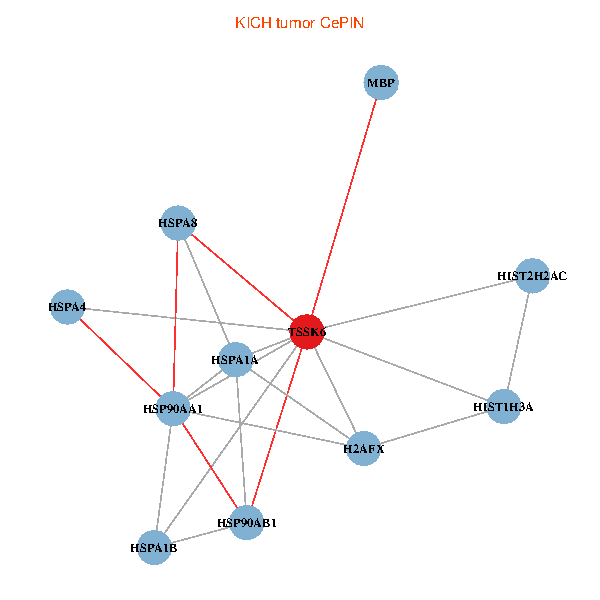 | 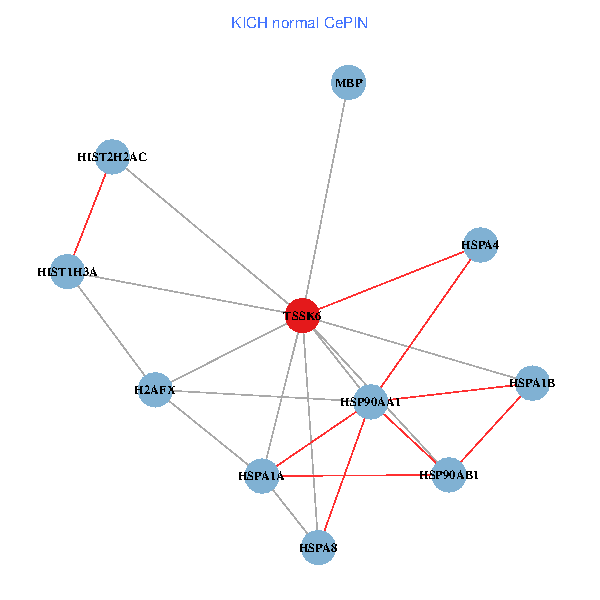 |
| KIRC (tumor) | KIRC (normal) |
| TSSK6, HSP90AB1, HIST2H2AC, HSPA4, HIST1H3A, HSPA8, MBP, HSPA1B, HSP90AA1, HSPA1A, H2AFX (tumor) | TSSK6, HSP90AB1, HIST2H2AC, HSPA4, HIST1H3A, HSPA8, MBP, HSPA1B, HSP90AA1, HSPA1A, H2AFX (normal) |
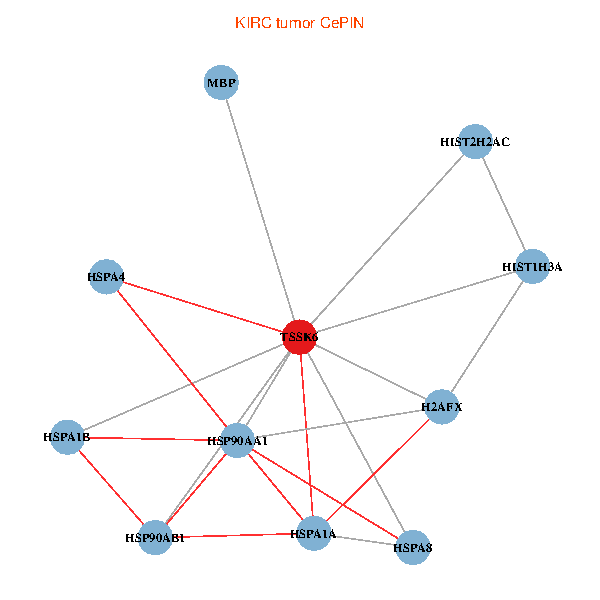 | 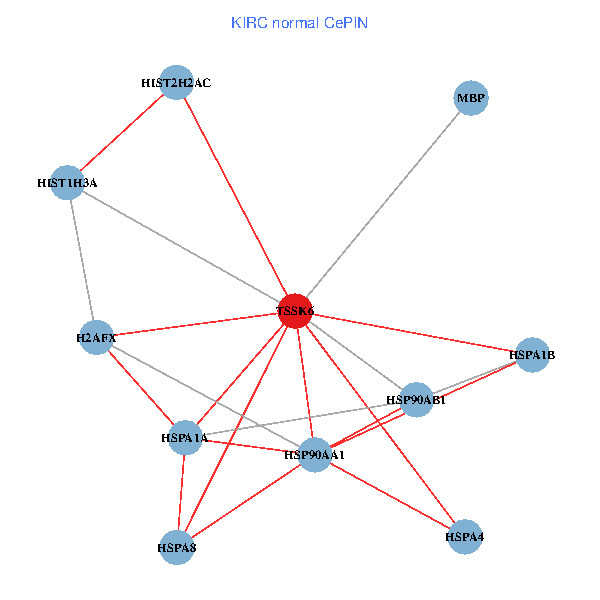 |
| KIRP (tumor) | KIRP (normal) |
| TSSK6, HSP90AB1, HIST2H2AC, HSPA4, HIST1H3A, HSPA8, MBP, HSPA1B, HSP90AA1, HSPA1A, H2AFX (tumor) | TSSK6, HSP90AB1, HIST2H2AC, HSPA4, HIST1H3A, HSPA8, MBP, HSPA1B, HSP90AA1, HSPA1A, H2AFX (normal) |
 |  |
| LIHC (tumor) | LIHC (normal) |
| TSSK6, HSP90AB1, HIST2H2AC, HSPA4, HIST1H3A, HSPA8, MBP, HSPA1B, HSP90AA1, HSPA1A, H2AFX (tumor) | TSSK6, HSP90AB1, HIST2H2AC, HSPA4, HIST1H3A, HSPA8, MBP, HSPA1B, HSP90AA1, HSPA1A, H2AFX (normal) |
 |  |
| LUAD (tumor) | LUAD (normal) |
| TSSK6, HSP90AB1, HIST2H2AC, HSPA4, HIST1H3A, HSPA8, MBP, HSPA1B, HSP90AA1, HSPA1A, H2AFX (tumor) | TSSK6, HSP90AB1, HIST2H2AC, HSPA4, HIST1H3A, HSPA8, MBP, HSPA1B, HSP90AA1, HSPA1A, H2AFX (normal) |
 |  |
| LUSC (tumor) | LUSC (normal) |
| TSSK6, HSP90AB1, HIST2H2AC, HSPA4, HIST1H3A, HSPA8, MBP, HSPA1B, HSP90AA1, HSPA1A, H2AFX (tumor) | TSSK6, HSP90AB1, HIST2H2AC, HSPA4, HIST1H3A, HSPA8, MBP, HSPA1B, HSP90AA1, HSPA1A, H2AFX (normal) |
 |  |
| PRAD (tumor) | PRAD (normal) |
| TSSK6, HSP90AB1, HIST2H2AC, HSPA4, HIST1H3A, HSPA8, MBP, HSPA1B, HSP90AA1, HSPA1A, H2AFX (tumor) | TSSK6, HSP90AB1, HIST2H2AC, HSPA4, HIST1H3A, HSPA8, MBP, HSPA1B, HSP90AA1, HSPA1A, H2AFX (normal) |
 |  |
| STAD (tumor) | STAD (normal) |
| TSSK6, HSP90AB1, HIST2H2AC, HSPA4, HIST1H3A, HSPA8, MBP, HSPA1B, HSP90AA1, HSPA1A, H2AFX (tumor) | TSSK6, HSP90AB1, HIST2H2AC, HSPA4, HIST1H3A, HSPA8, MBP, HSPA1B, HSP90AA1, HSPA1A, H2AFX (normal) |
 |  |
| THCA (tumor) | THCA (normal) |
| TSSK6, HSP90AB1, HIST2H2AC, HSPA4, HIST1H3A, HSPA8, MBP, HSPA1B, HSP90AA1, HSPA1A, H2AFX (tumor) | TSSK6, HSP90AB1, HIST2H2AC, HSPA4, HIST1H3A, HSPA8, MBP, HSPA1B, HSP90AA1, HSPA1A, H2AFX (normal) |
 |  |
| Top |
| TissGeneProg for TSSK6 |
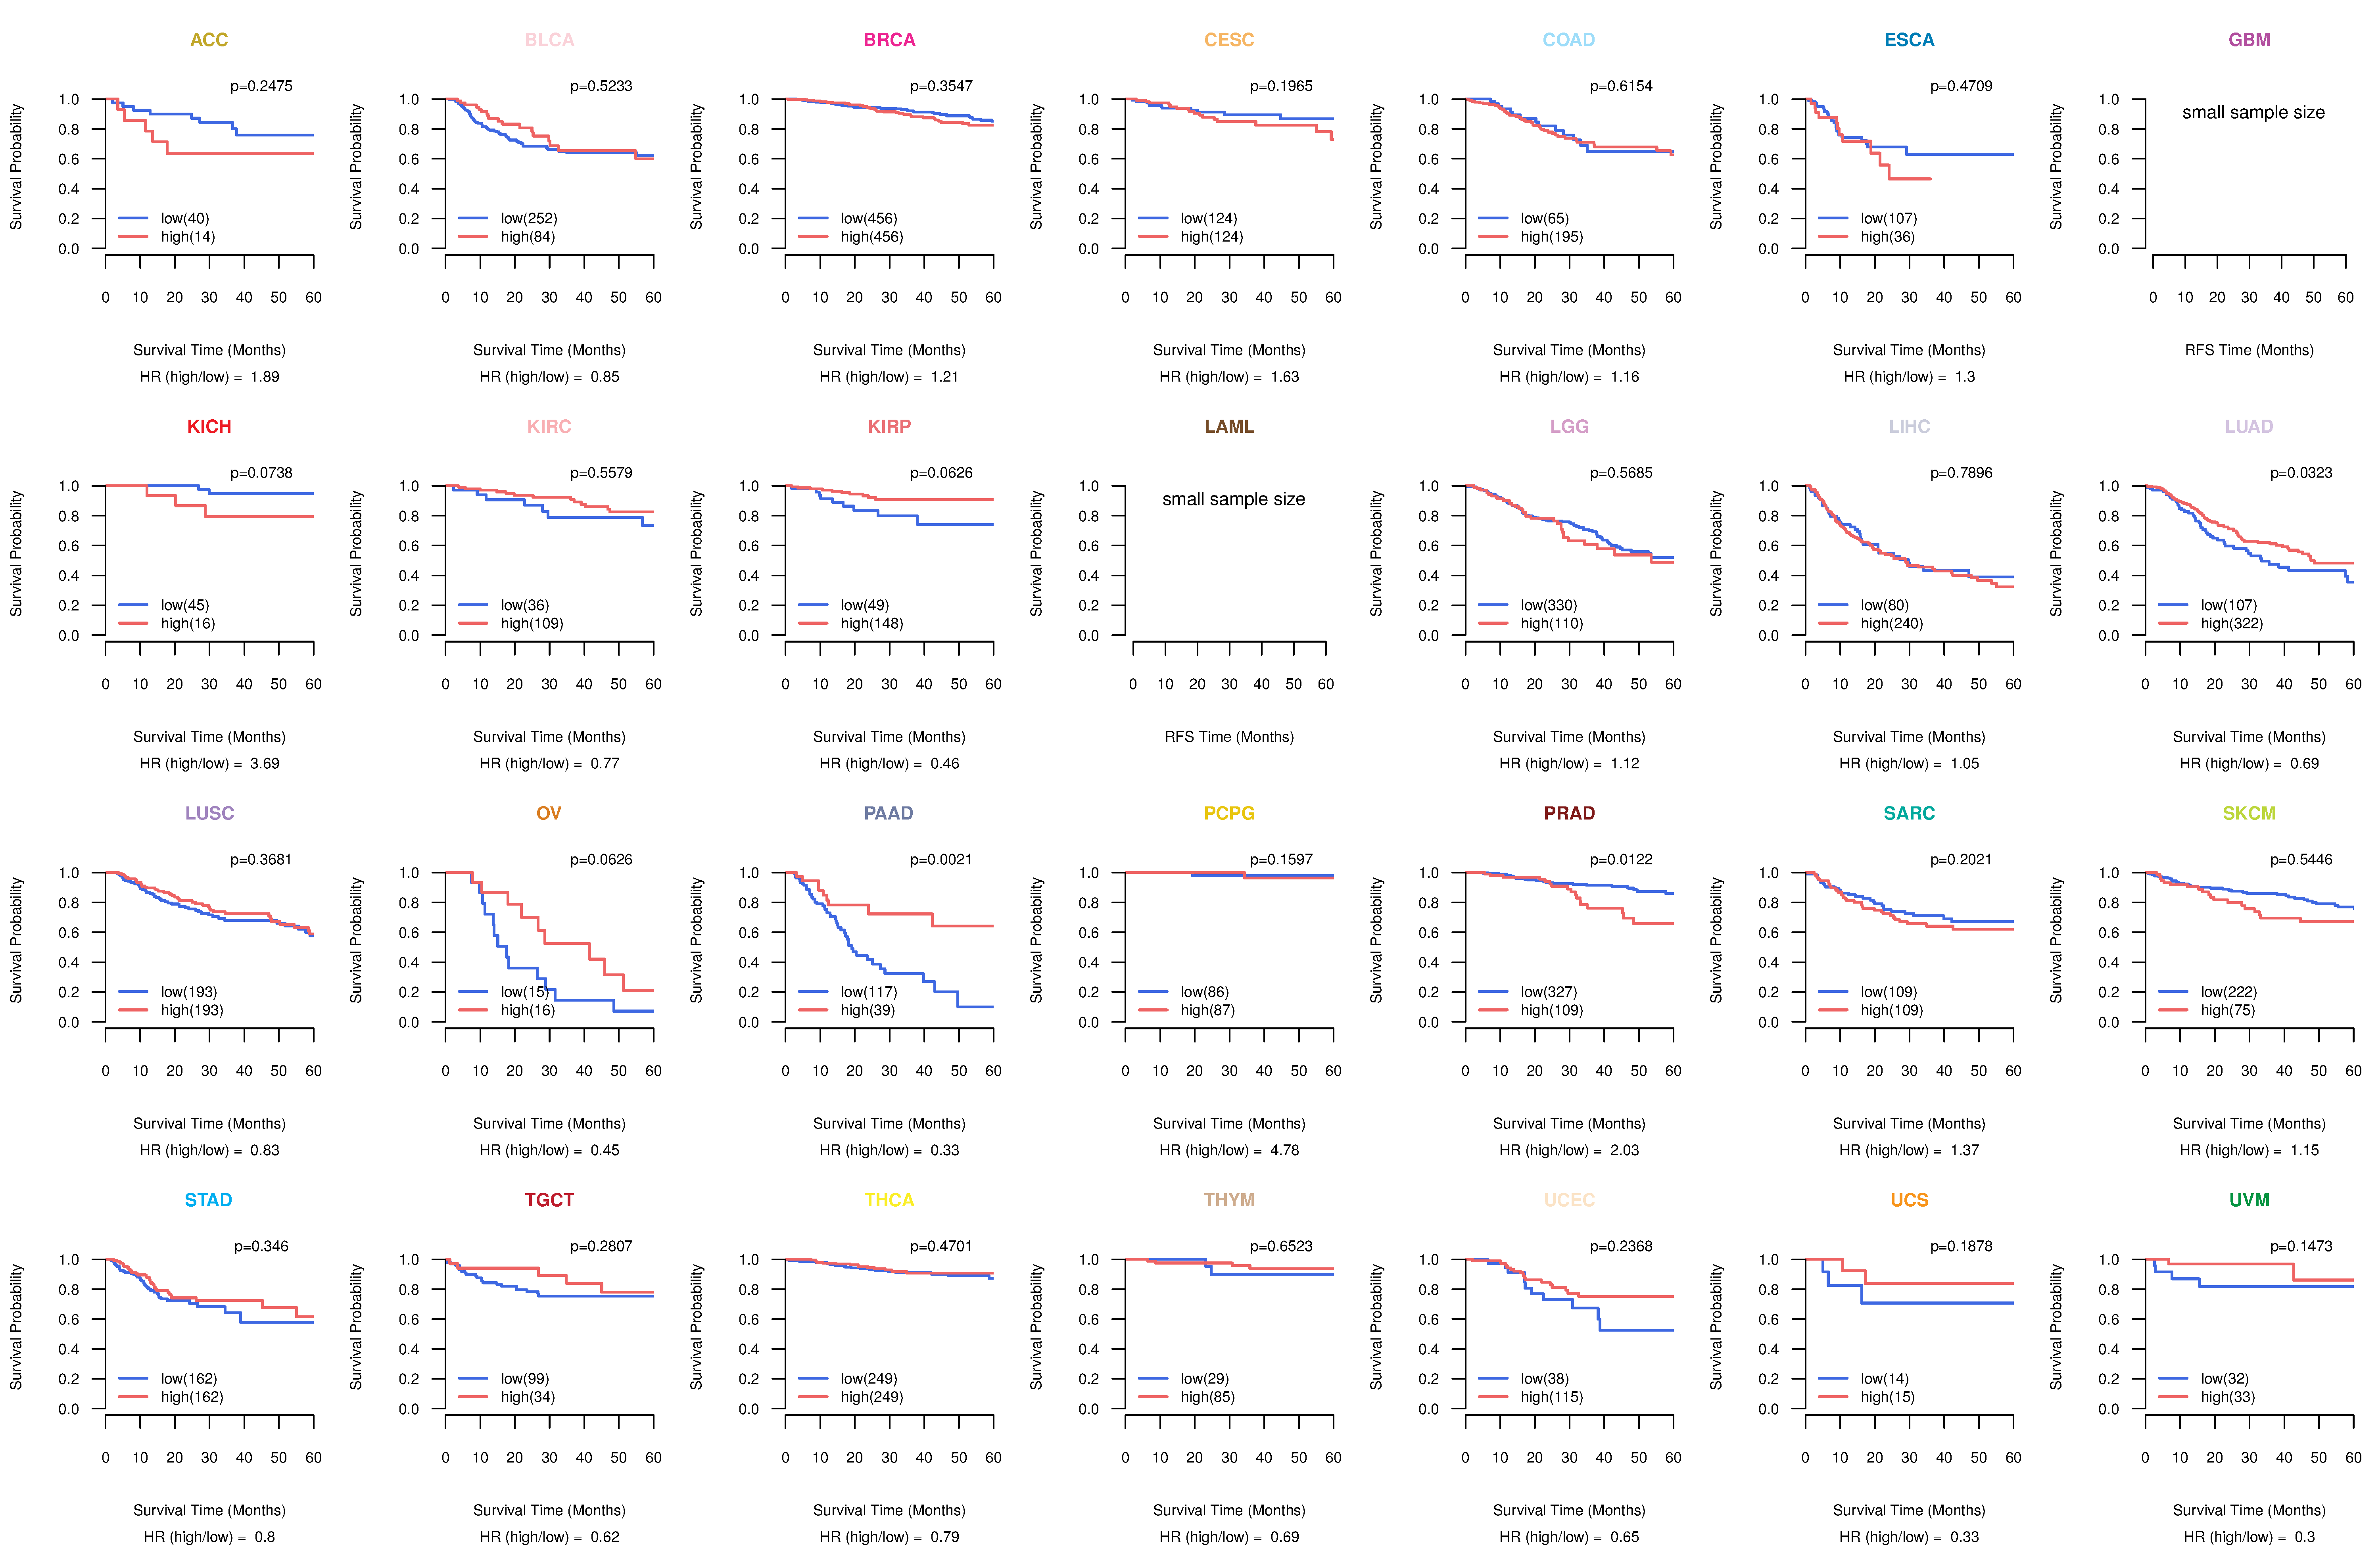
| Kaplan-Meier plots with logrank tests of overall survival (OS) using 28 cancer types (TCGA IlluminaHiSeq_RNASeqV2, pan-cancer normalized log2(norm_counts+1) data, version 2016-08-16) (TCGA clinicalMatrix, phenotype data, version 2016-04-27) * Click on the image to enlarge it in a new window. |
 |
| Kaplan-Meier plots with logrank test of relapse free survival (RFS) using 28 cancer types (TCGA IlluminaHiSeq_RNASeqV2, pan-cancer normalized log2(norm_counts+1) data, version 2016-08-16) (TCGA clinicalMatrix, phenotype data, version 2016-04-27) * Click on the image enlarge it in a new window. |
 |
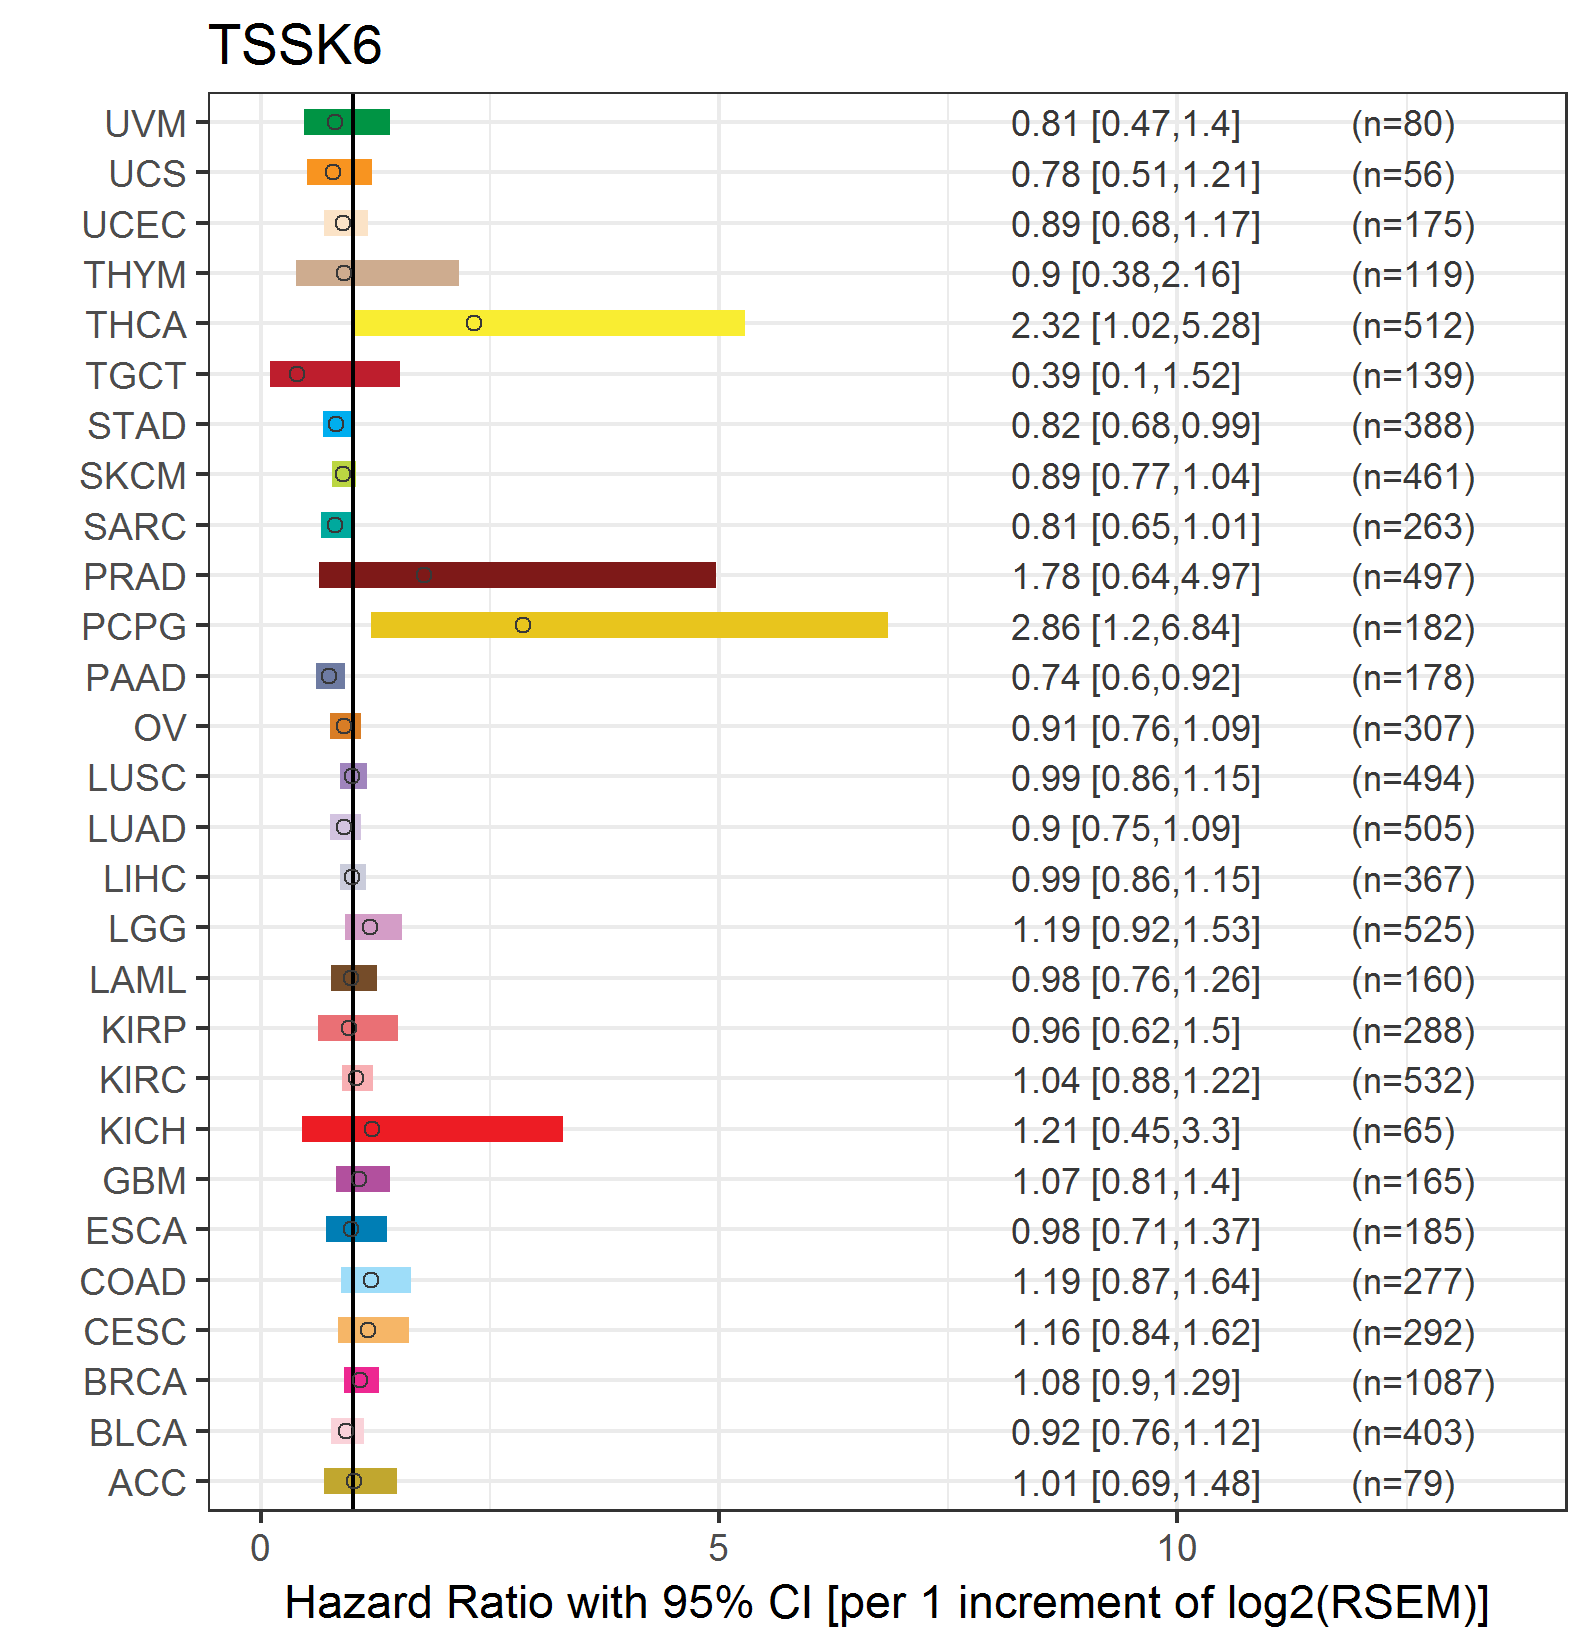
| Forest plot of Cox proportional hazard ratio (HR) and 95% CI of overall survival (OS) using 28 cancer types (TCGA IlluminaHiSeq_RNASeqV2, pan-cancer normalized log2(norm_counts+1) data, version 2016-08-16) (TCGA clinicalMatrix, phenotype data, version 2016-04-27) * Click on the image enlarge it in a new window. |
 |
| Forest plot of Cox proportional hazard ratio (HR) and 95% CI of relapse free survival (RFS) using 28 cancer types (TCGA IlluminaHiSeq_RNASeqV2, pan-cancer normalized log2(norm_counts+1) data, version 2016-08-16) (TCGA clinicalMatrix, phenotype data, version 2016-04-27) * Click on the image enlarge it in a new window. |
 |
| Top |
| TissGeneClin for TSSK6 |
| TissGeneDrug for TSSK6 |
| Drug information targeting TissGene (DrugBank Version 5.0.6, 2017-04-01) |
| DrugBank ID | Drug name | Drug activity | Drug type | Drug status |
| Top |
| TissGeneDisease for TSSK6 |
| Disease information associated with TissGene (DisGeNet, 2016-06-01) |
| Disease ID | Disease name | # pubmeds | Source |
|
Copyright 2016-Present - The University of Texas Health Science Center at Houston (UTHealth) Web File Viewing | How to Report, Fraud, Waste and Abuse | State of Texas | Statewide Search | Texas Homeland Security | Site Policies |