 |
| |
| |
| |
| |
| |
| |
|

| TissGeneSummary for ZMYND15 |
 Gene summary Gene summary |
| Basic gene information | Gene symbol | ZMYND15 |
| Gene name | zinc finger, MYND-type containing 15 | |
| Synonyms | SPGF14 | |
| Cytomap | UCSC genome browser: 17p13.2 | |
| Type of gene | protein-coding | |
| RefGenes | NM_001136046.2, NM_001267822.1,NM_032265.2, | |
| Description | zinc finger MYND domain-containing protein 15 | |
| Modification date | 20141207 | |
| dbXrefs | MIM : 614312 | |
| HGNC : HGNC | ||
| Ensembl : ENSG00000141497 | ||
| HPRD : 15741 | ||
| Vega : OTTHUMG00000090760 | ||
| Protein | UniProt: go to UniProt's Cross Reference DB Table | |
| Expression | CleanEX: HS_ZMYND15 | |
| BioGPS: 84225 | ||
| Pathway | NCI Pathway Interaction Database: ZMYND15 | |
| KEGG: ZMYND15 | ||
| REACTOME: ZMYND15 | ||
| Pathway Commons: ZMYND15 | ||
| Context | iHOP: ZMYND15 | |
| ligand binding site mutation search in PubMed: ZMYND15 | ||
| UCL Cancer Institute: ZMYND15 | ||
| Assigned class in TissGDB* | C | |
| Included tissue-specific gene expression resources | TiGER,GTEx | |
| Specific-tissues in normal samples (assigned by TissGDB using HPA, TiGER, and GTEx) | Testis | |
| Cancer types related to the specific-tissues in cancer samples (assigned by TissGDB using TCGA) | TGCT | |
| Reference showing the relevant tissue of ZMYND15 | ||
| Description by TissGene annotations | ||
| * Class A consists of genes with literature evidence and is part of the cTissGenes. Class B consists of only cTissGenes without additional evidence. The remaining genes belong to Class C. |
| Gene ontology having evidence of Inferred from Direct Assay (IDA) from Entrez |
| GO ID | GO term | PubMed ID |
| Top |
| TissGeneExp for ZMYND15 |
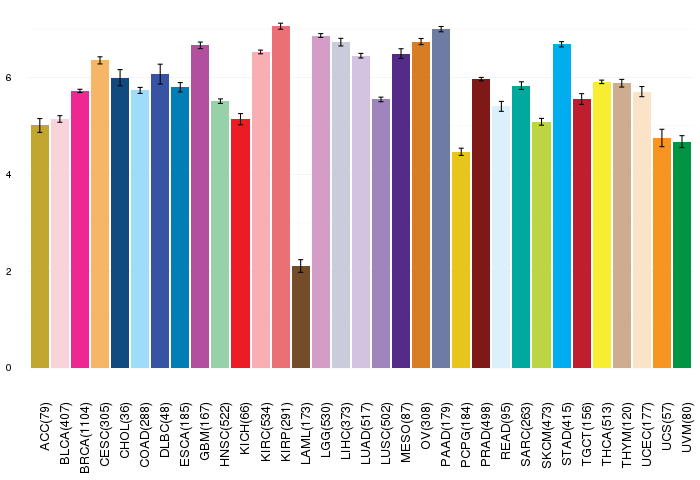
| Gene expressions across 28 cancer types (X-axis: cancer type and Y-axis: log2(norm_counts+1)) (TCGA IlluminaHiSeq_RNASeqV2, pan-cancer normalized log2(norm_counts+1) data, version 2016-08-16) |
 |
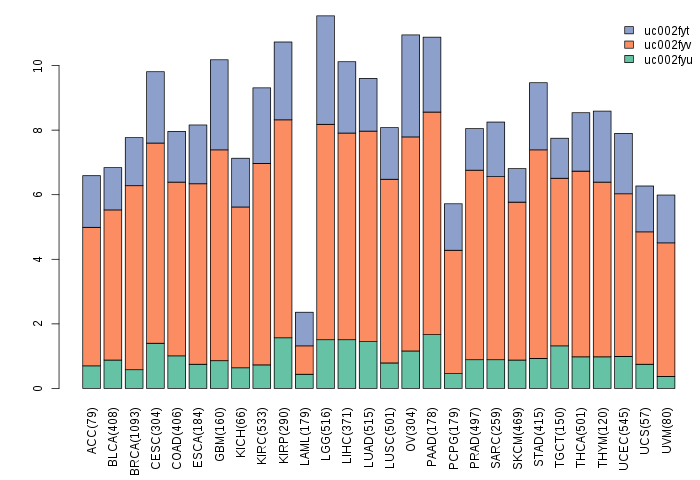
| Gene isoform expressions across 28 cancer types (X-axis: cancer type and Y-axis: log2(norm_counts+1)) (TCGA pan-cancer tcga_rsem_isoform_tpm, version 2016-09-01) |
 |
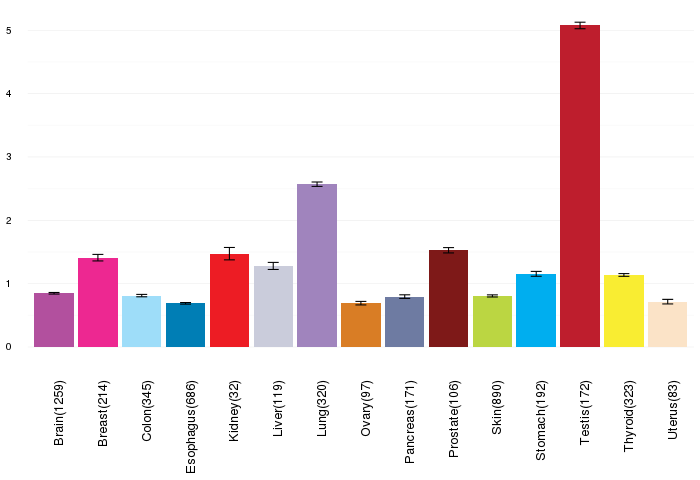
| Gene expressions across normal tissues of GTEx data (GTEx GTEx_Analysis_v6_RNA-seq_RNA-SeQCv1.1.8_gene_rpkm.gct) - Here, we shows the matched tissue types only among our 28 cancer types. |
 |
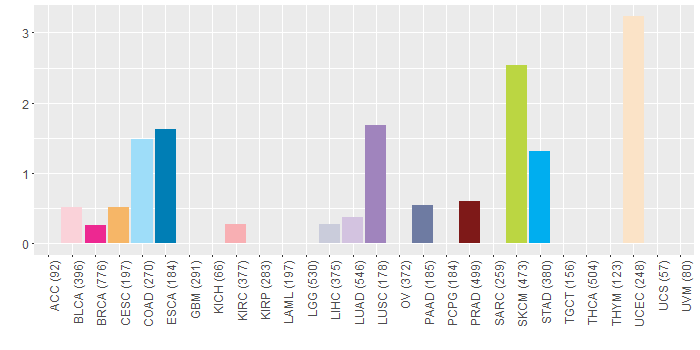
| Different expressions across 14 cancer types with more than 10 samples between matched tumors and normals (X-axis: cancer type and Y-axis: log2(norm_counts+1)) (TCGA IlluminaHiSeq_RNASeqV2, pan-cancer normalized log2(norm_counts+1) data, version 2016-08-16) |
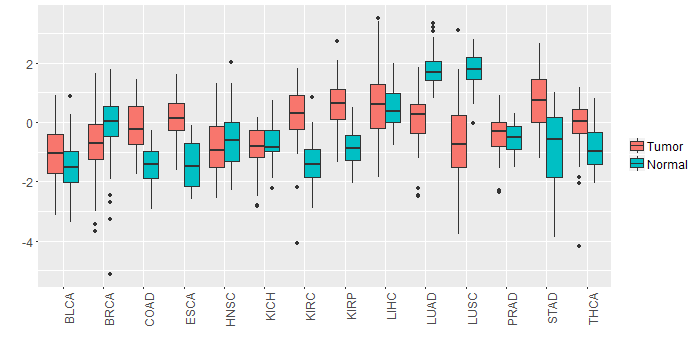 |
| - Significantly differentially expressed cancer types and information. (|Fold change|>1 and FDR<0.05) |
| Cancer type | Mean(exp) in tumor | Mean(exp) in matched normal | Log2FC | P-val. | FDR |
| LUAD | 0.122407957 | 1.754816578 | -1.632408621 | 4.12E-20 | 8.40E-19 |
| KIRC | 0.282884059 | -1.289407608 | 1.572291667 | 7.80E-22 | 6.94E-21 |
| COAD | -0.121919894 | -1.487312202 | 1.365392308 | 9.46E-08 | 6.62E-07 |
| KIRP | 0.605574337 | -0.876288163 | 1.4818625 | 3.85E-09 | 3.22E-08 |
| STAD | 0.708664962 | -0.869769413 | 1.578434375 | 9.06E-07 | 1.50E-05 |
| LUSC | -0.711475173 | 1.800069925 | -2.511545098 | 1.03E-18 | 1.03E-17 |
| ESCA | 0.123626609 | -1.414227936 | 1.537854545 | 7.00E-04 | 0.011329507 |
| Top |
| TissGene-miRNA for ZMYND15 |
| Significantly anti-correlated miRNAs of TissGene across 28 cancer types (Gene-miRNA relations from TargetScanHuman Relsease 7.1, Conserved_Site_Context_Scores.txt.zip, 06.01.2016) (TCGA IlluminaHiSeq_miRNASeq, log2(RPM+1) data, version 2016-11-21) (TCGA IlluminaHiSeq_RNASeqV2, log2(normalized_count+1) data, version 2016-08-16) (Spearman’s Rank Correlation (p-value<0.05 and coefficient<-0.25)) |
| Cancer type | miRNA id | miRNA accession | P-val. | Coeff. | # samples |
| Top |
| TissGeneMut for ZMYND15 |
| TissGeneSNV for ZMYND15 |
| nsSNV counts per each loci. Different colors of circles represent different cancer types. Circle size denotes number of samples. (TCGA somatic mutation (SNPs and small INDELs) data, version 2016-04-25) * Click on the image to enlarge it in a new window. |
 |
 |
| Somatic nucleotide variants of TissGene across 28 cancer types (X-axis: cancer type and Y-axis: % of mutated samples) The numbers in parentheses are numbers of samples with mutation (nsSNVs). (TCGA somatic mutation (SNPs and small INDELs) data, version 2016-04-25) |
 |
| - nsSNVs sorted by frequency. |
| AAchange | Cancer type | # samples |
| p.G625A | STAD | 1 |
| p.G441R | SKCM | 1 |
| p.H275Y | KIRC | 1 |
| p.R41Q | ESCA | 1 |
| p.E554K | CESC | 1 |
| p.E391K | SKCM | 1 |
| p.V636L | BRCA | 1 |
| p.A306T | DLBC | 1 |
| p.G177D | COAD | 1 |
| p.G215D | UCEC | 1 |
| p.E371* | UCEC | 1 |
| p.V611A | PRAD | 1 |
| p.R265Q | UCEC | 1 |
| p.W404C | HNSC | 1 |
| p.W243X | SKCM | 1 |
| p.R348P | LUAD | 1 |
| p.V514M | UCEC | 1 |
| p.S643N | UCEC | 1 |
| p.R145Q | COAD | 1 |
| p.G229E | SKCM | 1 |
| p.R538Q | STAD | 1 |
| p.S320N | BLCA | 1 |
| p.G302C | READ | 1 |
| p.R356Q | SKCM | 1 |
| p.G578A | STAD | 1 |
| p.S235* | BLCA | 1 |
| p.E121K | SKCM | 1 |
| p.R550K | SKCM | 1 |
| p.D442E | SKCM | 1 |
| p.R431C | SKCM | 1 |
| p.R589K | SKCM | 1 |
| p.P102L | LUSC | 1 |
| p.G33W | PAAD | 1 |
| p.E76* | LUSC | 1 |
| p.R39H | PRAD | 1 |
| p.T400A | ESCA | 1 |
| p.P264H | BRCA | 1 |
| p.R41Q | UCEC | 1 |
| p.G613C | COAD | 1 |
| p.E76G | SKCM | 1 |
| p.P261L | SKCM | 1 |
| p.A364V | UCEC | 1 |
| p.Y466S | UCEC | 1 |
| p.E386K | SKCM | 1 |
| p.R309H | STAD | 1 |
| p.S575L | SKCM | 1 |
| p.V224M | LUAD | 1 |
| p.R309C | SKCM | 1 |
| p.Q228H | COAD | 1 |
| p.A323V | PRAD | 1 |
| p.G441E | SKCM | 1 |
| p.P550S | LUSC | 1 |
| p.W404* | STAD | 1 |
| p.R588H | UCEC | 1 |
| p.A708E | LIHC | 1 |
| p.A392S | ESCA | 1 |
| p.R577Q | STAD | 1 |
| p.W243* | SKCM | 1 |
| p.P414L | STAD | 1 |
| p.P51L | SKCM | 1 |
| p.A716E | LIHC | 1 |
| Top |
| TissGeneCNV for ZMYND15 |
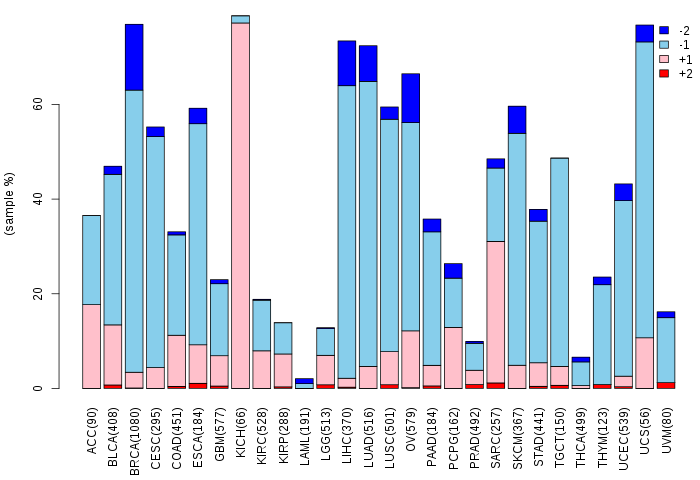
| Copy number variations of TissGene across 28 cancer types (X-axis: cancer type and Y-axis: % of CNV samples) (TCGA Gistic2_CopyNumber_Gistic2_all_data_by_genes, Gistic2 copy number data, version 2016-08-16) |
 |
| Top |
| TissGeneFusions for ZMYND15 |
| Fusion genes including TissGene (ChimerDB 3.0, 2016-12-01 and TCGA fusion Portal 2015-12-01) |
| Database | Src | Cancer type | Sample | Fusion gene | ORF | 5'-gene BP | 3'-gene BP |
| Chimerdb3.0 | ChiTaRs | NA | AL041801 | ZMYND15-ZMYND15 | chr17:4649408 | chr17:4643560 |
| Top |
| TissGeneNet for ZMYND15 |
| Co-expressed gene networks based on protein-protein interaction data (CePIN) (TCGA IlluminaHiSeq_RNASeqV2, pan-cancer normalized log2(norm_counts+1) data, version 2016-08-16) (PINA2 ppi data) |
| Top |
| TissGeneProg for ZMYND15 |
| Kaplan-Meier plots with logrank tests of overall survival (OS) using 28 cancer types (TCGA IlluminaHiSeq_RNASeqV2, pan-cancer normalized log2(norm_counts+1) data, version 2016-08-16) (TCGA clinicalMatrix, phenotype data, version 2016-04-27) * Click on the image to enlarge it in a new window. |
 |
| Kaplan-Meier plots with logrank test of relapse free survival (RFS) using 28 cancer types (TCGA IlluminaHiSeq_RNASeqV2, pan-cancer normalized log2(norm_counts+1) data, version 2016-08-16) (TCGA clinicalMatrix, phenotype data, version 2016-04-27) * Click on the image enlarge it in a new window. |
 |
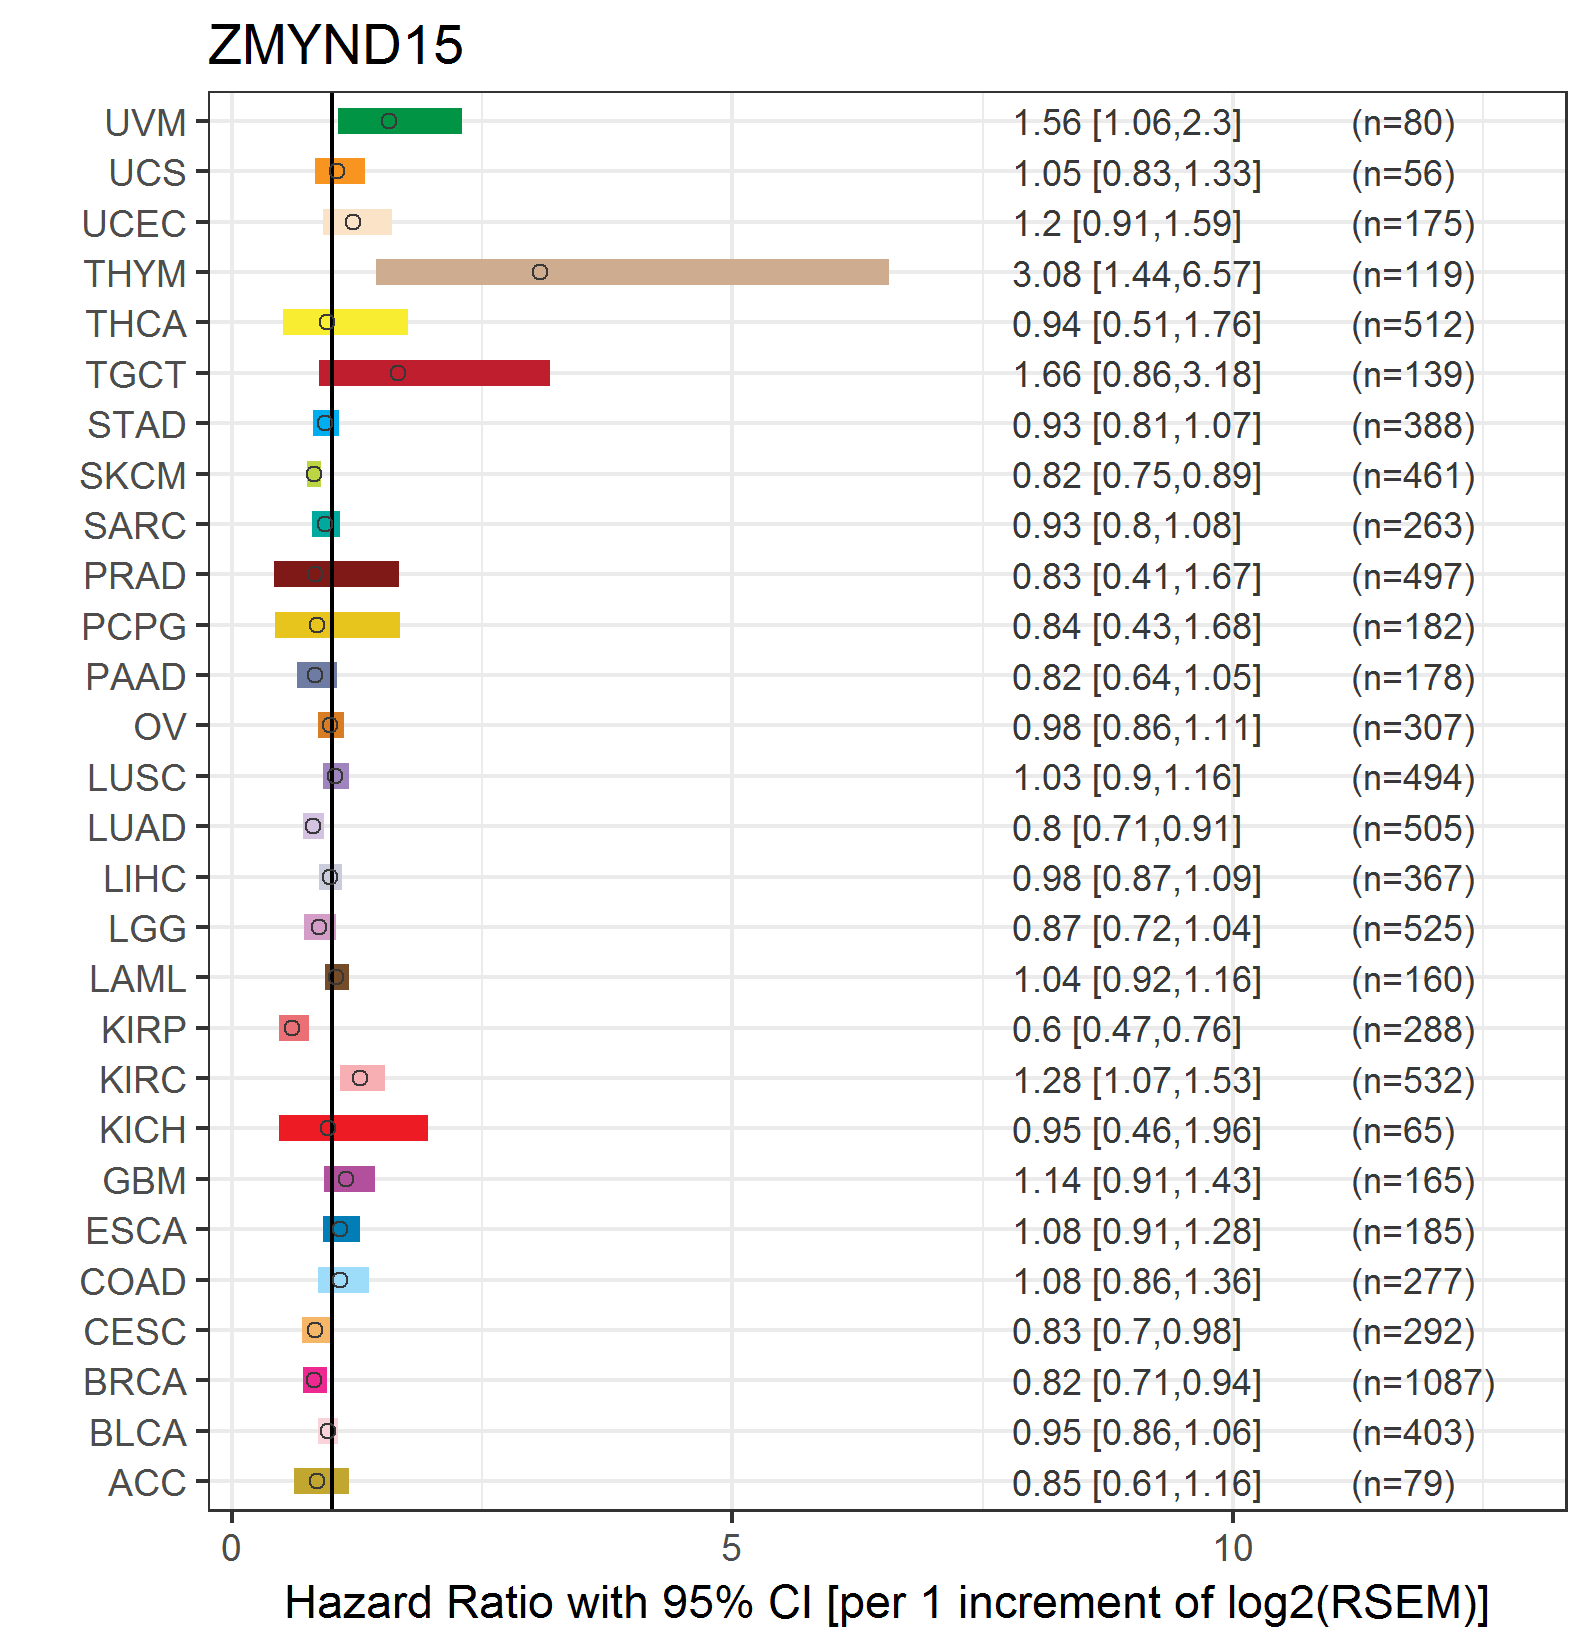
| Forest plot of Cox proportional hazard ratio (HR) and 95% CI of overall survival (OS) using 28 cancer types (TCGA IlluminaHiSeq_RNASeqV2, pan-cancer normalized log2(norm_counts+1) data, version 2016-08-16) (TCGA clinicalMatrix, phenotype data, version 2016-04-27) * Click on the image enlarge it in a new window. |
 |
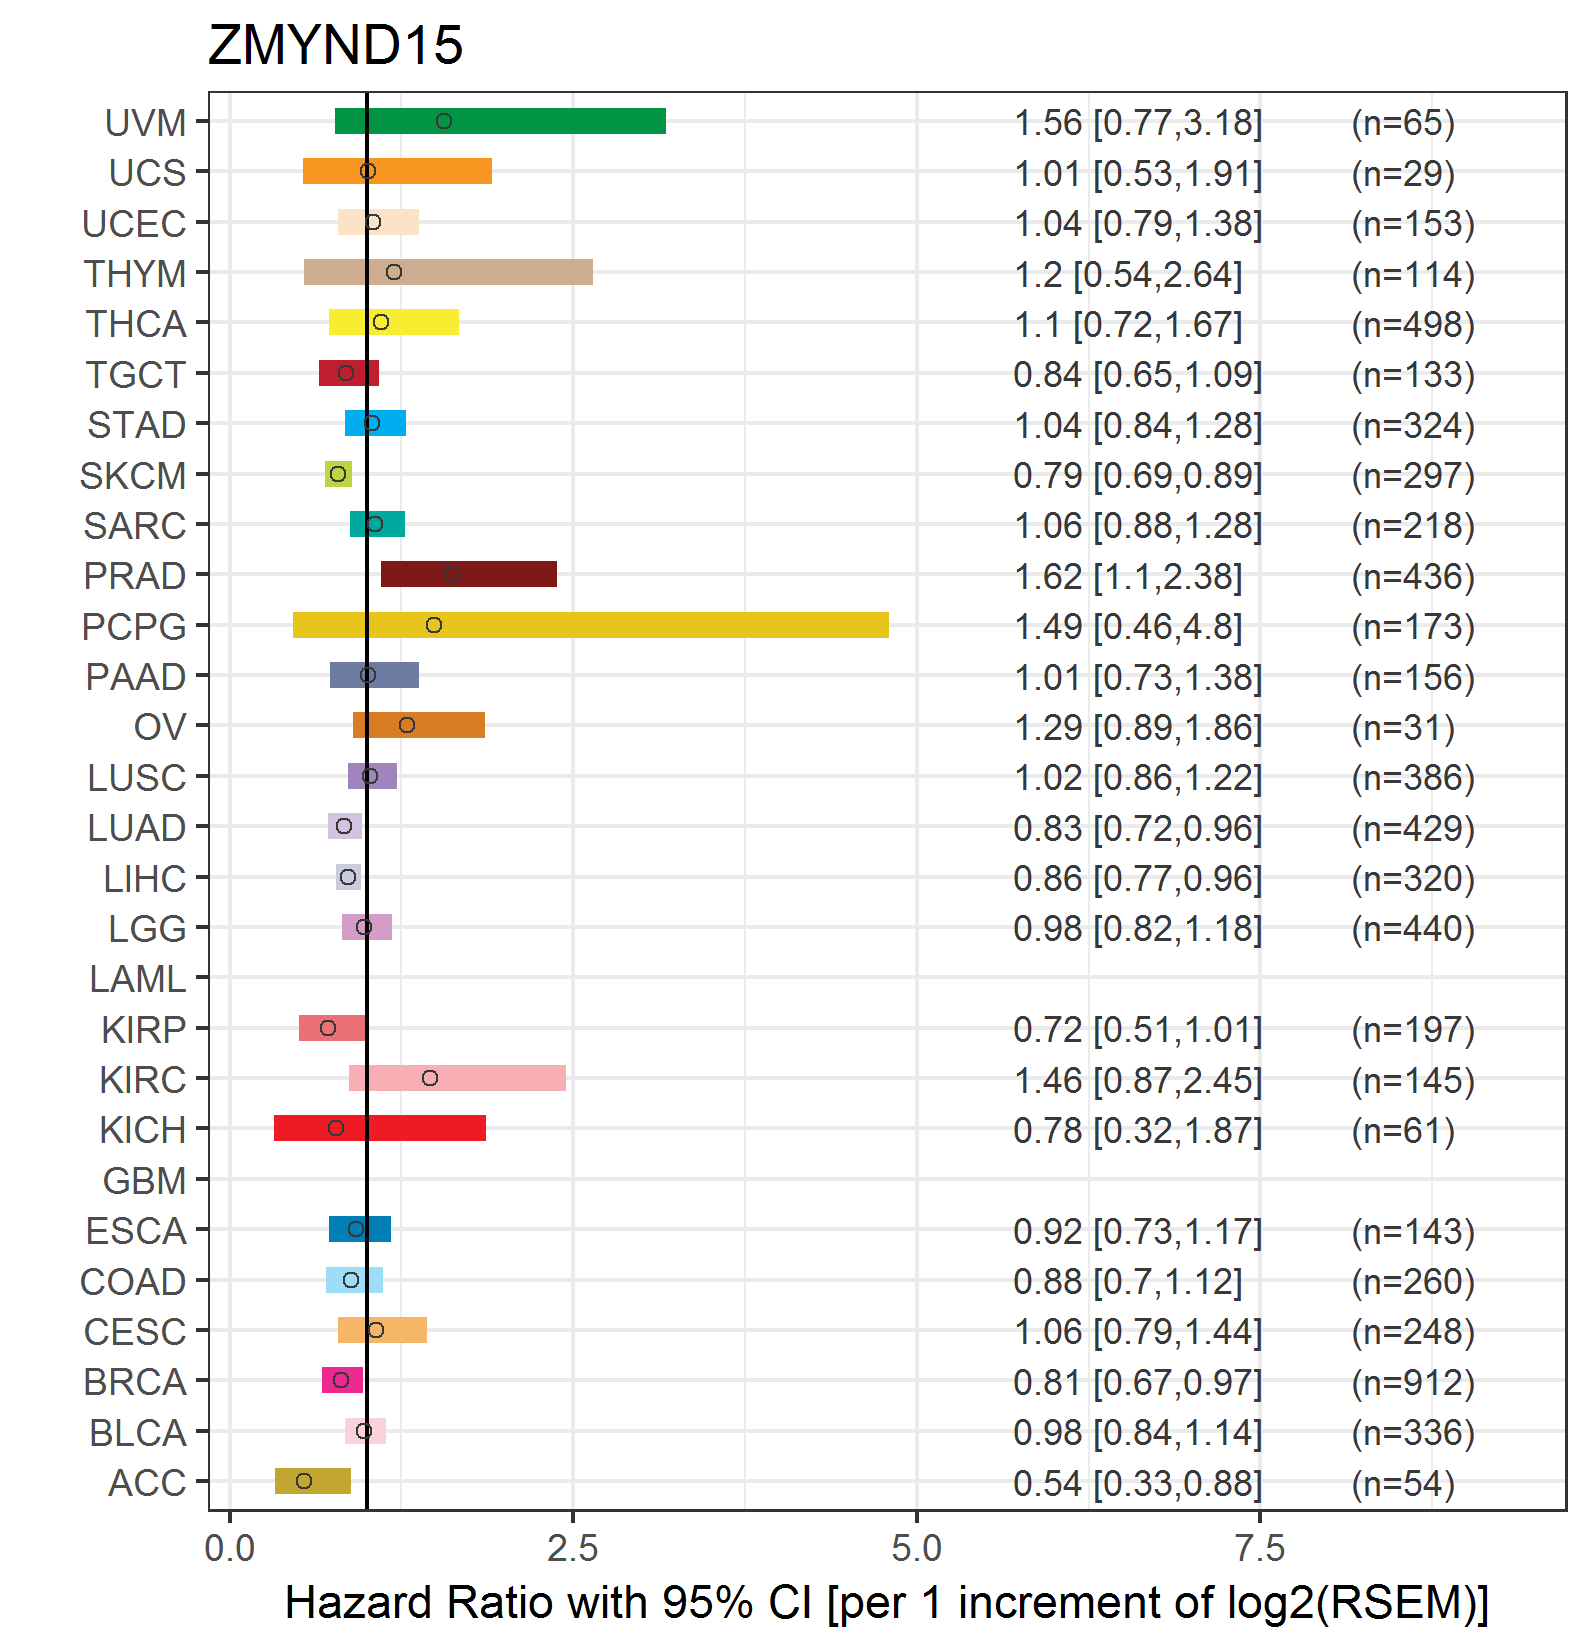
| Forest plot of Cox proportional hazard ratio (HR) and 95% CI of relapse free survival (RFS) using 28 cancer types (TCGA IlluminaHiSeq_RNASeqV2, pan-cancer normalized log2(norm_counts+1) data, version 2016-08-16) (TCGA clinicalMatrix, phenotype data, version 2016-04-27) * Click on the image enlarge it in a new window. |
 |
| Top |
| TissGeneClin for ZMYND15 |
| TissGeneDrug for ZMYND15 |
| Drug information targeting TissGene (DrugBank Version 5.0.6, 2017-04-01) |
| DrugBank ID | Drug name | Drug activity | Drug type | Drug status |
| Top |
| TissGeneDisease for ZMYND15 |
| Disease information associated with TissGene (DisGeNet, 2016-06-01) |
| Disease ID | Disease name | # pubmeds | Source |
|
Copyright 2016-Present - The University of Texas Health Science Center at Houston (UTHealth) Web File Viewing | How to Report, Fraud, Waste and Abuse | State of Texas | Statewide Search | Texas Homeland Security | Site Policies |