 |
| |
| |
| |
| |
| |
| |
|

| TissGeneSummary for C9orf24 |
 Gene summary Gene summary |
| Basic gene information | Gene symbol | C9orf24 |
| Gene name | chromosome 9 open reading frame 24 | |
| Synonyms | CBE1|NYD-SP22|SMRP1|bA573M23.4 | |
| Cytomap | UCSC genome browser: 9p13.3 | |
| Type of gene | protein-coding | |
| RefGenes | NM_001252195.1, NM_032596.3,NM_147168.1,NM_147169.2, | |
| Description | ciliated bronchial epithelial protein 1ciliated bronchial epithelium 1spermatid-specific manchette-related protein 1testis development protein NYD-SP22 | |
| Modification date | 20141207 | |
| dbXrefs | HGNC : HGNC | |
| Ensembl : ENSG00000164972 | ||
| HPRD : 12949 | ||
| Vega : OTTHUMG00000000437 | ||
| Protein | UniProt: go to UniProt's Cross Reference DB Table | |
| Expression | CleanEX: HS_C9orf24 | |
| BioGPS: 84688 | ||
| Pathway | NCI Pathway Interaction Database: C9orf24 | |
| KEGG: C9orf24 | ||
| REACTOME: C9orf24 | ||
| Pathway Commons: C9orf24 | ||
| Context | iHOP: C9orf24 | |
| ligand binding site mutation search in PubMed: C9orf24 | ||
| UCL Cancer Institute: C9orf24 | ||
| Assigned class in TissGDB* | C | |
| Included tissue-specific gene expression resources | TiGER,GTEx | |
| Specific-tissues in normal samples (assigned by TissGDB using HPA, TiGER, and GTEx) | Testis | |
| Cancer types related to the specific-tissues in cancer samples (assigned by TissGDB using TCGA) | TGCT | |
| Reference showing the relevant tissue of C9orf24 | ||
| Description by TissGene annotations | Have significant anti-correlated miRNA | |
| * Class A consists of genes with literature evidence and is part of the cTissGenes. Class B consists of only cTissGenes without additional evidence. The remaining genes belong to Class C. |
| Gene ontology having evidence of Inferred from Direct Assay (IDA) from Entrez |
| GO ID | GO term | PubMed ID |
| Top |
| TissGeneExp for C9orf24 |
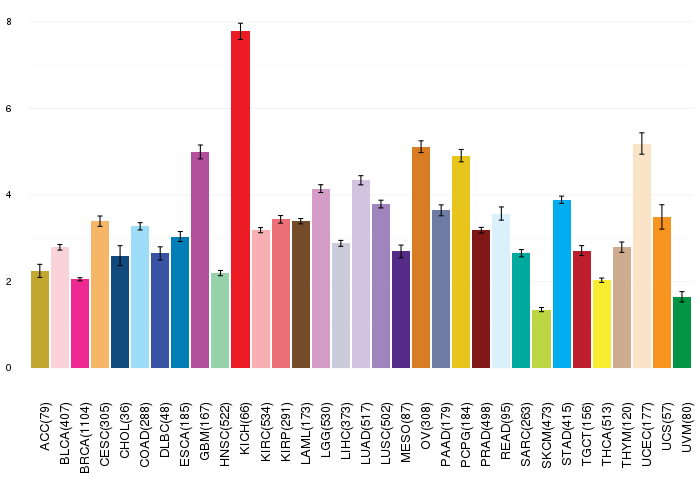
| Gene expressions across 28 cancer types (X-axis: cancer type and Y-axis: log2(norm_counts+1)) (TCGA IlluminaHiSeq_RNASeqV2, pan-cancer normalized log2(norm_counts+1) data, version 2016-08-16) |
 |
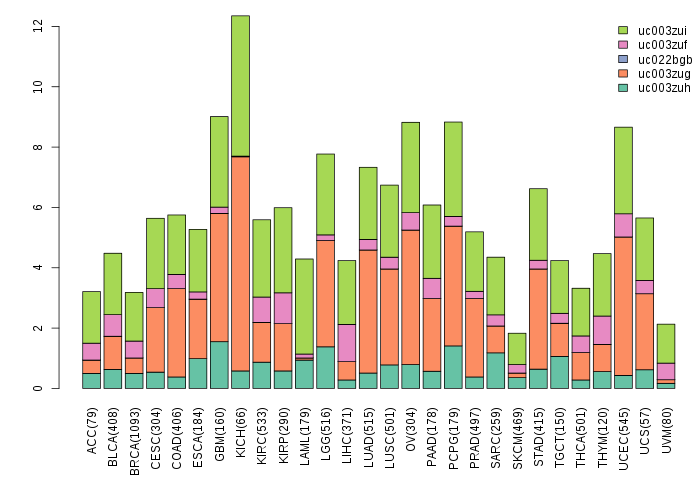
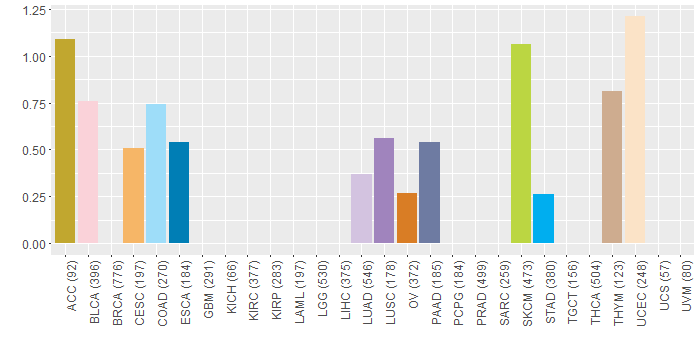
| Gene isoform expressions across 28 cancer types (X-axis: cancer type and Y-axis: log2(norm_counts+1)) (TCGA pan-cancer tcga_rsem_isoform_tpm, version 2016-09-01) |
 |
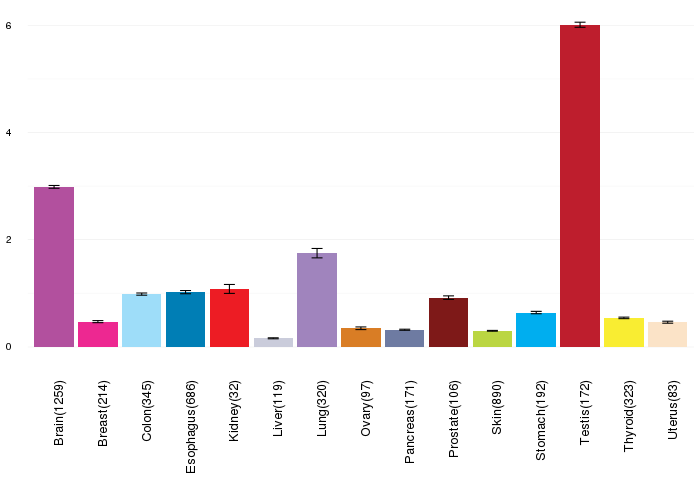
| Gene expressions across normal tissues of GTEx data (GTEx GTEx_Analysis_v6_RNA-seq_RNA-SeQCv1.1.8_gene_rpkm.gct) - Here, we shows the matched tissue types only among our 28 cancer types. |
 |
| Different expressions across 14 cancer types with more than 10 samples between matched tumors and normals (X-axis: cancer type and Y-axis: log2(norm_counts+1)) (TCGA IlluminaHiSeq_RNASeqV2, pan-cancer normalized log2(norm_counts+1) data, version 2016-08-16) |
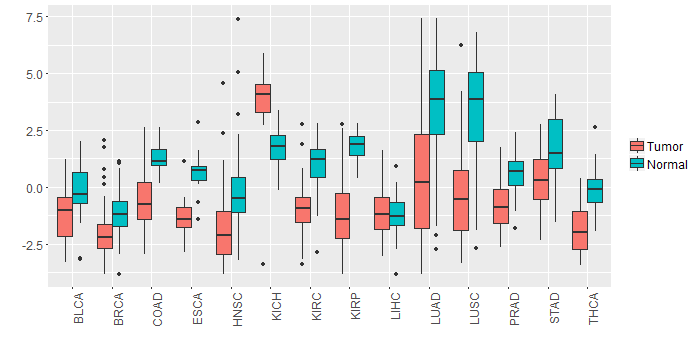 |
| - Significantly differentially expressed cancer types and information. (|Fold change|>1 and FDR<0.05) |
| Cancer type | Mean(exp) in tumor | Mean(exp) in matched normal | Log2FC | P-val. | FDR |
| PRAD | -0.799683043 | 0.636549649 | -1.436232692 | 1.74E-11 | 5.13E-10 |
| THCA | -1.865439334 | -0.093432555 | -1.77200678 | 2.14E-17 | 4.35E-16 |
| KICH | 3.841387649 | 1.811675649 | 2.029712 | 8.48E-06 | 2.72E-05 |
| KIRP | -1.113559726 | 1.790368399 | -2.903928125 | 1.27E-12 | 2.01E-11 |
| LUSC | -0.384767018 | 3.137405531 | -3.522172549 | 3.88E-12 | 1.70E-11 |
| KIRC | -0.958537851 | 1.023955204 | -1.982493056 | 1.64E-22 | 1.57E-21 |
| COAD | -0.450569582 | 1.235941957 | -1.686511538 | 2.78E-06 | 1.42E-05 |
| LUAD | 0.40438758 | 3.545606545 | -3.141218966 | 2.57E-09 | 1.27E-08 |
| ESCA | -1.255563988 | 0.62980874 | -1.885372727 | 0.000556 | 0.009892352 |
| STAD | 0.442734024 | 1.590046524 | -1.1473125 | 0.00185 | 0.008596384 |
| HNSC | -1.724811979 | -0.141146863 | -1.583665116 | 0.000157 | 0.000661517 |
| Top |
| TissGene-miRNA for C9orf24 |
| Significantly anti-correlated miRNAs of TissGene across 28 cancer types (Gene-miRNA relations from TargetScanHuman Relsease 7.1, Conserved_Site_Context_Scores.txt.zip, 06.01.2016) (TCGA IlluminaHiSeq_miRNASeq, log2(RPM+1) data, version 2016-11-21) (TCGA IlluminaHiSeq_RNASeqV2, log2(normalized_count+1) data, version 2016-08-16) (Spearman’s Rank Correlation (p-value<0.05 and coefficient<-0.25)) |
| Cancer type | miRNA id | miRNA accession | P-val. | Coeff. | # samples |
| ACC | hsa-miR-330-5p | MIMAT0004693 | 0.00053 | -0.39 | 78 |
| ACC | hsa-miR-330-5p | MIMAT0004693 | 0.00053 | -0.39 | 78 |
| Top |
| TissGeneMut for C9orf24 |
| TissGeneSNV for C9orf24 |
| nsSNV counts per each loci. Different colors of circles represent different cancer types. Circle size denotes number of samples. (TCGA somatic mutation (SNPs and small INDELs) data, version 2016-04-25) * Click on the image to enlarge it in a new window. |
 |
 |
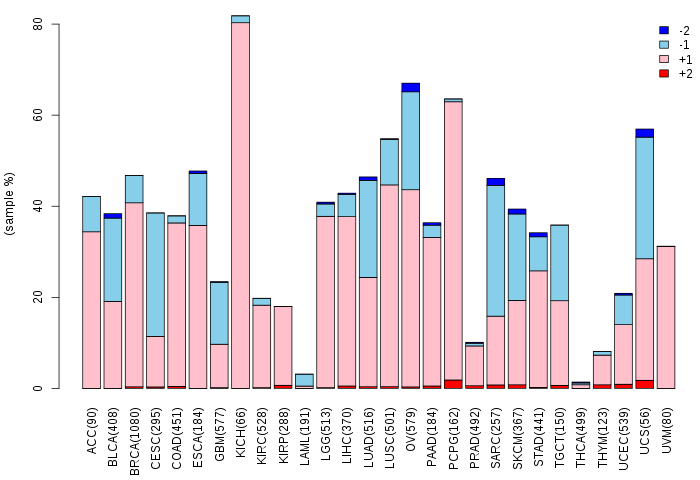
| Somatic nucleotide variants of TissGene across 28 cancer types (X-axis: cancer type and Y-axis: % of mutated samples) The numbers in parentheses are numbers of samples with mutation (nsSNVs). (TCGA somatic mutation (SNPs and small INDELs) data, version 2016-04-25) |
 |
| - nsSNVs sorted by frequency. |
| AAchange | Cancer type | # samples |
| p.R177Q | ACC | 1 |
| p.E92K | HNSC | 1 |
| p.Y107* | LUSC | 1 |
| p.F2L | UCEC | 1 |
| p.R129W | BLCA | 1 |
| p.C236* | SKCM | 1 |
| p.T124A | UCEC | 1 |
| p.C248R | SKCM | 1 |
| p.R181Q | BLCA | 1 |
| p.R129W | OV | 1 |
| p.C61Y | COAD | 1 |
| p.P242Q | THYM | 1 |
| p.Y124F | DLBC | 1 |
| p.G111E | SKCM | 1 |
| p.E38Q | BLCA | 1 |
| p.G217R | MESO | 1 |
| p.H195Y | SKCM | 1 |
| p.D107N | UCEC | 1 |
| p.P242R | LUAD | 1 |
| p.R20M | COAD | 1 |
| p.R150K | SKCM | 1 |
| p.C236X | SKCM | 1 |
| p.P151H | PAAD | 1 |
| p.A134S | LUAD | 1 |
| p.V148A | STAD | 1 |
| p.R244Q | SKCM | 1 |
| p.E152Q | ESCA | 1 |
| p.R141P | CESC | 1 |
| Top |
| TissGeneCNV for C9orf24 |
| Copy number variations of TissGene across 28 cancer types (X-axis: cancer type and Y-axis: % of CNV samples) (TCGA Gistic2_CopyNumber_Gistic2_all_data_by_genes, Gistic2 copy number data, version 2016-08-16) |
 |
| Top |
| TissGeneFusions for C9orf24 |
| Fusion genes including TissGene (ChimerDB 3.0, 2016-12-01 and TCGA fusion Portal 2015-12-01) |
| Database | Src | Cancer type | Sample | Fusion gene | ORF | 5'-gene BP | 3'-gene BP |
| TCGAfusionPortal | PRADA | GBM | TCGA-12-3652-01A | NFX1-C9orf24 | In-frame | Chr9:33295425 | Chr9:34382867 |
| Top |
| TissGeneNet for C9orf24 |
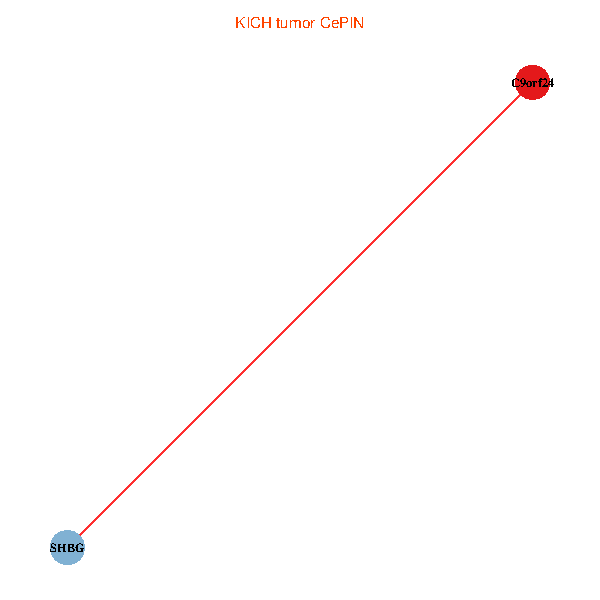
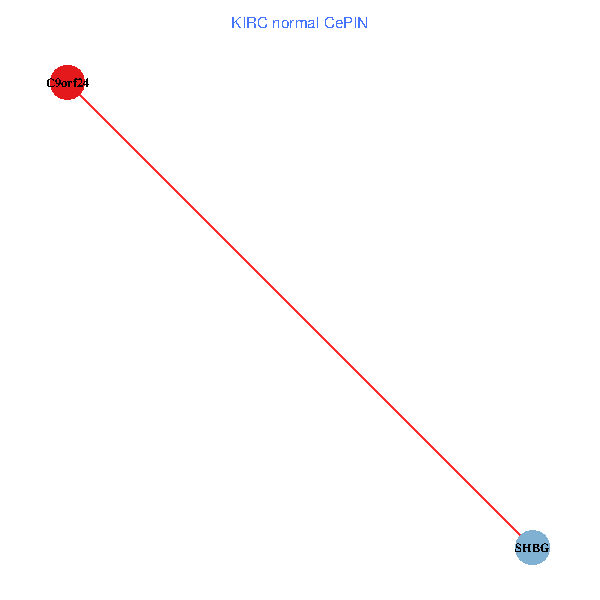
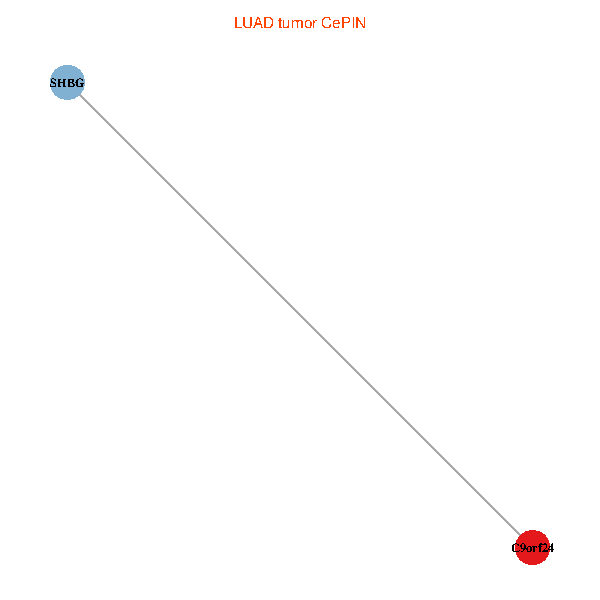
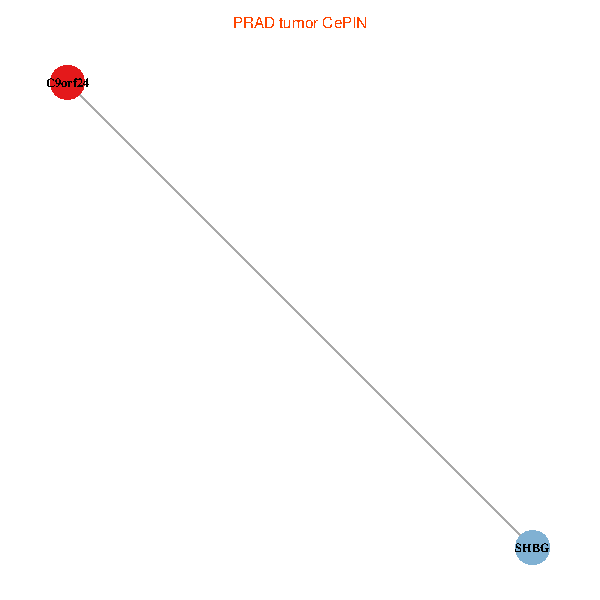
| Co-expressed gene networks based on protein-protein interaction data (CePIN) (TCGA IlluminaHiSeq_RNASeqV2, pan-cancer normalized log2(norm_counts+1) data, version 2016-08-16) (PINA2 ppi data) |
| BRCA (tumor) | BRCA (normal) |
| C9orf24, SHBG (tumor) | C9orf24, SHBG (normal) |
 | 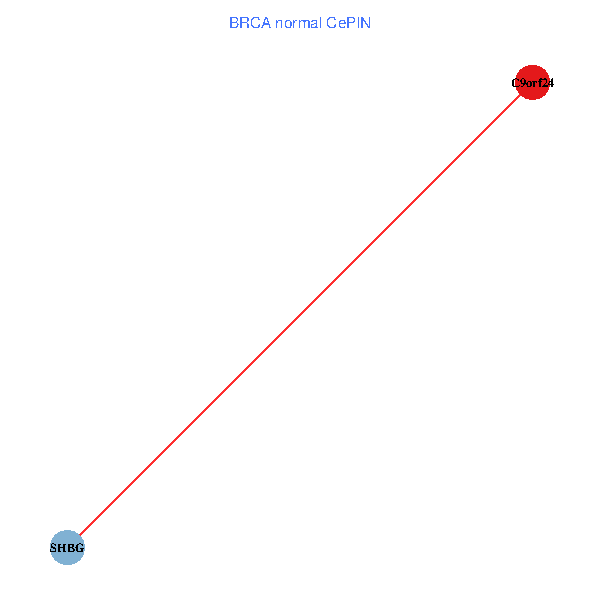 |
| COAD (tumor) | COAD (normal) |
| C9orf24, SHBG (tumor) | C9orf24, SHBG (normal) |
 | 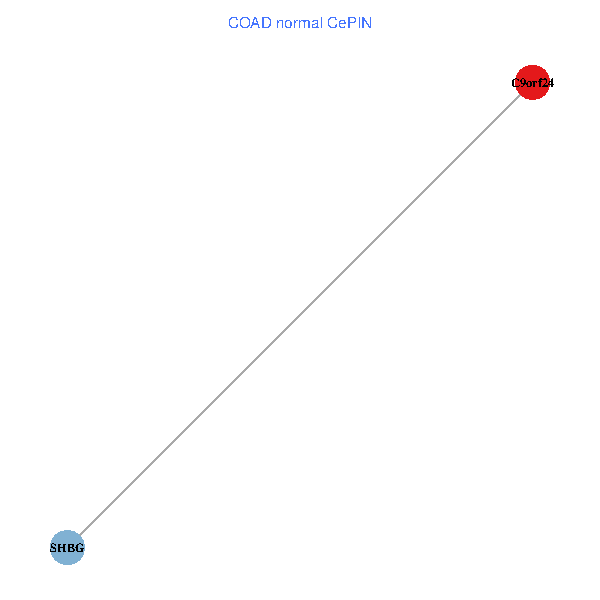 |
| HNSC (tumor) | HNSC (normal) |
| C9orf24, SHBG (tumor) | C9orf24, SHBG (normal) |
 |  |
| KICH (tumor) | KICH (normal) |
| C9orf24, SHBG (tumor) | C9orf24, SHBG (normal) |
 |  |
| KIRC (tumor) | KIRC (normal) |
| C9orf24, SHBG (tumor) | C9orf24, SHBG (normal) |
 |  |
| KIRP (tumor) | KIRP (normal) |
| C9orf24, SHBG (tumor) | C9orf24, SHBG (normal) |
 |  |
| LIHC (tumor) | LIHC (normal) |
| C9orf24, SHBG (tumor) | C9orf24, SHBG (normal) |
 |  |
| LUAD (tumor) | LUAD (normal) |
| C9orf24, SHBG (tumor) | C9orf24, SHBG (normal) |
 |  |
| LUSC (tumor) | LUSC (normal) |
| C9orf24, SHBG (tumor) | C9orf24, SHBG (normal) |
 |  |
| PRAD (tumor) | PRAD (normal) |
| C9orf24, SHBG (tumor) | C9orf24, SHBG (normal) |
 |  |
| STAD (tumor) | STAD (normal) |
| C9orf24, SHBG (tumor) | C9orf24, SHBG (normal) |
 |  |
| THCA (tumor) | THCA (normal) |
| C9orf24, SHBG (tumor) | C9orf24, SHBG (normal) |
 |  |
| Top |
| TissGeneProg for C9orf24 |
| Kaplan-Meier plots with logrank tests of overall survival (OS) using 28 cancer types (TCGA IlluminaHiSeq_RNASeqV2, pan-cancer normalized log2(norm_counts+1) data, version 2016-08-16) (TCGA clinicalMatrix, phenotype data, version 2016-04-27) * Click on the image to enlarge it in a new window. |
 |
| Kaplan-Meier plots with logrank test of relapse free survival (RFS) using 28 cancer types (TCGA IlluminaHiSeq_RNASeqV2, pan-cancer normalized log2(norm_counts+1) data, version 2016-08-16) (TCGA clinicalMatrix, phenotype data, version 2016-04-27) * Click on the image enlarge it in a new window. |
 |
| Forest plot of Cox proportional hazard ratio (HR) and 95% CI of overall survival (OS) using 28 cancer types (TCGA IlluminaHiSeq_RNASeqV2, pan-cancer normalized log2(norm_counts+1) data, version 2016-08-16) (TCGA clinicalMatrix, phenotype data, version 2016-04-27) * Click on the image enlarge it in a new window. |
 |
| Forest plot of Cox proportional hazard ratio (HR) and 95% CI of relapse free survival (RFS) using 28 cancer types (TCGA IlluminaHiSeq_RNASeqV2, pan-cancer normalized log2(norm_counts+1) data, version 2016-08-16) (TCGA clinicalMatrix, phenotype data, version 2016-04-27) * Click on the image enlarge it in a new window. |
 |
| Top |
| TissGeneClin for C9orf24 |
| TissGeneDrug for C9orf24 |
| Drug information targeting TissGene (DrugBank Version 5.0.6, 2017-04-01) |
| DrugBank ID | Drug name | Drug activity | Drug type | Drug status |
| Top |
| TissGeneDisease for C9orf24 |
| Disease information associated with TissGene (DisGeNet, 2016-06-01) |
| Disease ID | Disease name | # pubmeds | Source |
|
Copyright 2016-Present - The University of Texas Health Science Center at Houston (UTHealth) Web File Viewing | How to Report, Fraud, Waste and Abuse | State of Texas | Statewide Search | Texas Homeland Security | Site Policies |