 |
| |
| |
| |
| |
| |
| |
|

| TissGeneSummary for MS4A14 |
 Gene summary Gene summary |
| Basic gene information | Gene symbol | MS4A14 |
| Gene name | membrane-spanning 4-domains, subfamily A, member 14 | |
| Synonyms | MS4A16|NYD-SP21 | |
| Cytomap | UCSC genome browser: 11q12.2 | |
| Type of gene | protein-coding | |
| RefGenes | NM_001079692.2, NM_001261827.1,NM_001261828.1,NM_032597.4,NR_049731.1, NR_049732.1,NR_049733.1,NR_049734.1, | |
| Description | MS4A13 proteinmembrane-spanning 4-domains subfamily A member 14membrane-spanning 4-domains, subfamily A, member 16testes development-related NYD-SP21testis development protein NYD-SP21 | |
| Modification date | 20141207 | |
| dbXrefs | HGNC : HGNC | |
| Ensembl : ENSG00000166928 | ||
| HPRD : 14863 | ||
| Vega : OTTHUMG00000167357 | ||
| Protein | UniProt: go to UniProt's Cross Reference DB Table | |
| Expression | CleanEX: HS_MS4A14 | |
| BioGPS: 84689 | ||
| Pathway | NCI Pathway Interaction Database: MS4A14 | |
| KEGG: MS4A14 | ||
| REACTOME: MS4A14 | ||
| Pathway Commons: MS4A14 | ||
| Context | iHOP: MS4A14 | |
| ligand binding site mutation search in PubMed: MS4A14 | ||
| UCL Cancer Institute: MS4A14 | ||
| Assigned class in TissGDB* | B | |
| Included tissue-specific gene expression resources | HPA,TiGER,GTEx | |
| Specific-tissues in normal samples (assigned by TissGDB using HPA, TiGER, and GTEx) | Testis | |
| Cancer types related to the specific-tissues in cancer samples (assigned by TissGDB using TCGA) | TGCT | |
| Reference showing the relevant tissue of MS4A14 | ||
| Description by TissGene annotations | ||
| * Class A consists of genes with literature evidence and is part of the cTissGenes. Class B consists of only cTissGenes without additional evidence. The remaining genes belong to Class C. |
| Gene ontology having evidence of Inferred from Direct Assay (IDA) from Entrez |
| GO ID | GO term | PubMed ID |
| Top |
| TissGeneExp for MS4A14 |
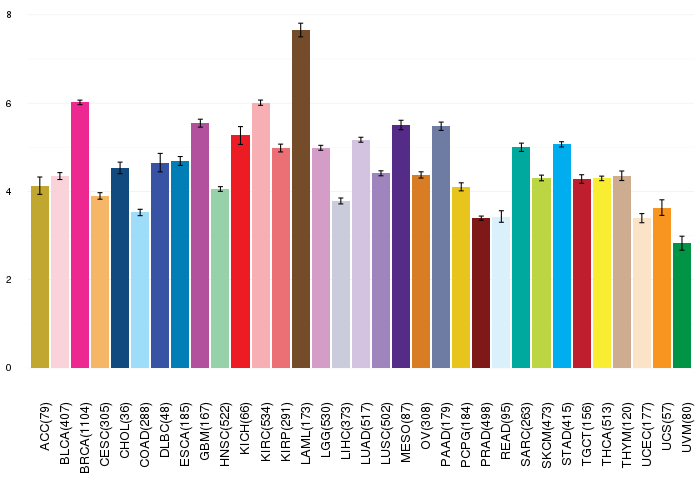
| Gene expressions across 28 cancer types (X-axis: cancer type and Y-axis: log2(norm_counts+1)) (TCGA IlluminaHiSeq_RNASeqV2, pan-cancer normalized log2(norm_counts+1) data, version 2016-08-16) |
 |
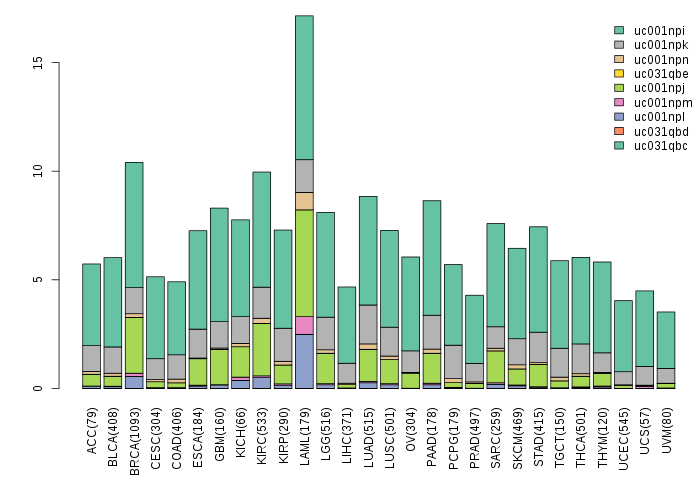
| Gene isoform expressions across 28 cancer types (X-axis: cancer type and Y-axis: log2(norm_counts+1)) (TCGA pan-cancer tcga_rsem_isoform_tpm, version 2016-09-01) |
 |
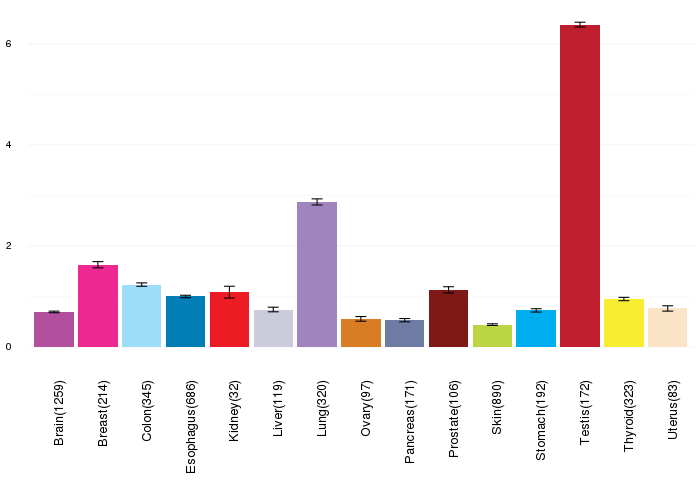
| Gene expressions across normal tissues of GTEx data (GTEx GTEx_Analysis_v6_RNA-seq_RNA-SeQCv1.1.8_gene_rpkm.gct) - Here, we shows the matched tissue types only among our 28 cancer types. |
 |
| Different expressions across 14 cancer types with more than 10 samples between matched tumors and normals (X-axis: cancer type and Y-axis: log2(norm_counts+1)) (TCGA IlluminaHiSeq_RNASeqV2, pan-cancer normalized log2(norm_counts+1) data, version 2016-08-16) |
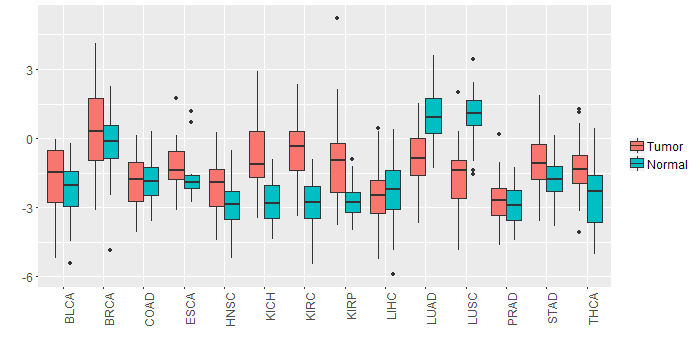 |
| - Significantly differentially expressed cancer types and information. (|Fold change|>1 and FDR<0.05) |
| Cancer type | Mean(exp) in tumor | Mean(exp) in matched normal | Log2FC | P-val. | FDR |
| THCA | -1.362972583 | -2.470113261 | 1.107140678 | 2.39E-06 | 8.65E-06 |
| KIRP | -1.095474596 | -2.744462096 | 1.6489875 | 1.88E-05 | 7.45E-05 |
| LUSC | -1.645237954 | 0.992065968 | -2.637303922 | 6.92E-19 | 7.05E-18 |
| KICH | -0.774354346 | -2.785618346 | 2.011264 | 1.54E-06 | 5.66E-06 |
| KIRC | -0.505064179 | -2.769176679 | 2.2641125 | 1.04E-25 | 1.32E-24 |
| LUAD | -0.926923518 | 1.015186827 | -1.942110345 | 1.31E-14 | 1.31E-13 |
| Top |
| TissGene-miRNA for MS4A14 |
| Significantly anti-correlated miRNAs of TissGene across 28 cancer types (Gene-miRNA relations from TargetScanHuman Relsease 7.1, Conserved_Site_Context_Scores.txt.zip, 06.01.2016) (TCGA IlluminaHiSeq_miRNASeq, log2(RPM+1) data, version 2016-11-21) (TCGA IlluminaHiSeq_RNASeqV2, log2(normalized_count+1) data, version 2016-08-16) (Spearman’s Rank Correlation (p-value<0.05 and coefficient<-0.25)) |
| Cancer type | miRNA id | miRNA accession | P-val. | Coeff. | # samples |
| Top |
| TissGeneMut for MS4A14 |
| TissGeneSNV for MS4A14 |
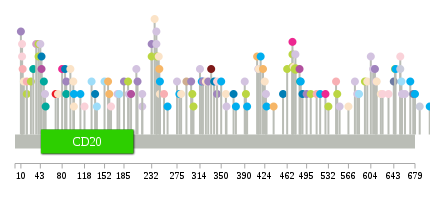
| nsSNV counts per each loci. Different colors of circles represent different cancer types. Circle size denotes number of samples. (TCGA somatic mutation (SNPs and small INDELs) data, version 2016-04-25) * Click on the image to enlarge it in a new window. |
 |
 |
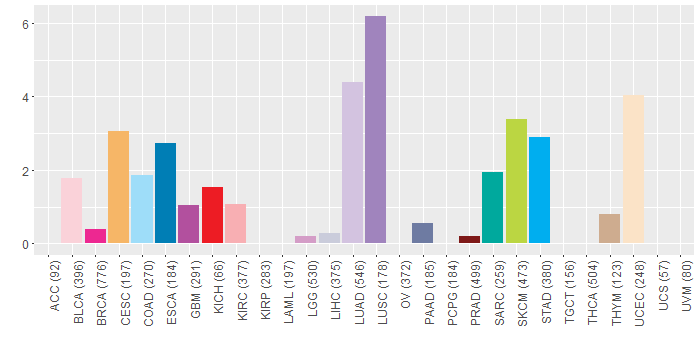
| Somatic nucleotide variants of TissGene across 28 cancer types (X-axis: cancer type and Y-axis: % of mutated samples) The numbers in parentheses are numbers of samples with mutation (nsSNVs). (TCGA somatic mutation (SNPs and small INDELs) data, version 2016-04-25) |
 |
| - nsSNVs sorted by frequency. |
| AAchange | Cancer type | # samples |
| p.E476K | SKCM | 2 |
| p.R152I | COAD | 1 |
| p.D100N | STAD | 1 |
| p.A427D | STAD | 1 |
| p.Q185K | LUSC | 1 |
| p.S646Y | STAD | 1 |
| p.S240Y | LUAD | 1 |
| p.S679Y | STAD | 1 |
| p.F160L | CESC | 1 |
| p.R485W | STAD | 1 |
| p.E227X | READ | 1 |
| p.Q662K | LUAD | 1 |
| p.D319G | LUSC | 1 |
| p.R500I | READ | 1 |
| p.G40R | SKCM | 1 |
| p.R226T | HNSC | 1 |
| p.D583N | HNSC | 1 |
| p.K338T | ESCA | 1 |
| p.R484G | SARC | 1 |
| p.G94* | UCEC | 1 |
| p.E470Q | HNSC | 1 |
| p.R73I | UCEC | 1 |
| p.L301V | SKCM | 1 |
| p.A10E | LUSC | 1 |
| p.P577Q | LUAD | 1 |
| p.Q622* | HNSC | 1 |
| p.A299S | LUSC | 1 |
| p.E232K | SKCM | 1 |
| p.P317T | STAD | 1 |
| p.A197V | GBM | 1 |
| p.E246D | STAD | 1 |
| p.E613K | LUAD | 1 |
| p.M488T | ESCA | 1 |
| p.D36G | LGG | 1 |
| p.H343Y | LUSC | 1 |
| p.D608H | LUAD | 1 |
| p.S193L | LUAD | 1 |
| p.F621I | UCEC | 1 |
| p.S502F | SKCM | 1 |
| p.C139Y | COAD | 1 |
| p.D192N | SKCM | 1 |
| p.W471C | BRCA | 1 |
| p.V624I | BLCA | 1 |
| p.W471* | SKCM | 1 |
| p.A414T | UCEC | 1 |
| p.M455T | ESCA | 1 |
| p.N177Y | COAD | 1 |
| p.D100Y | UCEC | 1 |
| p.N444I | HNSC | 1 |
| p.Q253P | KIRC | 1 |
| p.I424S | UCEC | 1 |
| p.K371T | ESCA | 1 |
| p.S322F | READ | 1 |
| p.E594K | SKCM | 1 |
| p.P216S | LUAD | 1 |
| p.S473Y | UCEC | 1 |
| p.W85C | ESCA | 1 |
| p.E232* | LUSC | 1 |
| p.L704R | STAD | 1 |
| p.I237N | UCEC | 1 |
| p.D374G | READ | 1 |
| p.H413Q | LUAD | 1 |
| p.T390K | LUAD | 1 |
| p.L51M | LUAD | 1 |
| p.T111M | STAD | 1 |
| p.E245K | CESC | 1 |
| p.F158L | CESC | 1 |
| p.L49R | SARC | 1 |
| p.S483T | GBM | 1 |
| p.Q426K | LUAD | 1 |
| p.H31Y | SARC | 1 |
| p.S362T | HNSC | 1 |
| p.T421I | CESC | 1 |
| p.H657N | LUAD | 1 |
| p.V13I | KIRC | 1 |
| p.K291R | THYM | 1 |
| p.A394D | STAD | 1 |
| p.A282V | UCEC | 1 |
| p.H12D | BLCA | 1 |
| p.A206D | LUAD | 1 |
| p.E20K | SKCM | 1 |
| p.D676N | PAAD | 1 |
| p.G69S | KICH | 1 |
| p.S375F | STAD | 1 |
| p.Q333K | PRAD | 1 |
| p.K598N | UCEC | 1 |
| p.P52L | SARC | 1 |
| p.D136H | ESCA | 1 |
| p.S581Y | LUAD | 1 |
| p.E249K | HNSC | 1 |
| p.A566V | UCEC | 1 |
| p.T15I | UCEC | 1 |
| p.S545Y | KIRC | 1 |
| p.Q604K | LUAD | 1 |
| p.W687X | LIHC | 1 |
| p.G40E | SKCM | 1 |
| p.Q551K | LUAD | 1 |
| p.S512Y | KIRC | 1 |
| p.W654* | BLCA | 1 |
| p.S527F | BRCA | 1 |
| p.E328K | LUSC | 1 |
| p.D314V | LUAD | 1 |
| p.E246* | UCEC | 1 |
| p.P253R | HNSC | 1 |
| p.E20Q | KIRC | 1 |
| p.P216T | LUAD | 1 |
| p.S547F | SKCM | 1 |
| p.L45S | ESCA | 1 |
| p.T80S | BRCA | 1 |
| p.L45F | GBM | 1 |
| p.H12Y | BLCA | 1 |
| p.F208L | LUSC | 1 |
| p.L130P | COAD | 1 |
| p.R43* | LUAD | 1 |
| p.S118C | BLCA | 1 |
| p.G584R | COAD | 1 |
| p.E279D | STAD | 1 |
| p.S163L | BLCA | 1 |
| p.P350T | STAD | 1 |
| p.S392F | SKCM | 1 |
| p.E145Q | HNSC | 1 |
| p.L353F | DLBC | 1 |
| p.E634D | BLCA | 1 |
| p.D439Y | CESC | 1 |
| p.A87E | LUSC | 1 |
| p.A611V | LUSC | 1 |
| p.V303D | SKCM | 1 |
| p.D643N | PAAD | 1 |
| p.T99A | UCEC | 1 |
| p.S462L | SKCM | 1 |
| p.P357S | HNSC | 1 |
| p.R518W | STAD | 1 |
| p.D379Y | READ | 1 |
| p.H343Y | BLCA | 1 |
| p.S532F | SKCM | 1 |
| p.K275T | LUAD | 1 |
| p.L671R | STAD | 1 |
| p.P174T | LUAD | 1 |
| p.A87E | SARC | 1 |
| p.Q358R | UCEC | 1 |
| p.A324V | UCEC | 1 |
| p.W471X | SKCM | 1 |
| p.S240T | LUAD | 1 |
| p.L495F | LUSC | 1 |
| p.S411* | CESC | 1 |
| p.S381P | DLBC | 1 |
| p.D459Y | READ | 1 |
| p.P417S | STAD | 1 |
| p.W654* | LIHC | 1 |
| p.G359C | LUAD | 1 |
| p.P27L | SKCM | 1 |
| p.E476* | LUAD | 1 |
| p.P241S | SKCM | 1 |
| p.F656L | COAD | 1 |
| p.S322F | HNSC | 1 |
| p.K614N | UCEC | 1 |
| p.E645K | SKCM | 1 |
| p.S244P | UCEC | 1 |
| p.P259H | STAD | 1 |
| Top |
| TissGeneCNV for MS4A14 |
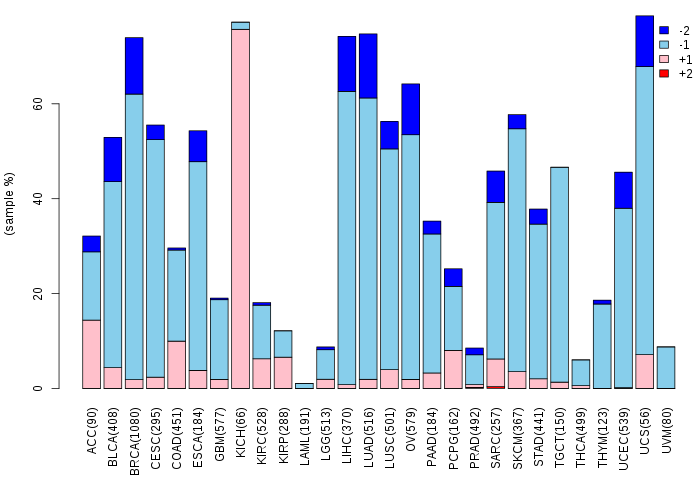
| Copy number variations of TissGene across 28 cancer types (X-axis: cancer type and Y-axis: % of CNV samples) (TCGA Gistic2_CopyNumber_Gistic2_all_data_by_genes, Gistic2 copy number data, version 2016-08-16) |
 |
| Top |
| TissGeneFusions for MS4A14 |
| Fusion genes including TissGene (ChimerDB 3.0, 2016-12-01 and TCGA fusion Portal 2015-12-01) |
| Database | Src | Cancer type | Sample | Fusion gene | ORF | 5'-gene BP | 3'-gene BP |
| Top |
| TissGeneNet for MS4A14 |
| Co-expressed gene networks based on protein-protein interaction data (CePIN) (TCGA IlluminaHiSeq_RNASeqV2, pan-cancer normalized log2(norm_counts+1) data, version 2016-08-16) (PINA2 ppi data) |
| Top |
| TissGeneProg for MS4A14 |
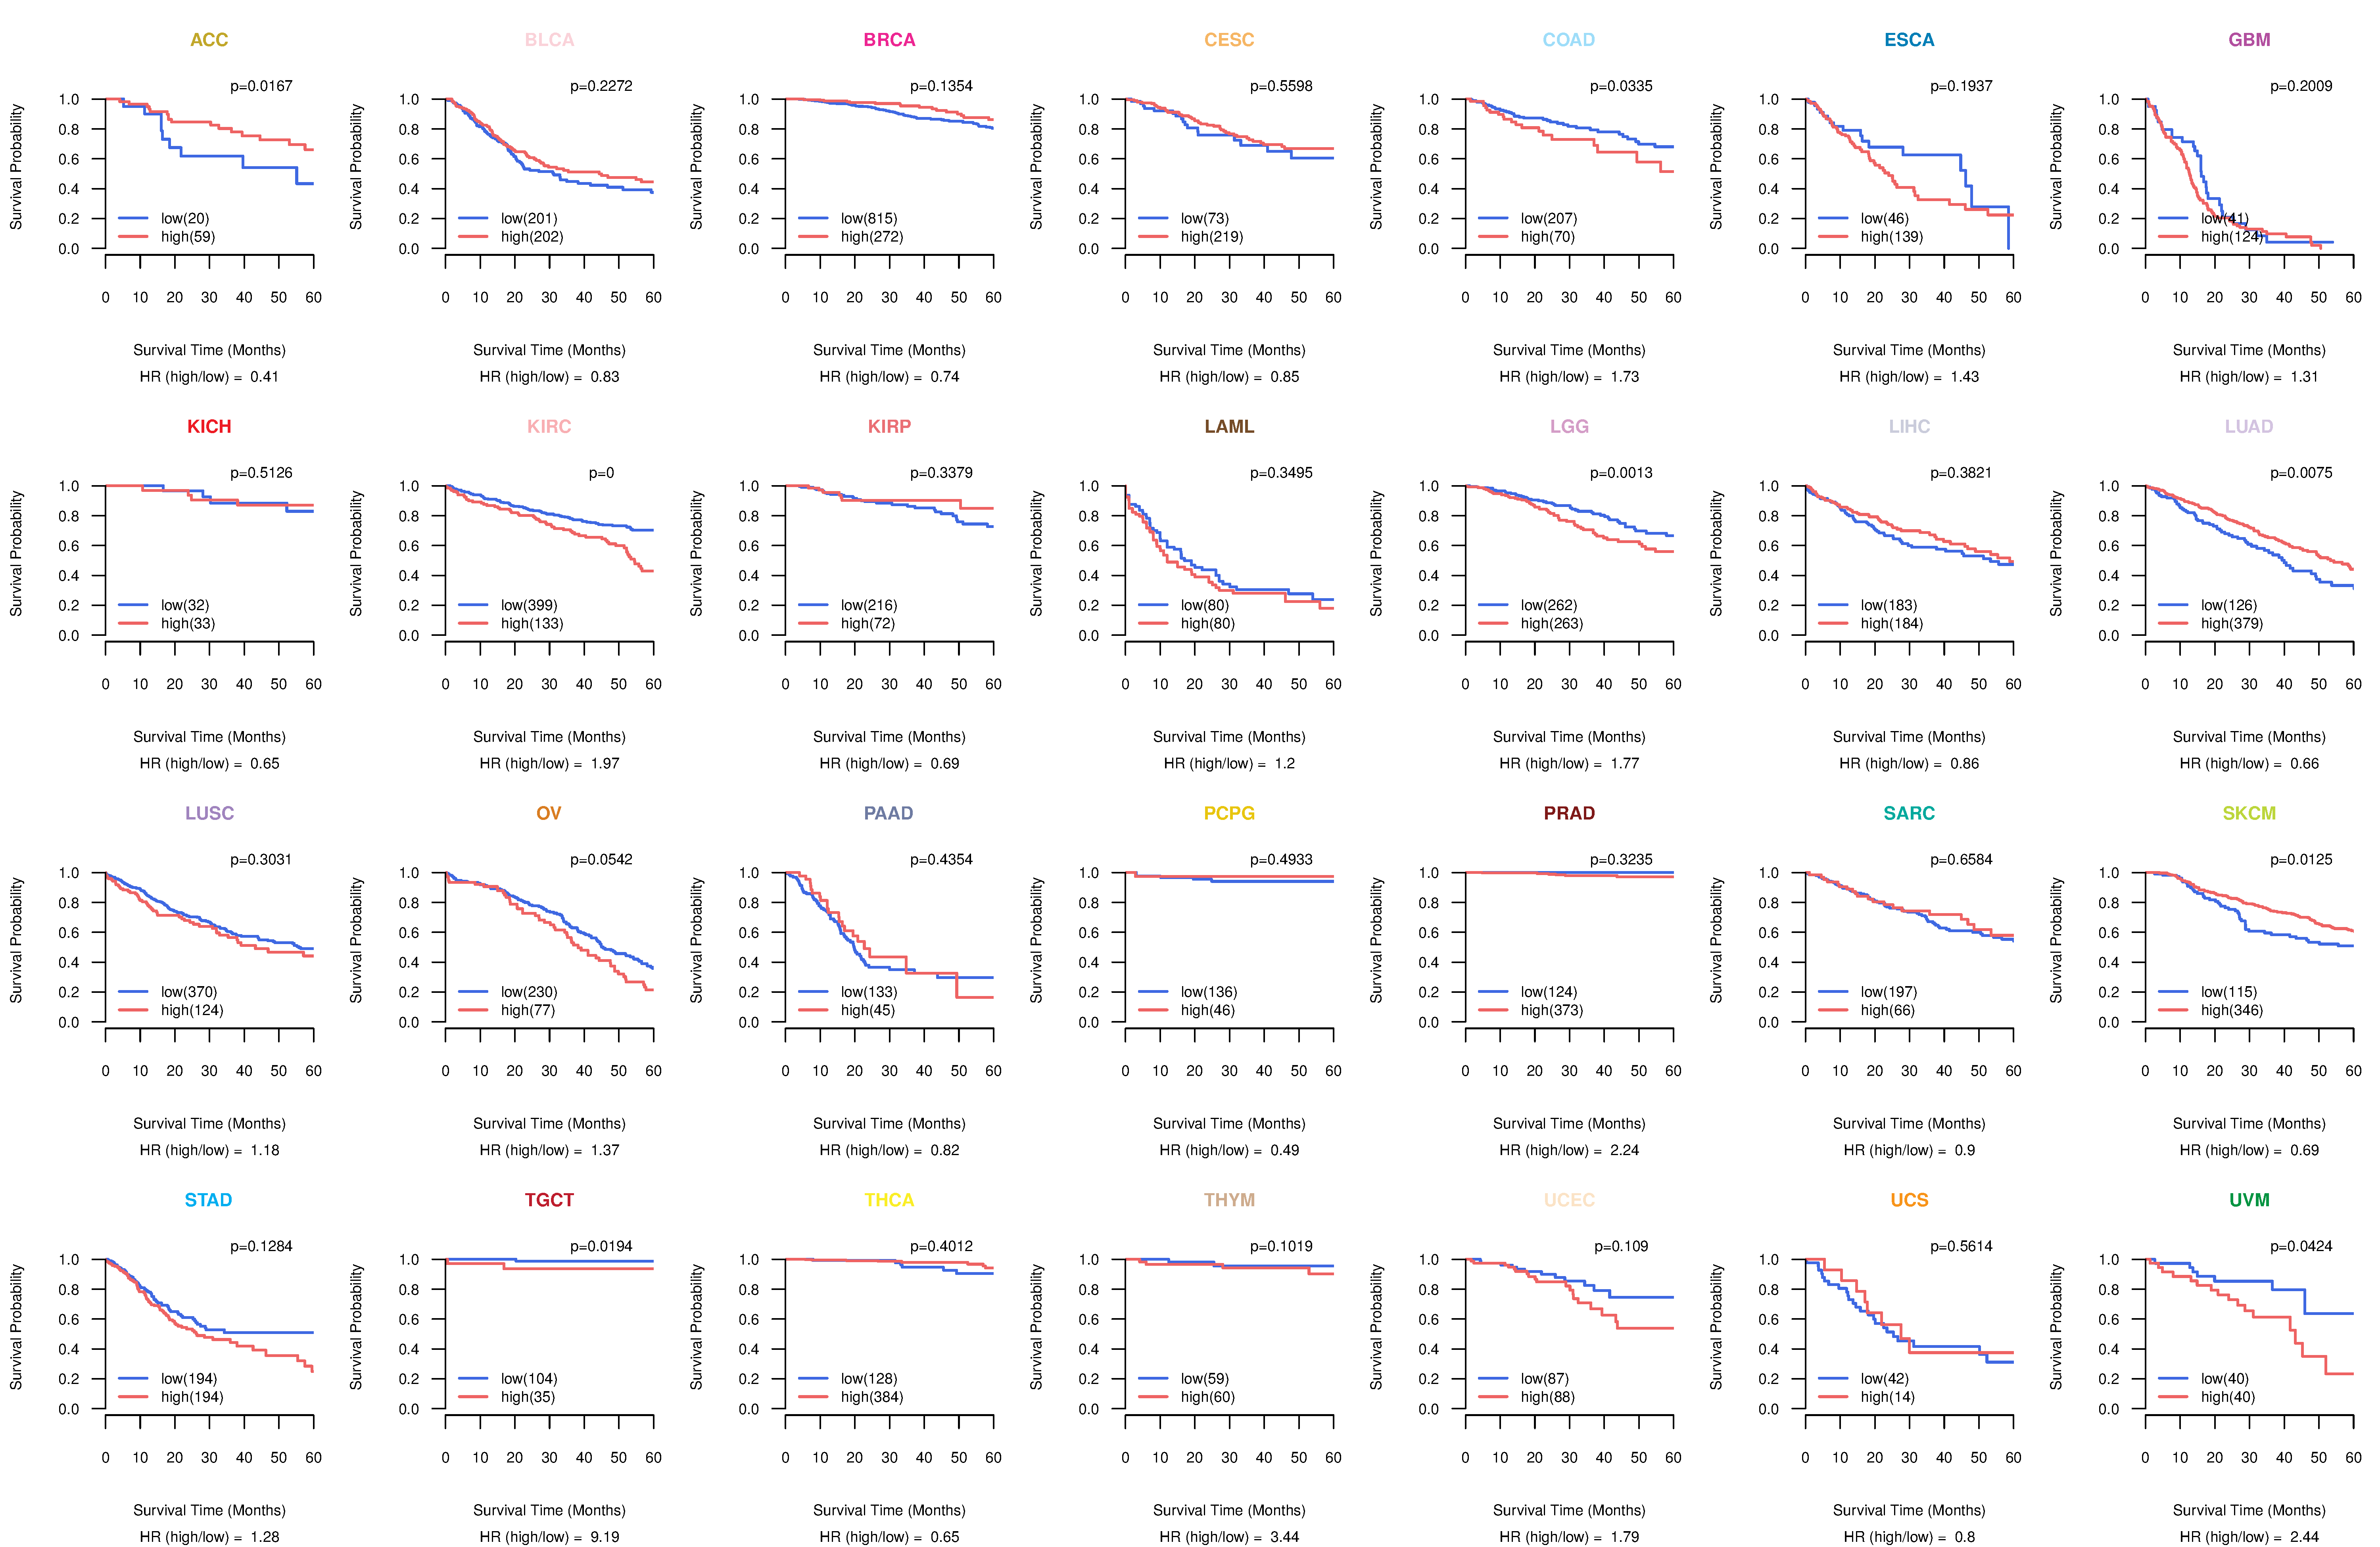
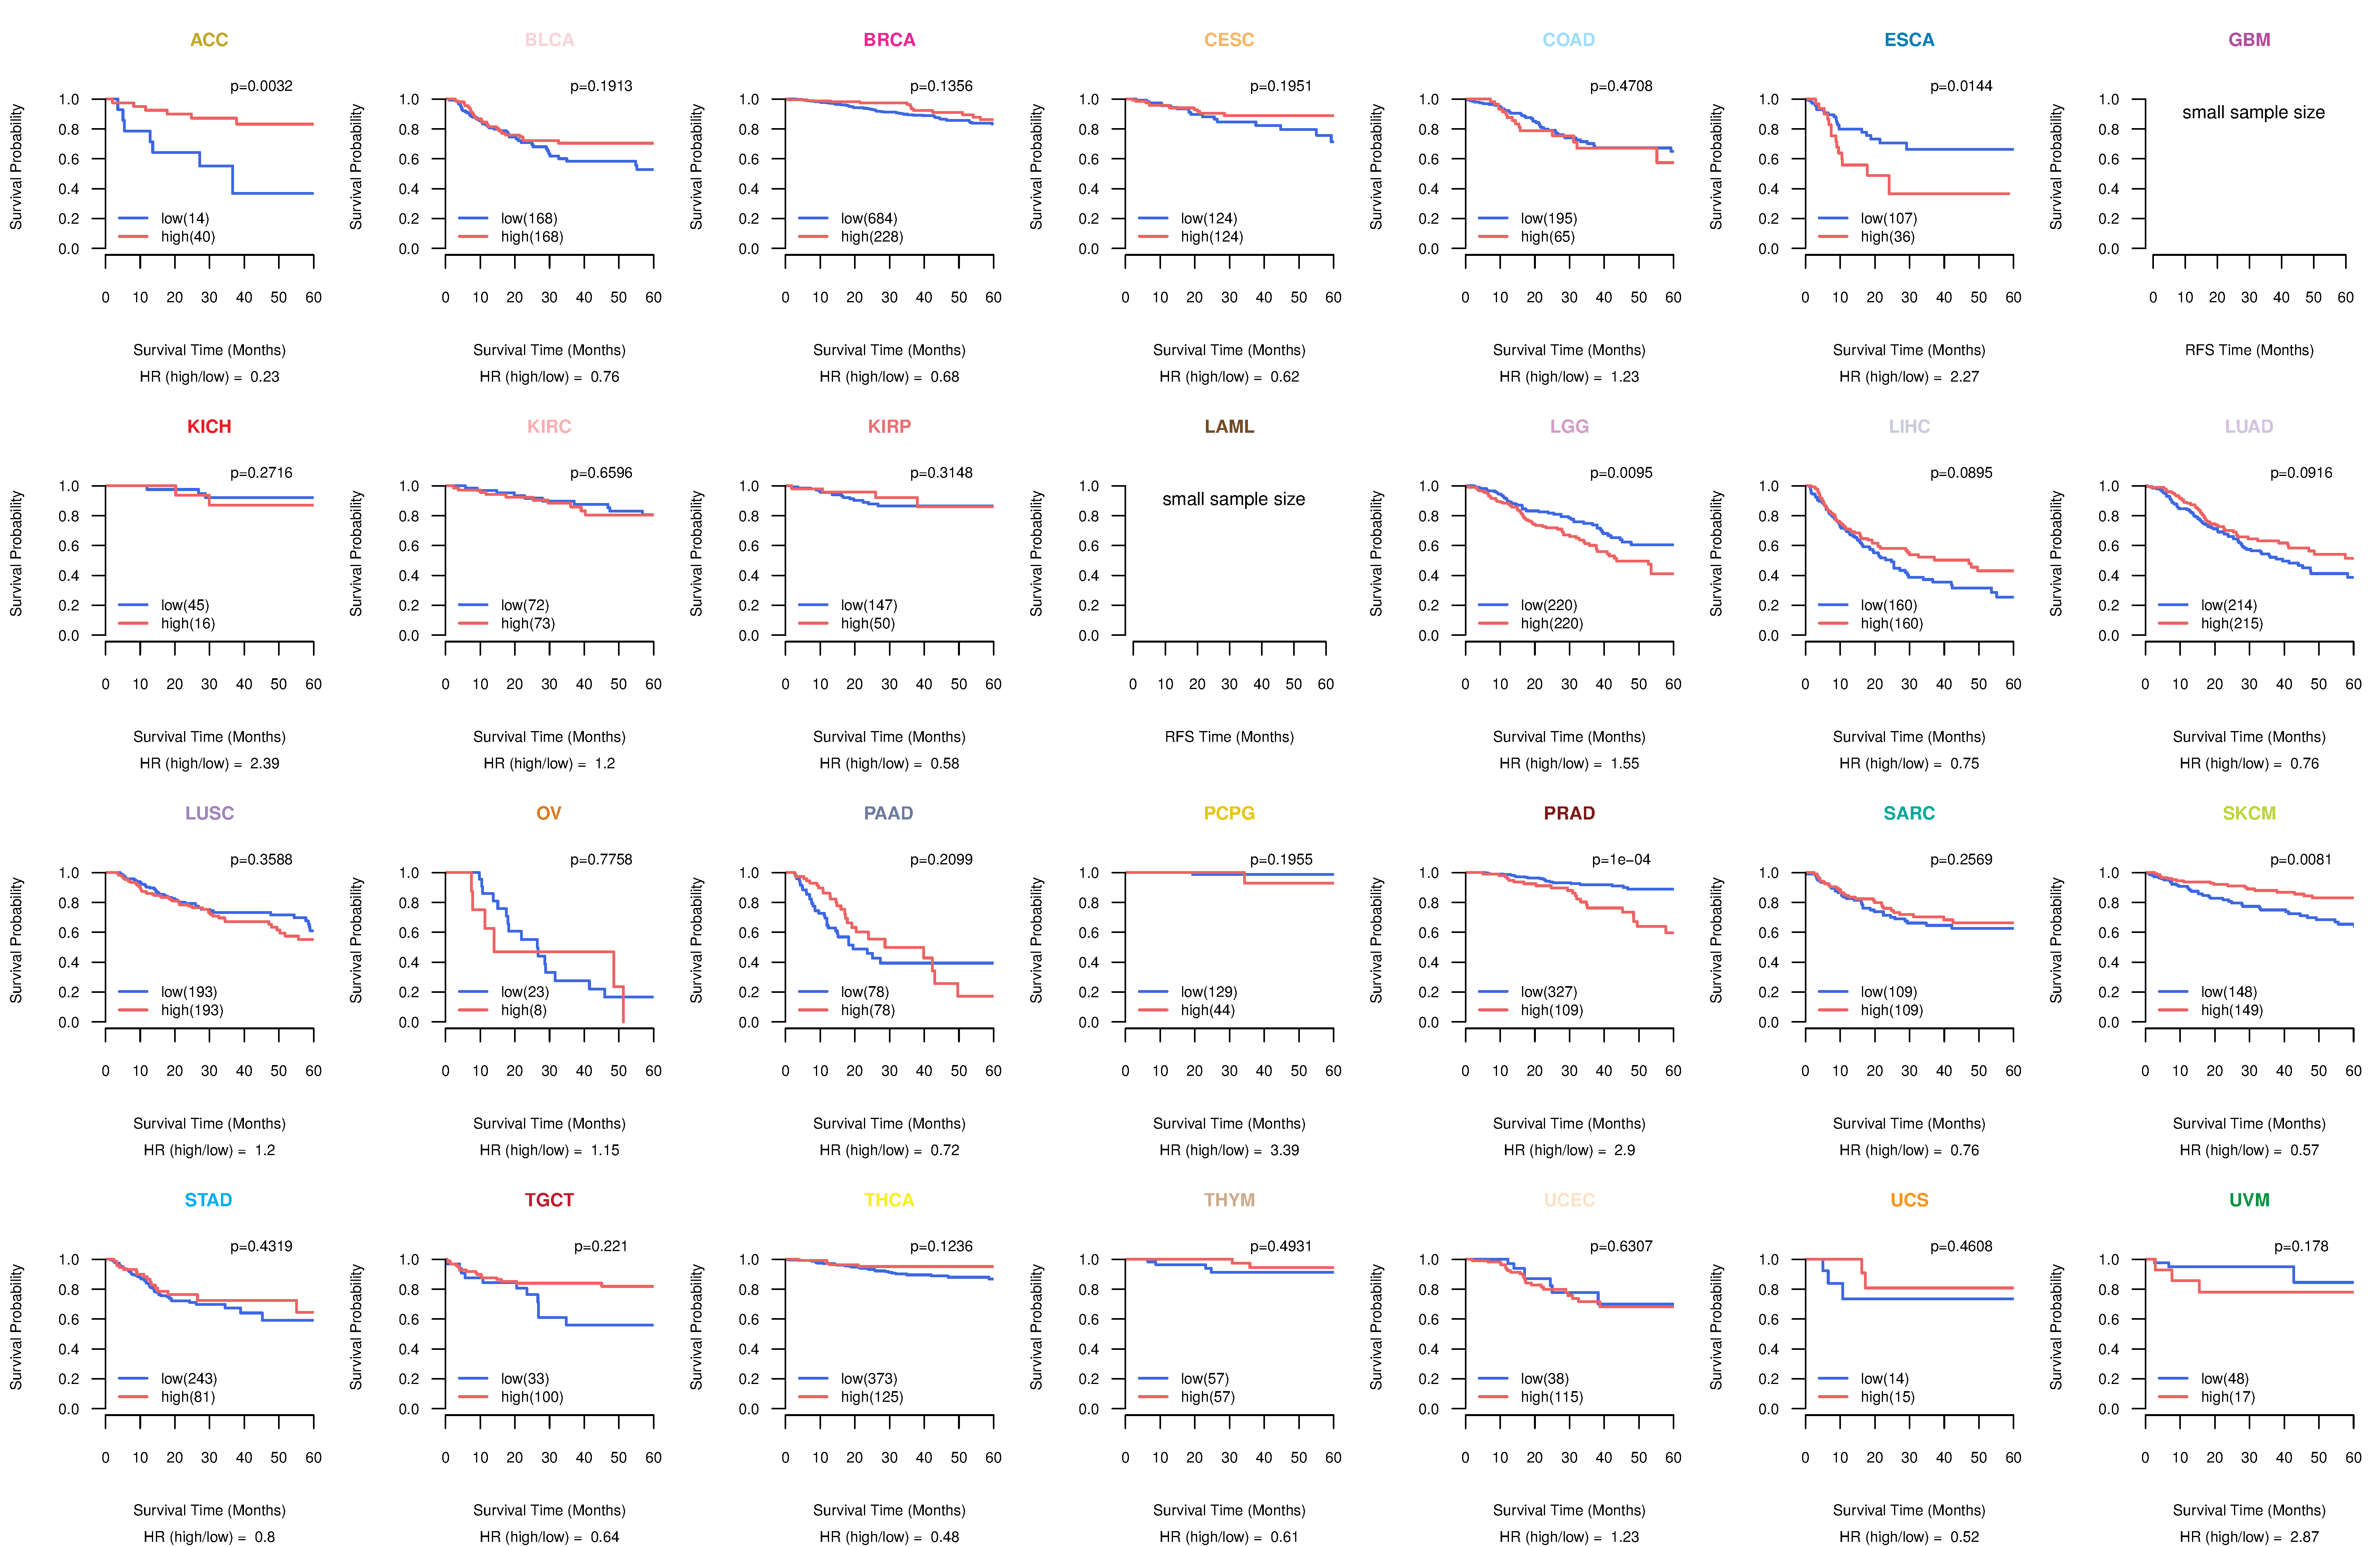
| Kaplan-Meier plots with logrank tests of overall survival (OS) using 28 cancer types (TCGA IlluminaHiSeq_RNASeqV2, pan-cancer normalized log2(norm_counts+1) data, version 2016-08-16) (TCGA clinicalMatrix, phenotype data, version 2016-04-27) * Click on the image to enlarge it in a new window. |
 |
| Kaplan-Meier plots with logrank test of relapse free survival (RFS) using 28 cancer types (TCGA IlluminaHiSeq_RNASeqV2, pan-cancer normalized log2(norm_counts+1) data, version 2016-08-16) (TCGA clinicalMatrix, phenotype data, version 2016-04-27) * Click on the image enlarge it in a new window. |
 |
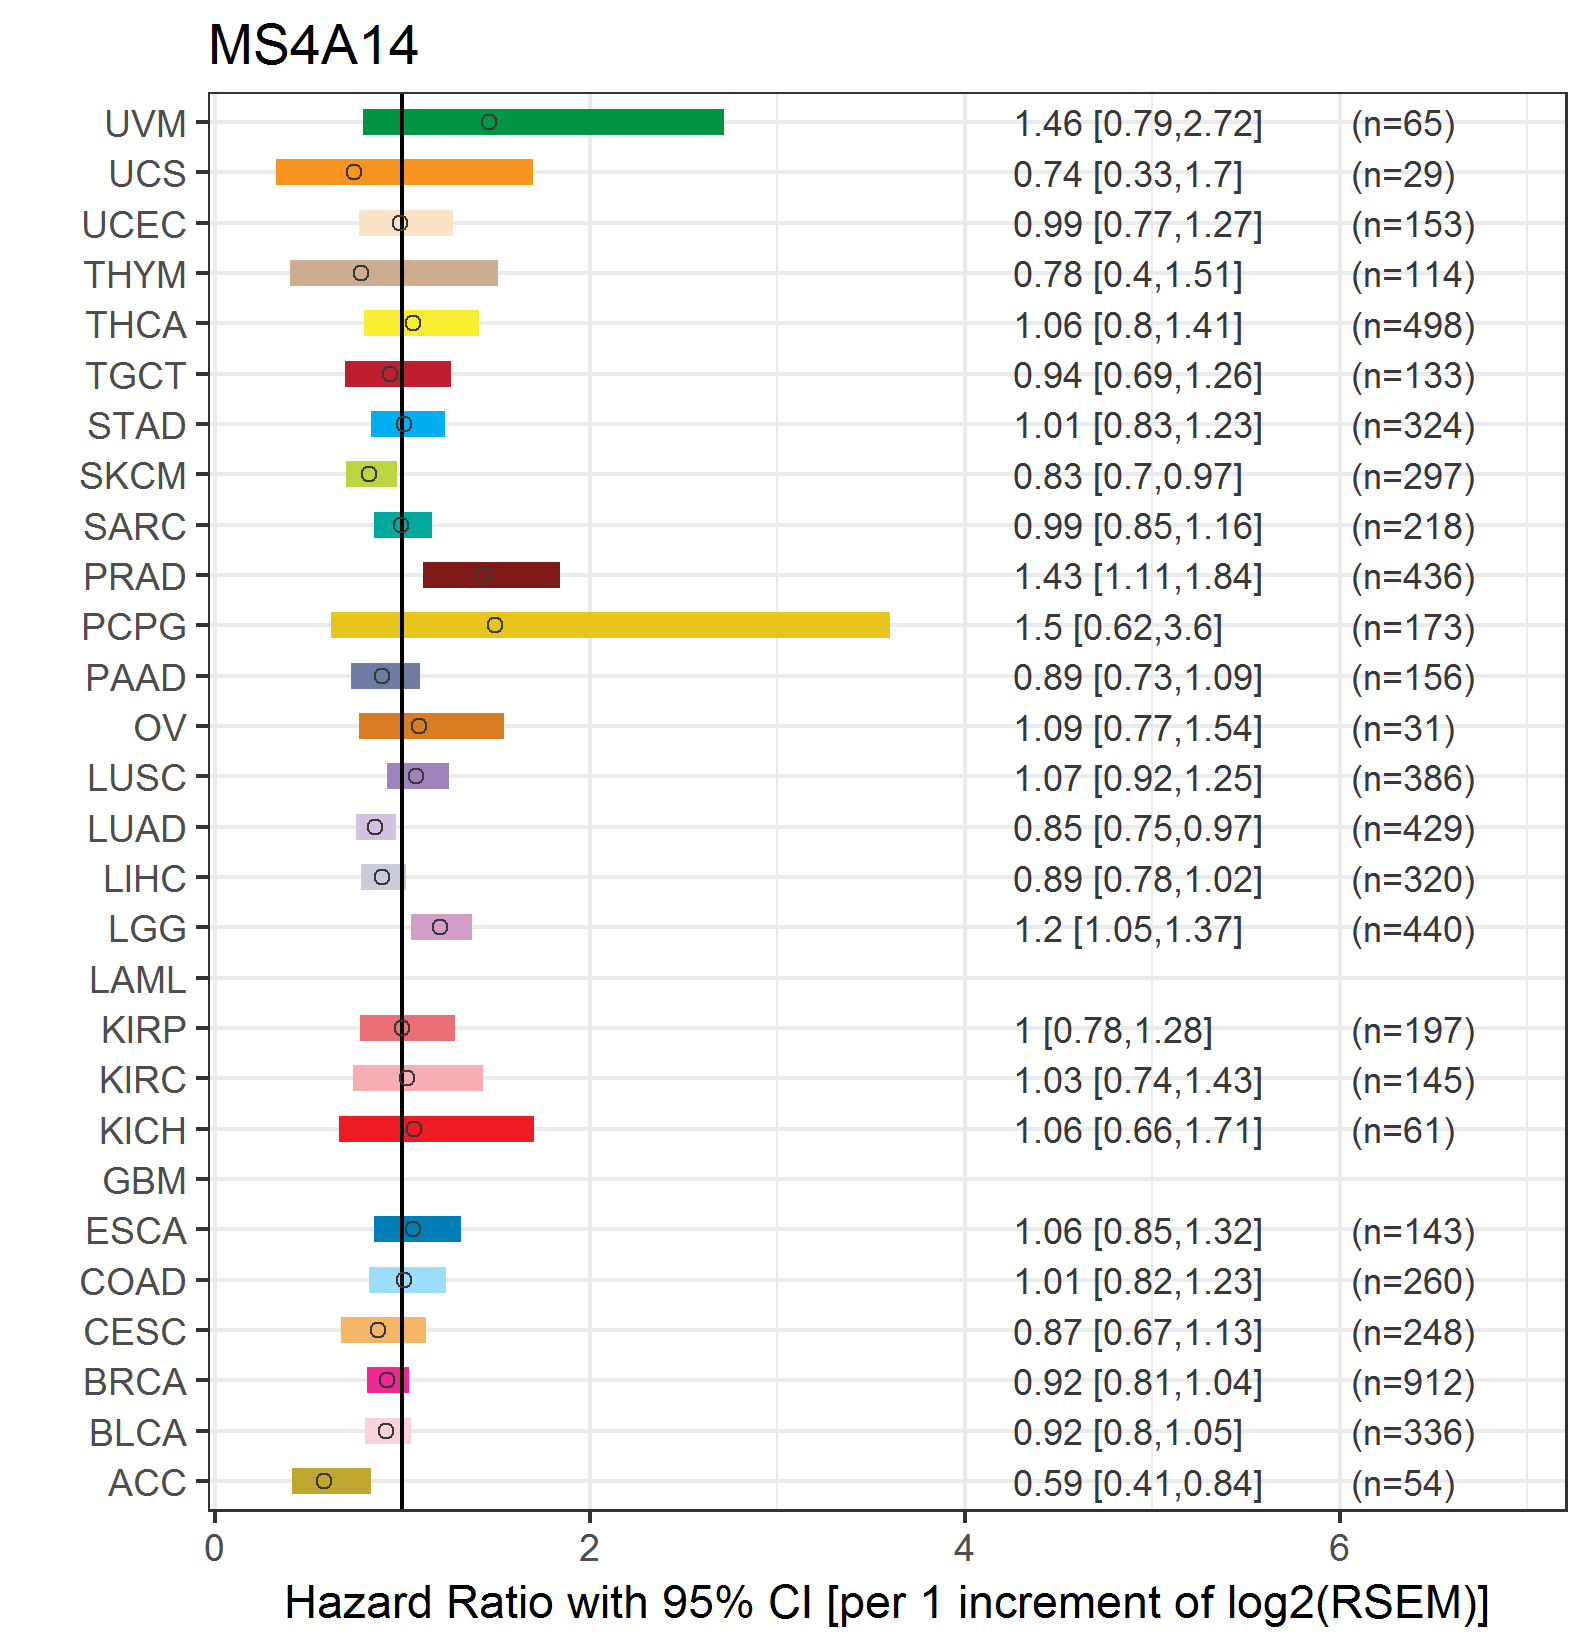
| Forest plot of Cox proportional hazard ratio (HR) and 95% CI of overall survival (OS) using 28 cancer types (TCGA IlluminaHiSeq_RNASeqV2, pan-cancer normalized log2(norm_counts+1) data, version 2016-08-16) (TCGA clinicalMatrix, phenotype data, version 2016-04-27) * Click on the image enlarge it in a new window. |
 |
| Forest plot of Cox proportional hazard ratio (HR) and 95% CI of relapse free survival (RFS) using 28 cancer types (TCGA IlluminaHiSeq_RNASeqV2, pan-cancer normalized log2(norm_counts+1) data, version 2016-08-16) (TCGA clinicalMatrix, phenotype data, version 2016-04-27) * Click on the image enlarge it in a new window. |
 |
| Top |
| TissGeneClin for MS4A14 |
| TissGeneDrug for MS4A14 |
| Drug information targeting TissGene (DrugBank Version 5.0.6, 2017-04-01) |
| DrugBank ID | Drug name | Drug activity | Drug type | Drug status |
| Top |
| TissGeneDisease for MS4A14 |
| Disease information associated with TissGene (DisGeNet, 2016-06-01) |
| Disease ID | Disease name | # pubmeds | Source |
|
Copyright 2016-Present - The University of Texas Health Science Center at Houston (UTHealth) Web File Viewing | How to Report, Fraud, Waste and Abuse | State of Texas | Statewide Search | Texas Homeland Security | Site Policies |