 |
| |
| |
| |
| |
| |
| |
|

| TissGeneSummary for FAM104A |
 Gene summary Gene summary |
| Basic gene information | Gene symbol | FAM104A |
| Gene name | family with sequence similarity 104, member A | |
| Synonyms | - | |
| Cytomap | UCSC genome browser: 17q25.1 | |
| Type of gene | protein-coding | |
| RefGenes | NM_001098832.1, NM_001289410.1,NM_001289411.1,NM_001289412.1,NM_032837.2, | |
| Description | protein FAM104A | |
| Modification date | 20141207 | |
| dbXrefs | HGNC : HGNC | |
| Ensembl : ENSG00000133193 | ||
| HPRD : 08602 | ||
| Vega : OTTHUMG00000150564 | ||
| Protein | UniProt: go to UniProt's Cross Reference DB Table | |
| Expression | CleanEX: HS_FAM104A | |
| BioGPS: 84923 | ||
| Pathway | NCI Pathway Interaction Database: FAM104A | |
| KEGG: FAM104A | ||
| REACTOME: FAM104A | ||
| Pathway Commons: FAM104A | ||
| Context | iHOP: FAM104A | |
| ligand binding site mutation search in PubMed: FAM104A | ||
| UCL Cancer Institute: FAM104A | ||
| Assigned class in TissGDB* | C | |
| Included tissue-specific gene expression resources | ||
| Specific-tissues in normal samples (assigned by TissGDB using HPA, TiGER, and GTEx) | Testis | |
| Cancer types related to the specific-tissues in cancer samples (assigned by TissGDB using TCGA) | TGCT | |
| Reference showing the relevant tissue of FAM104A | ||
| Description by TissGene annotations | Have significant anti-correlated miRNA TissgsLTS | |
| * Class A consists of genes with literature evidence and is part of the cTissGenes. Class B consists of only cTissGenes without additional evidence. The remaining genes belong to Class C. |
| Gene ontology having evidence of Inferred from Direct Assay (IDA) from Entrez |
| GO ID | GO term | PubMed ID |
| Top |
| TissGeneExp for FAM104A |
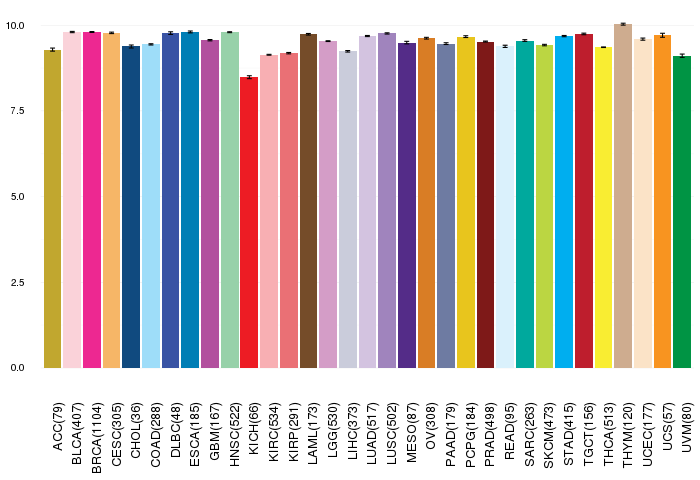
| Gene expressions across 28 cancer types (X-axis: cancer type and Y-axis: log2(norm_counts+1)) (TCGA IlluminaHiSeq_RNASeqV2, pan-cancer normalized log2(norm_counts+1) data, version 2016-08-16) |
 |
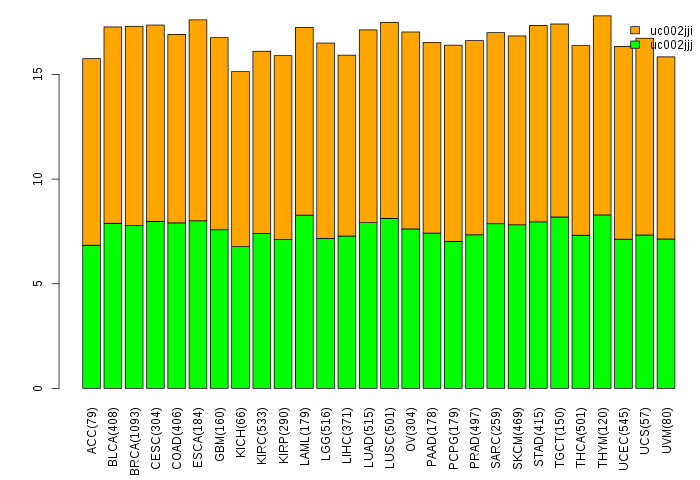
| Gene isoform expressions across 28 cancer types (X-axis: cancer type and Y-axis: log2(norm_counts+1)) (TCGA pan-cancer tcga_rsem_isoform_tpm, version 2016-09-01) |
 |
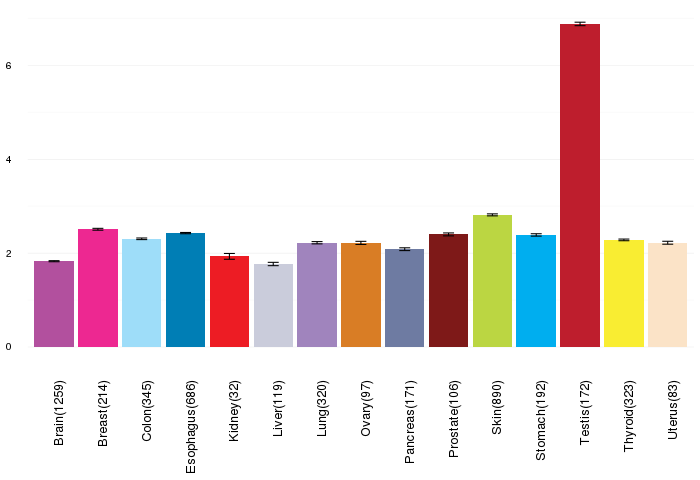
| Gene expressions across normal tissues of GTEx data (GTEx GTEx_Analysis_v6_RNA-seq_RNA-SeQCv1.1.8_gene_rpkm.gct) - Here, we shows the matched tissue types only among our 28 cancer types. |
 |
| Different expressions across 14 cancer types with more than 10 samples between matched tumors and normals (X-axis: cancer type and Y-axis: log2(norm_counts+1)) (TCGA IlluminaHiSeq_RNASeqV2, pan-cancer normalized log2(norm_counts+1) data, version 2016-08-16) |
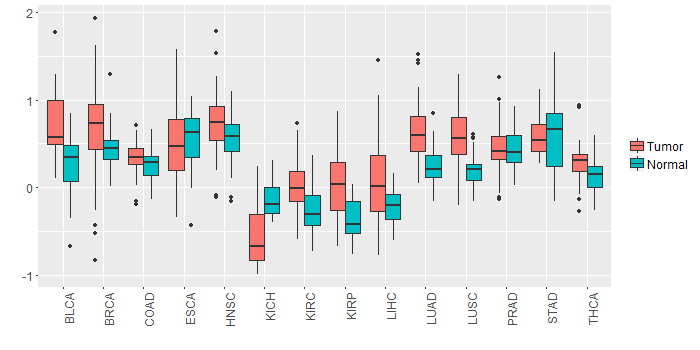 |
| - Significantly differentially expressed cancer types and information. (|Fold change|>1 and FDR<0.05) |
| Cancer type | Mean(exp) in tumor | Mean(exp) in matched normal | Log2FC | P-val. | FDR |
| Top |
| TissGene-miRNA for FAM104A |
| Significantly anti-correlated miRNAs of TissGene across 28 cancer types (Gene-miRNA relations from TargetScanHuman Relsease 7.1, Conserved_Site_Context_Scores.txt.zip, 06.01.2016) (TCGA IlluminaHiSeq_miRNASeq, log2(RPM+1) data, version 2016-11-21) (TCGA IlluminaHiSeq_RNASeqV2, log2(normalized_count+1) data, version 2016-08-16) (Spearman’s Rank Correlation (p-value<0.05 and coefficient<-0.25)) |
| Cancer type | miRNA id | miRNA accession | P-val. | Coeff. | # samples |
| LUAD | hsa-miR-98-5p | MIMAT0000096 | 0.046 | -0.26 | 60 |
| LUSC | hsa-let-7i-5p | MIMAT0000415 | 0.0015 | -0.28 | 128 |
| UCS | hsa-miR-30e-5p | MIMAT0000692 | 0.011 | -0.34 | 56 |
| Top |
| TissGeneMut for FAM104A |
| TissGeneSNV for FAM104A |
| nsSNV counts per each loci. Different colors of circles represent different cancer types. Circle size denotes number of samples. (TCGA somatic mutation (SNPs and small INDELs) data, version 2016-04-25) * Click on the image to enlarge it in a new window. |
 |
 |
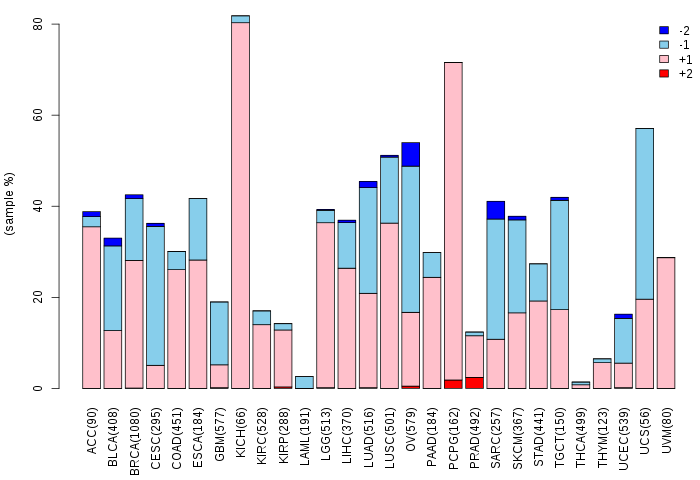
| Somatic nucleotide variants of TissGene across 28 cancer types (X-axis: cancer type and Y-axis: % of mutated samples) The numbers in parentheses are numbers of samples with mutation (nsSNVs). (TCGA somatic mutation (SNPs and small INDELs) data, version 2016-04-25) |
 |
| - nsSNVs sorted by frequency. |
| AAchange | Cancer type | # samples |
| p.E82K | SKCM | 1 |
| p.R70C | COAD | 1 |
| p.S198I | ACC | 1 |
| p.P98S | SKCM | 1 |
| p.A128V | LIHC | 1 |
| p.G9E | SKCM | 1 |
| p.Y20N | SKCM | 1 |
| p.G9R | SKCM | 1 |
| p.P88L | STAD | 1 |
| p.D7N | BLCA | 1 |
| p.S52F | DLBC | 1 |
| p.A125E | UCEC | 1 |
| p.G19E | PRAD | 1 |
| p.L53F | HNSC | 1 |
| p.S52C | CESC | 1 |
| p.G3V | STAD | 1 |
| p.L87I | LUAD | 1 |
| p.P51S | SKCM | 1 |
| Top |
| TissGeneCNV for FAM104A |
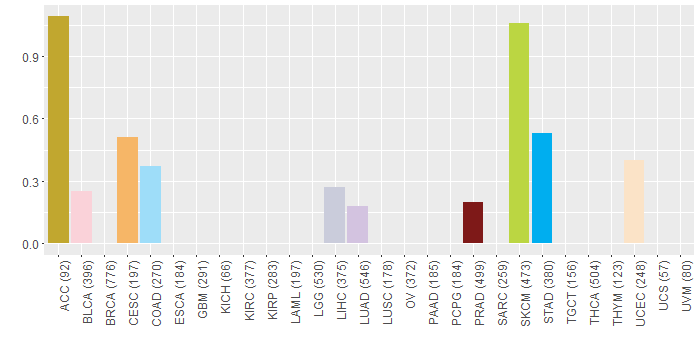
| Copy number variations of TissGene across 28 cancer types (X-axis: cancer type and Y-axis: % of CNV samples) (TCGA Gistic2_CopyNumber_Gistic2_all_data_by_genes, Gistic2 copy number data, version 2016-08-16) |
 |
| Top |
| TissGeneFusions for FAM104A |
| Fusion genes including TissGene (ChimerDB 3.0, 2016-12-01 and TCGA fusion Portal 2015-12-01) |
| Database | Src | Cancer type | Sample | Fusion gene | ORF | 5'-gene BP | 3'-gene BP |
| Chimerdb3.0 | ChiTaRs | NA | BX091521 | COG1-FAM104A | chr17:71202793 | chr17:71206904 | |
| Chimerdb3.0 | ChiTaRs | NA | BQ430227 | FAM104A-FXR2 | chr17:71228281 | chr17:7496359 | |
| Chimerdb3.0 | FusionScan | BRCA | TCGA-BH-A1FH-01A | FAM104A-SLC39A11 | In-Frame | chr17:71223303 | chr17:71027853 |
| Chimerdb3.0 | FusionScan | LUSC | TCGA-98-A53A-01A | FAM104A-CDC42EP4 | CDS-5'UTR | chr17:71228224 | chr17:71282751 |
| Chimerdb3.0 | TopHat-Fusion | STAD | TCGA-V5-A7RE-01A5 | COG1-FAM104A | CDS-3'UTR | chr17:71204552 | chr17:71205105 |
| Chimerdb3.0 | TopHat-Fusion | STAD | TCGA-LN-A5U7-01A1 | COG1-FAM104A | CDS-3'UTR | chr17:71204236 | chr17:71205402 |
| Chimerdb3.0 | TopHat-Fusion | STAD | TCGA-V5-AASX-11A8 | COG1-FAM104A | CDS-3'UTR | chr17:71204428 | chr17:71204923 |
| Chimerdb3.0 | TopHat-Fusion | STAD | TCGA-V5-A7RE-11A7 | COG1-FAM104A | CDS-3'UTR | chr17:71204541 | chr17:71204941 |
| Chimerdb3.0 | TopHat-Fusion | LGG | TCGA-TQ-A7RU-01A | COG1-FAM104A | CDS-3'UTR | chr17:71204440 | chr17:71204652 |
| Chimerdb3.0 | TopHat-Fusion | CESC | TCGA-C5-A3HL-01A | COG1-FAM104A | CDS-3'UTR | chr17:71204433 | chr17:71204658 |
| Chimerdb3.0 | TopHat-Fusion | CESC | TCGA-VS-A8EH-01A | COG1-FAM104A | CDS-3'UTR | chr17:71204433 | chr17:71204651 |
| Chimerdb3.0 | TopHat-Fusion | CESC | TCGA-DS-A0VL-01A | COG1-FAM104A | CDS-3'UTR | chr17:71204433 | chr17:71204661 |
| Chimerdb3.0 | TopHat-Fusion | CESC | TCGA-C5-A2M1-01A | COG1-FAM104A | CDS-3'UTR | chr17:71204441 | chr17:71205538 |
| Chimerdb3.0 | TopHat-Fusion | UCEC | TCGA-BG-A3EW-01A | COG1-FAM104A | CDS-3'UTR | chr17:71204433 | chr17:71204651 |
| Chimerdb3.0 | TopHat-Fusion | UVM | TCGA-V4-A9F1-01A | COG1-FAM104A | CDS-3'UTR | chr17:71204436 | chr17:71204650 |
| Chimerdb3.0 | TopHat-Fusion | PRAD | TCGA-EJ-5499-01A | COG1-FAM104A | CDS-3'UTR | chr17:71204425 | chr17:71204654 |
| Chimerdb3.0 | TopHat-Fusion | HNSC | TCGA-MT-A51W-01A | COG1-FAM104A | CDS-3'UTR | chr17:71204361 | chr17:71204671 |
| Chimerdb3.0 | TopHat-Fusion | BRCA | TCGA-AO-A03T-01A | COG1-FAM104A | CDS-3'UTR | chr17:71204423 | chr17:71204652 |
| Chimerdb3.0 | TopHat-Fusion | BRCA | TCGA-A2-A0SX-01A | COG1-FAM104A | CDS-3'UTR | chr17:71204055 | chr17:71204721 |
| Chimerdb3.0 | TopHat-Fusion | BRCA | TCGA-D8-A1JP-01A | COG1-FAM104A | CDS-3'UTR | chr17:71204420 | chr17:71204655 |
| TCGAfusionPortal | PRADA | BRCA | TCGA-EW-A1PA-01A | TMC6-FAM104A | 5UTR-CDS | Chr17:76124693 | Chr17:71205907 |
| Top |
| TissGeneNet for FAM104A |
| Co-expressed gene networks based on protein-protein interaction data (CePIN) (TCGA IlluminaHiSeq_RNASeqV2, pan-cancer normalized log2(norm_counts+1) data, version 2016-08-16) (PINA2 ppi data) |
| Top |
| TissGeneProg for FAM104A |
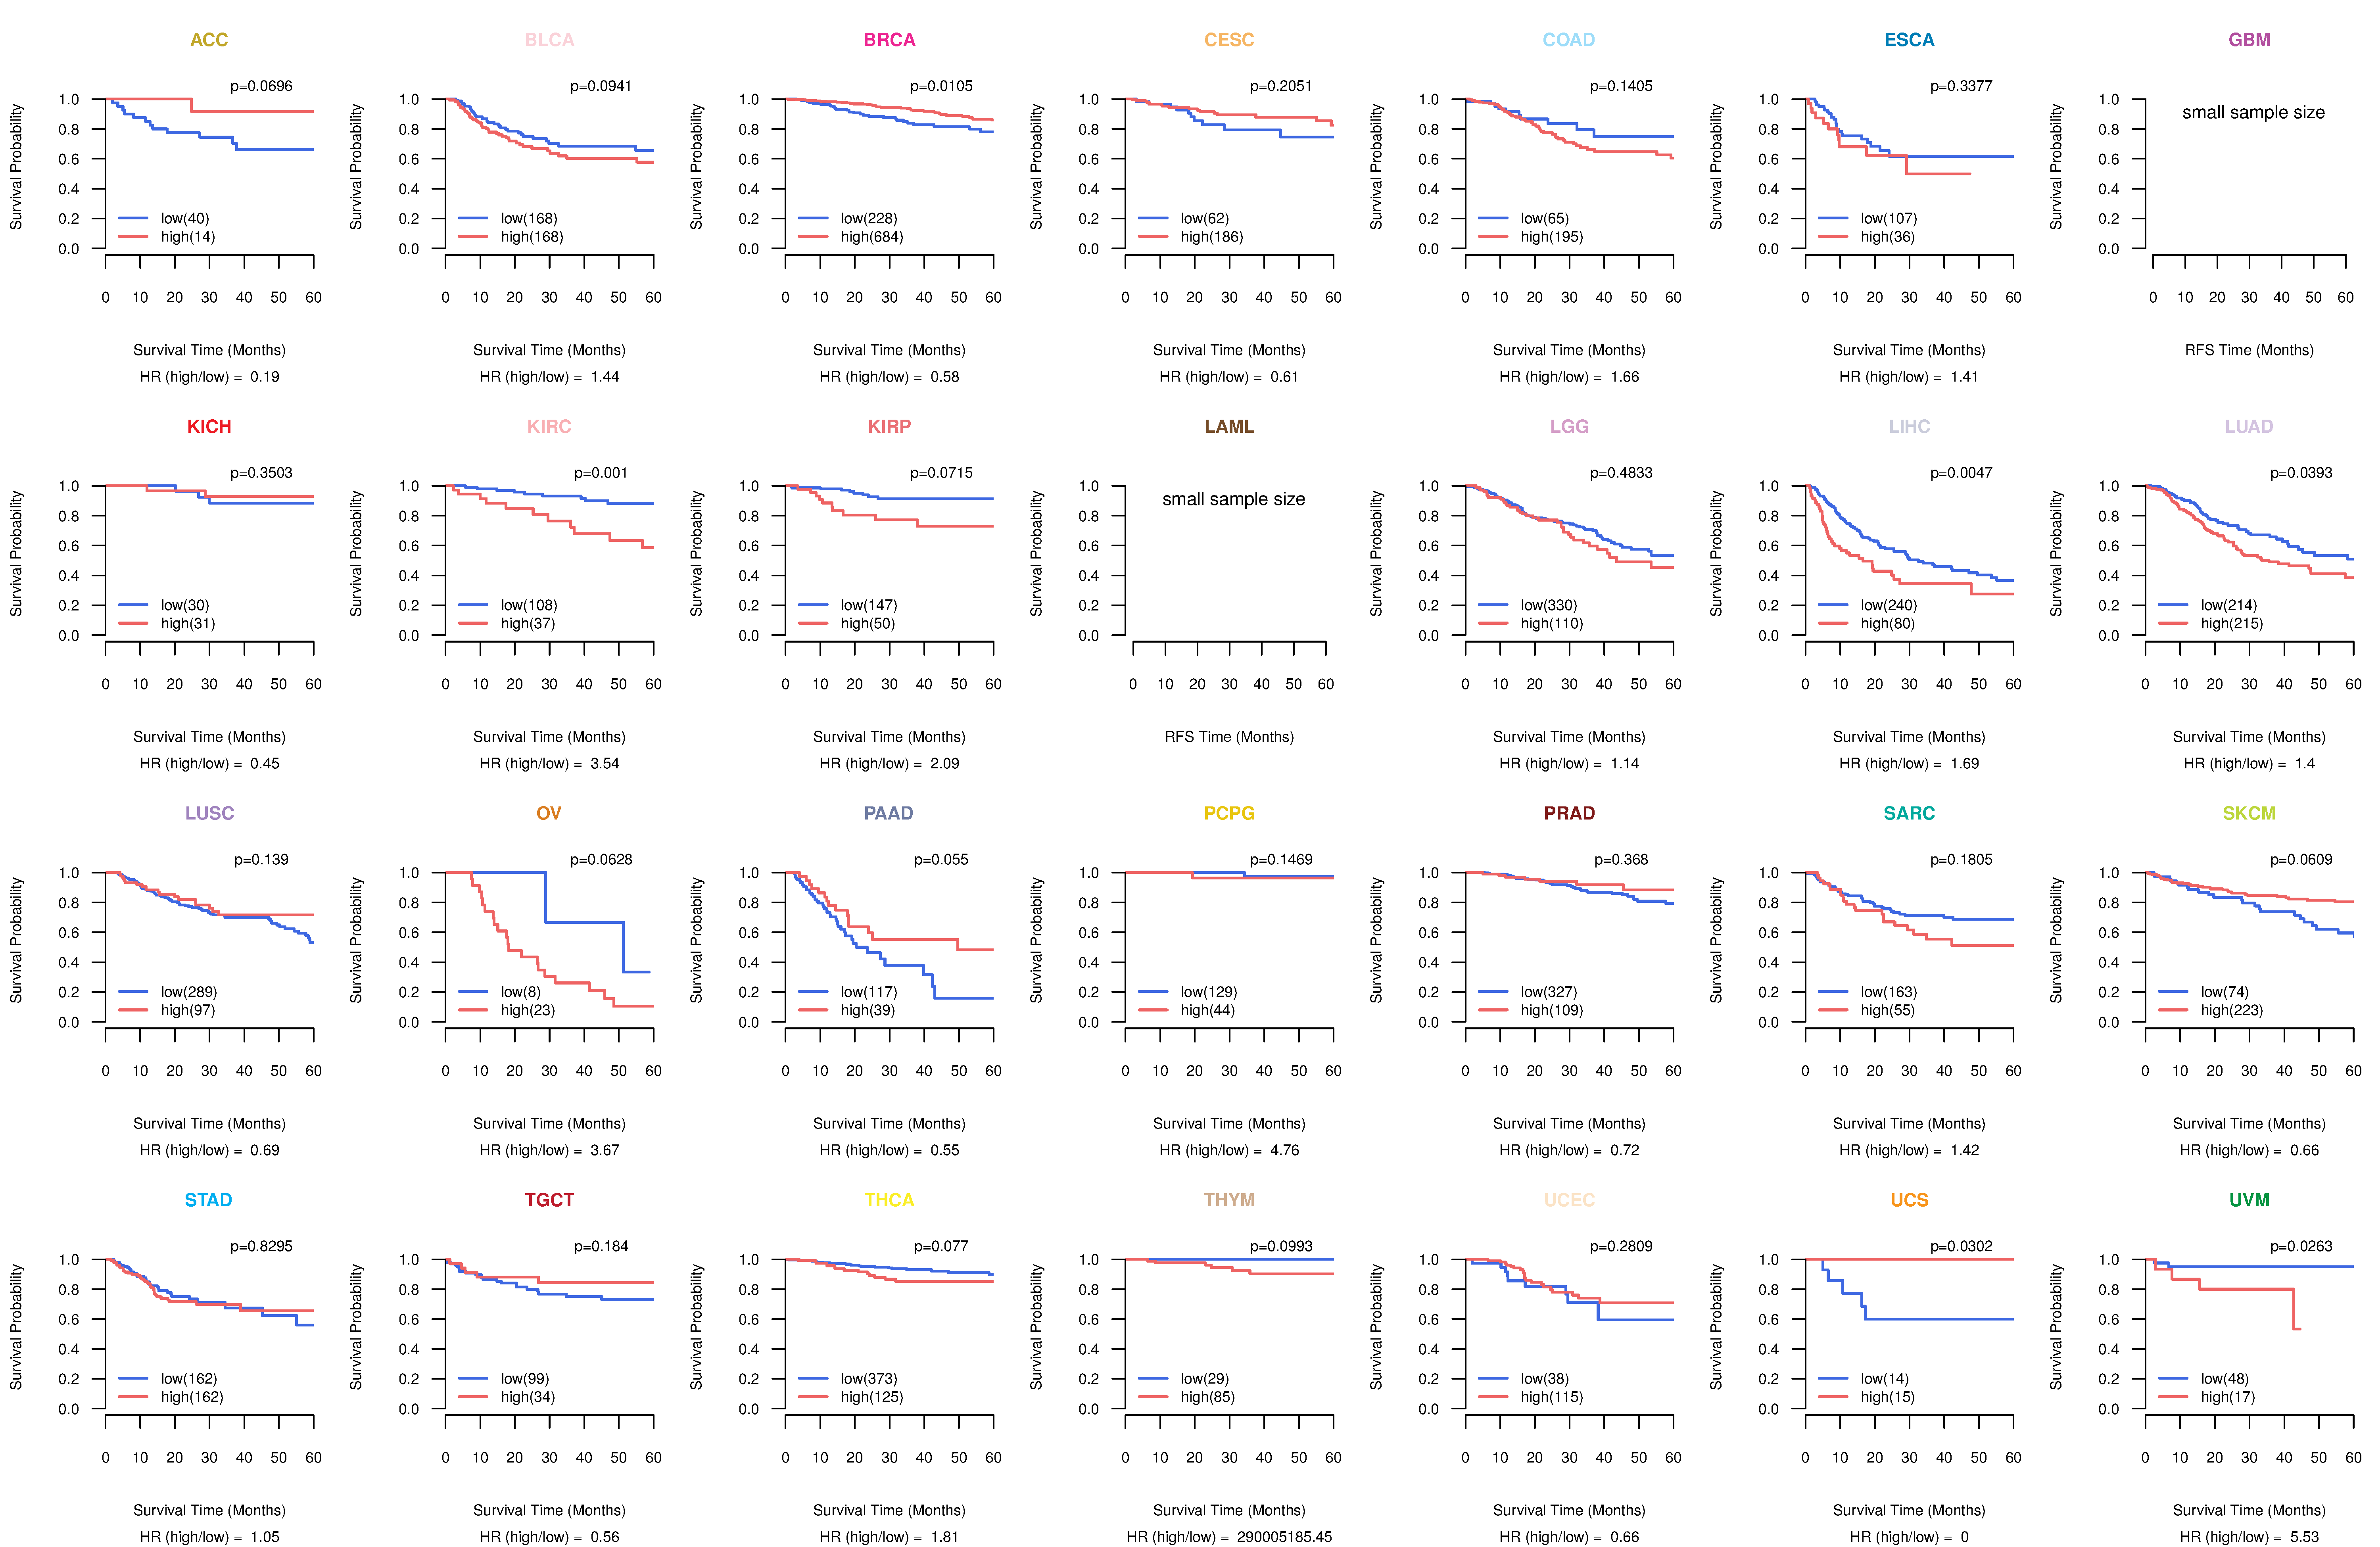
| Kaplan-Meier plots with logrank tests of overall survival (OS) using 28 cancer types (TCGA IlluminaHiSeq_RNASeqV2, pan-cancer normalized log2(norm_counts+1) data, version 2016-08-16) (TCGA clinicalMatrix, phenotype data, version 2016-04-27) * Click on the image to enlarge it in a new window. |
 |
| Kaplan-Meier plots with logrank test of relapse free survival (RFS) using 28 cancer types (TCGA IlluminaHiSeq_RNASeqV2, pan-cancer normalized log2(norm_counts+1) data, version 2016-08-16) (TCGA clinicalMatrix, phenotype data, version 2016-04-27) * Click on the image enlarge it in a new window. |
 |
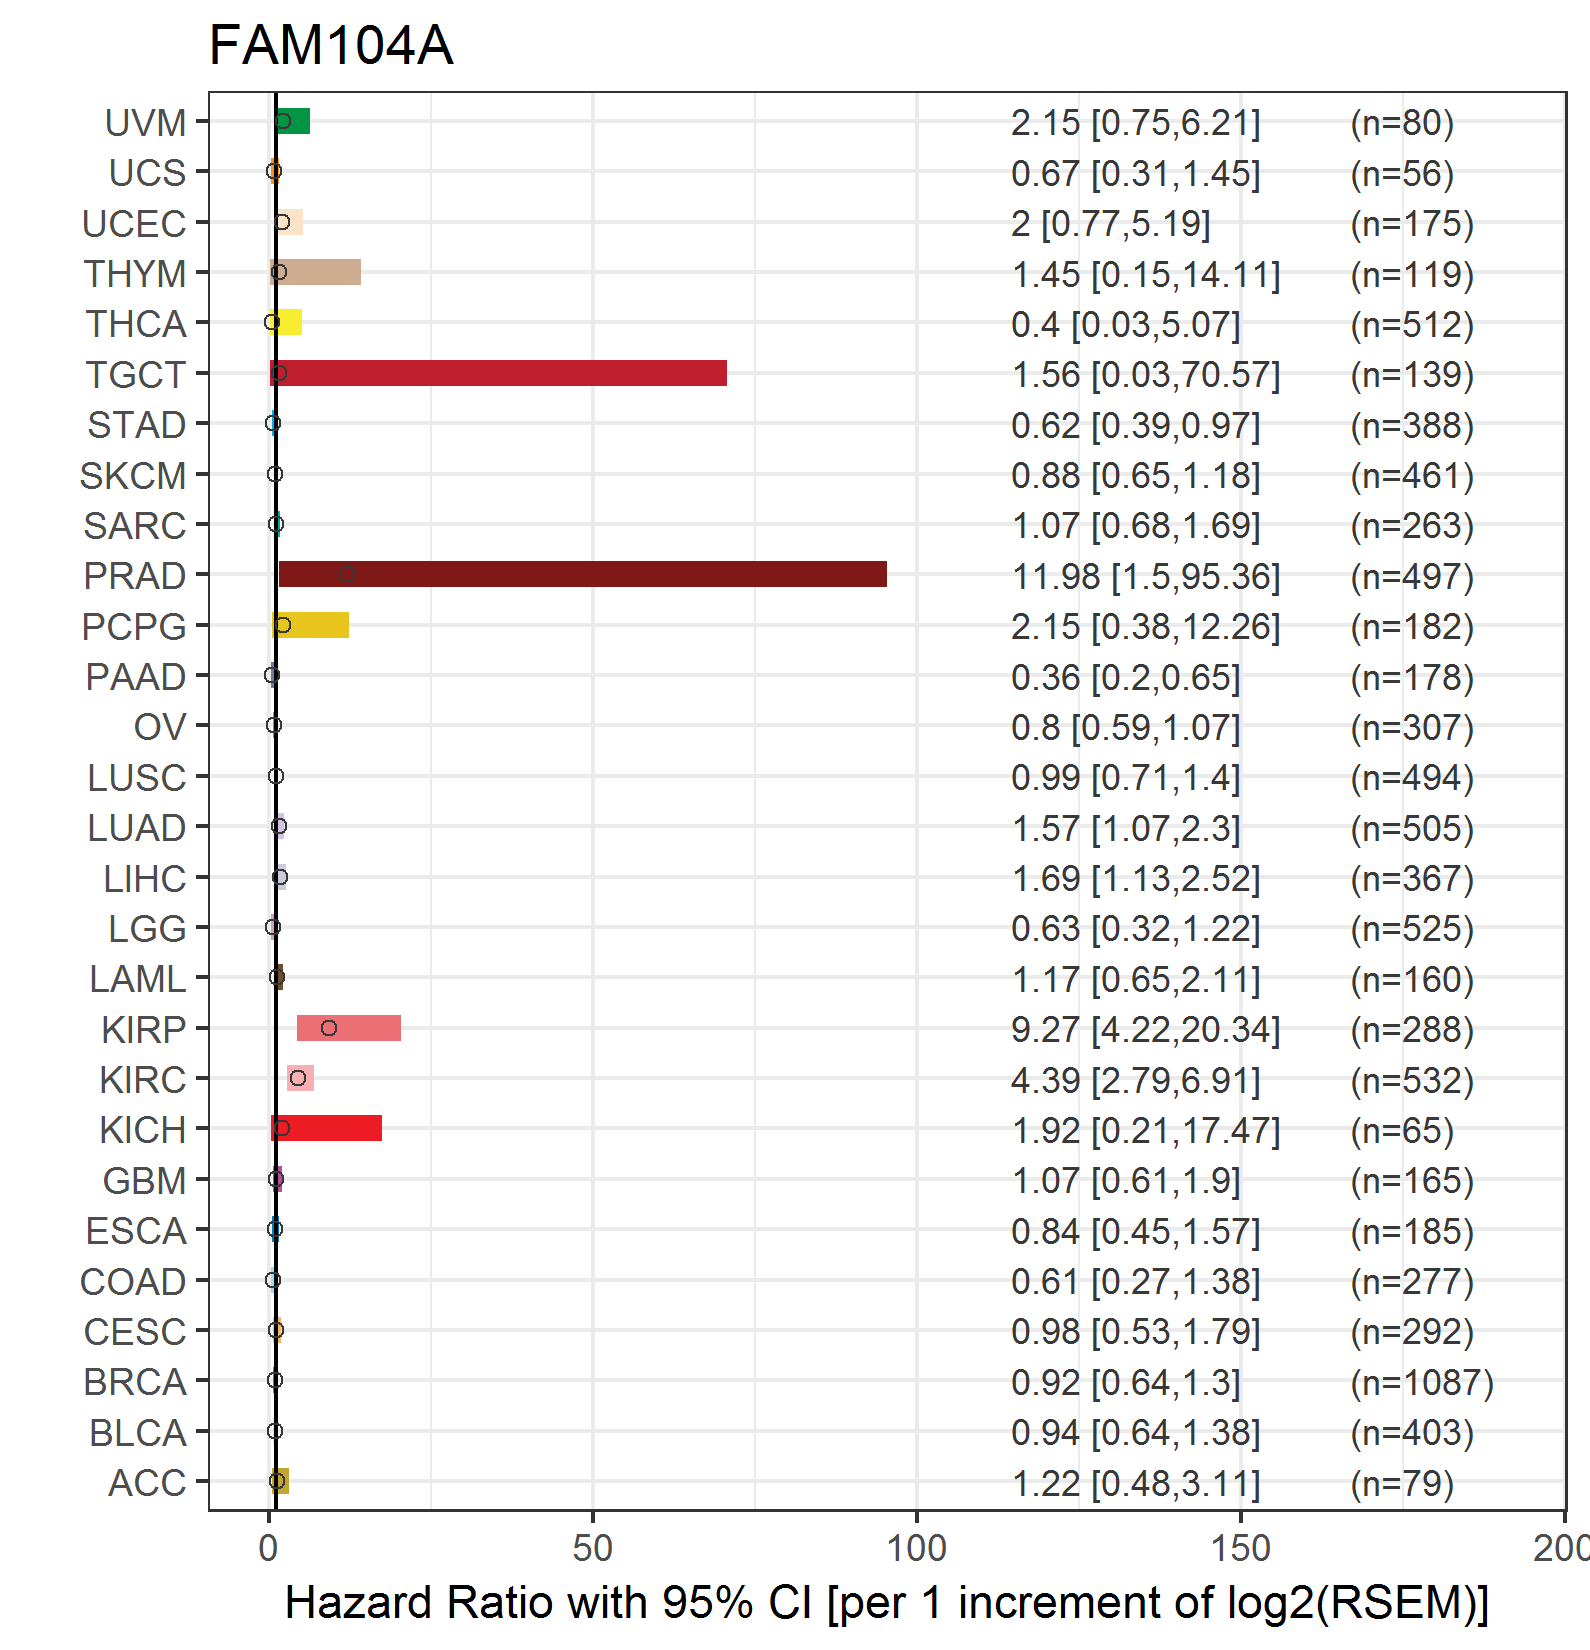
| Forest plot of Cox proportional hazard ratio (HR) and 95% CI of overall survival (OS) using 28 cancer types (TCGA IlluminaHiSeq_RNASeqV2, pan-cancer normalized log2(norm_counts+1) data, version 2016-08-16) (TCGA clinicalMatrix, phenotype data, version 2016-04-27) * Click on the image enlarge it in a new window. |
 |
| Forest plot of Cox proportional hazard ratio (HR) and 95% CI of relapse free survival (RFS) using 28 cancer types (TCGA IlluminaHiSeq_RNASeqV2, pan-cancer normalized log2(norm_counts+1) data, version 2016-08-16) (TCGA clinicalMatrix, phenotype data, version 2016-04-27) * Click on the image enlarge it in a new window. |
 |
| Top |
| TissGeneClin for FAM104A |
| TissGeneDrug for FAM104A |
| Drug information targeting TissGene (DrugBank Version 5.0.6, 2017-04-01) |
| DrugBank ID | Drug name | Drug activity | Drug type | Drug status |
| Top |
| TissGeneDisease for FAM104A |
| Disease information associated with TissGene (DisGeNet, 2016-06-01) |
| Disease ID | Disease name | # pubmeds | Source |
|
Copyright 2016-Present - The University of Texas Health Science Center at Houston (UTHealth) Web File Viewing | How to Report, Fraud, Waste and Abuse | State of Texas | Statewide Search | Texas Homeland Security | Site Policies |