 |
| |
| |
| |
| |
| |
| |
|

| TissGeneSummary for ATG4D |
 Gene summary Gene summary |
| Basic gene information | Gene symbol | ATG4D |
| Gene name | autophagy related 4D, cysteine peptidase | |
| Synonyms | APG4-D|APG4D|AUTL4 | |
| Cytomap | UCSC genome browser: 19p13.2 | |
| Type of gene | protein-coding | |
| RefGenes | NM_001281504.1, NM_032885.5,NR_104024.1,NR_104025.1, | |
| Description | APG4 autophagy 4 homolog DATG4 autophagy related 4 homolog DAUT-like 4 cysteine endopeptidaseautophagin-4autophagy-related cysteine endopeptidase 4autophagy-related protein 4 homolog Dcysteine protease ATG4Dcysteine protease involved in autophagy | |
| Modification date | 20141207 | |
| dbXrefs | MIM : 611340 | |
| HGNC : HGNC | ||
| Ensembl : ENSG00000130734 | ||
| HPRD : 07005 | ||
| Vega : OTTHUMG00000180582 | ||
| Protein | UniProt: go to UniProt's Cross Reference DB Table | |
| Expression | CleanEX: HS_ATG4D | |
| BioGPS: 84971 | ||
| Pathway | NCI Pathway Interaction Database: ATG4D | |
| KEGG: ATG4D | ||
| REACTOME: ATG4D | ||
| Pathway Commons: ATG4D | ||
| Context | iHOP: ATG4D | |
| ligand binding site mutation search in PubMed: ATG4D | ||
| UCL Cancer Institute: ATG4D | ||
| Assigned class in TissGDB* | C | |
| Included tissue-specific gene expression resources | TiGER,GTEx | |
| Specific-tissues in normal samples (assigned by TissGDB using HPA, TiGER, and GTEx) | PancreasTestis | |
| Cancer types related to the specific-tissues in cancer samples (assigned by TissGDB using TCGA) | PAADTGCT | |
| Reference showing the relevant tissue of ATG4D | ||
| Description by TissGene annotations | Have significant anti-correlated miRNA TissgsLTS | |
| * Class A consists of genes with literature evidence and is part of the cTissGenes. Class B consists of only cTissGenes without additional evidence. The remaining genes belong to Class C. |
| Gene ontology having evidence of Inferred from Direct Assay (IDA) from Entrez |
| GO ID | GO term | PubMed ID |
| Top |
| TissGeneExp for ATG4D |
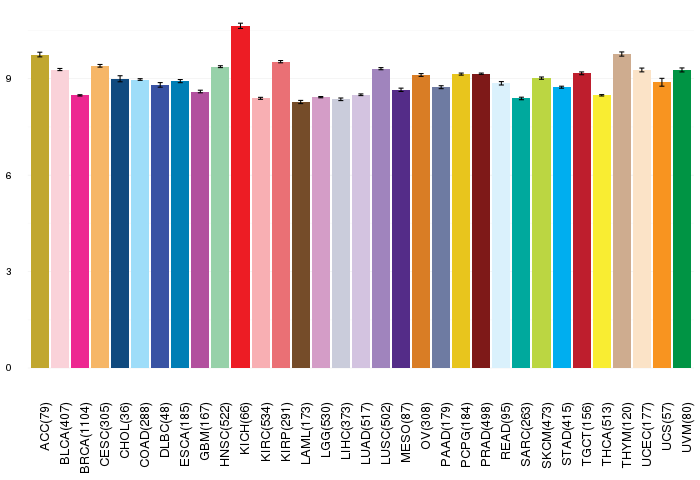
| Gene expressions across 28 cancer types (X-axis: cancer type and Y-axis: log2(norm_counts+1)) (TCGA IlluminaHiSeq_RNASeqV2, pan-cancer normalized log2(norm_counts+1) data, version 2016-08-16) |
 |
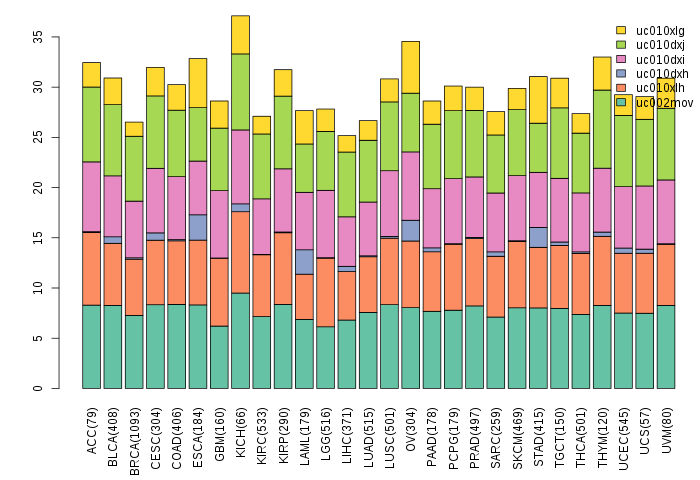
| Gene isoform expressions across 28 cancer types (X-axis: cancer type and Y-axis: log2(norm_counts+1)) (TCGA pan-cancer tcga_rsem_isoform_tpm, version 2016-09-01) |
 |
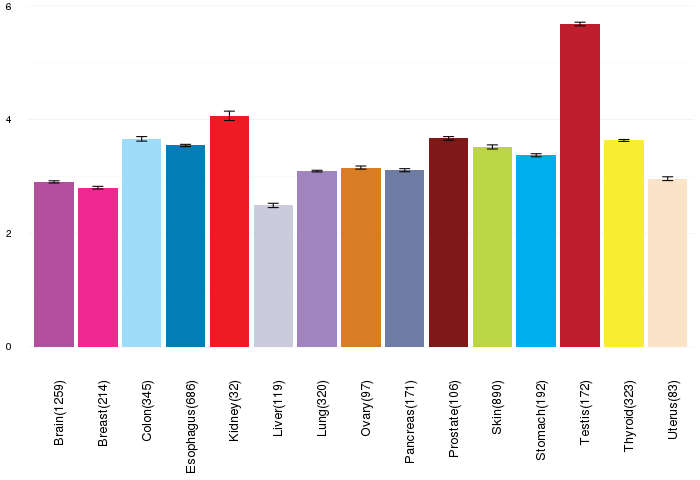
| Gene expressions across normal tissues of GTEx data (GTEx GTEx_Analysis_v6_RNA-seq_RNA-SeQCv1.1.8_gene_rpkm.gct) - Here, we shows the matched tissue types only among our 28 cancer types. |
 |
| Different expressions across 14 cancer types with more than 10 samples between matched tumors and normals (X-axis: cancer type and Y-axis: log2(norm_counts+1)) (TCGA IlluminaHiSeq_RNASeqV2, pan-cancer normalized log2(norm_counts+1) data, version 2016-08-16) |
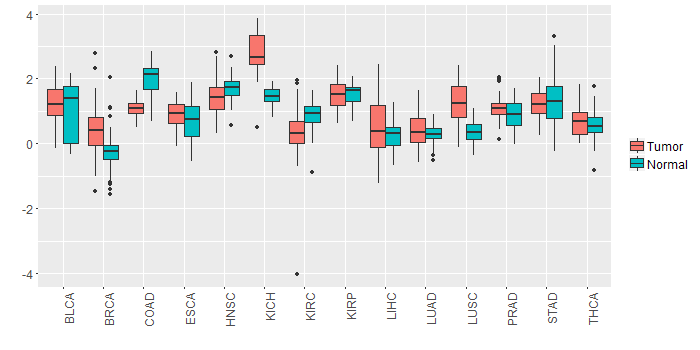 |
| - Significantly differentially expressed cancer types and information. (|Fold change|>1 and FDR<0.05) |
| Cancer type | Mean(exp) in tumor | Mean(exp) in matched normal | Log2FC | P-val. | FDR |
| KICH | 2.737746277 | 1.447650277 | 1.290096 | 1.91E-09 | 1.14E-08 |
| Top |
| TissGene-miRNA for ATG4D |
| Significantly anti-correlated miRNAs of TissGene across 28 cancer types (Gene-miRNA relations from TargetScanHuman Relsease 7.1, Conserved_Site_Context_Scores.txt.zip, 06.01.2016) (TCGA IlluminaHiSeq_miRNASeq, log2(RPM+1) data, version 2016-11-21) (TCGA IlluminaHiSeq_RNASeqV2, log2(normalized_count+1) data, version 2016-08-16) (Spearman’s Rank Correlation (p-value<0.05 and coefficient<-0.25)) |
| Cancer type | miRNA id | miRNA accession | P-val. | Coeff. | # samples |
| LUAD | hsa-miR-125a-5p | MIMAT0000443 | 0.035 | -0.28 | 60 |
| UCS | hsa-miR-152-3p | MIMAT0000438 | 0.032 | -0.29 | 56 |
| UCS | hsa-miR-130b-3p | MIMAT0000691 | 0.014 | -0.33 | 56 |
| LUAD | hsa-miR-139-5p | MIMAT0000250 | 0.0011 | -0.42 | 60 |
| Top |
| TissGeneMut for ATG4D |
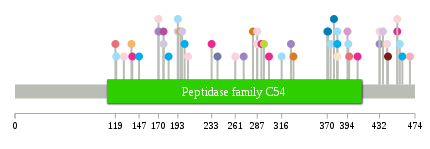
| TissGeneSNV for ATG4D |
| nsSNV counts per each loci. Different colors of circles represent different cancer types. Circle size denotes number of samples. (TCGA somatic mutation (SNPs and small INDELs) data, version 2016-04-25) * Click on the image to enlarge it in a new window. |
 |
 |
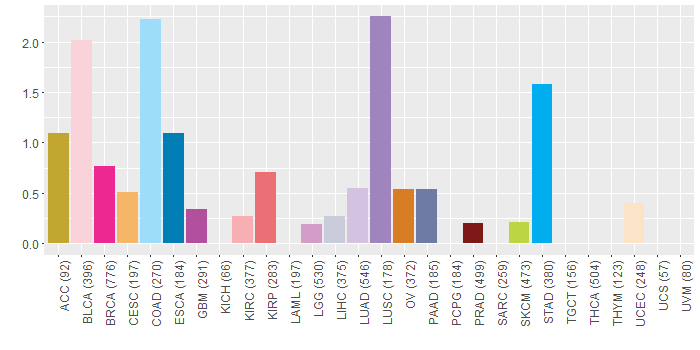
| Somatic nucleotide variants of TissGene across 28 cancer types (X-axis: cancer type and Y-axis: % of mutated samples) The numbers in parentheses are numbers of samples with mutation (nsSNVs). (TCGA somatic mutation (SNPs and small INDELs) data, version 2016-04-25) |
 |
| - nsSNVs sorted by frequency. |
| AAchange | Cancer type | # samples |
| p.V271L | LUSC | 1 |
| p.D370N | STAD | 1 |
| p.S138W | HNSC | 1 |
| p.D442G | PRAD | 1 |
| p.E170K | LUSC | 1 |
| p.L287Q | BLCA | 1 |
| p.R382C | COAD | 1 |
| p.R147P | STAD | 1 |
| p.Q201* | STAD | 1 |
| p.R193C | COAD | 1 |
| p.C378Y | ESCA | 1 |
| p.E296K | READ | 1 |
| p.R453W | BRCA | 1 |
| p.S468Y | KIRC | 1 |
| p.A282T | OV | 1 |
| p.E170K | BLCA | 1 |
| p.P129L | BLCA | 1 |
| p.R424W | HNSC | 1 |
| p.R382H | UCEC | 1 |
| p.E205K | BLCA | 1 |
| p.F371S | ESCA | 1 |
| p.E432K | HNSC | 1 |
| p.L96F | READ | 1 |
| p.E406D | BRCA | 1 |
| p.G240D | PAAD | 1 |
| p.C327R | LUSC | 1 |
| p.V395M | COAD | 1 |
| p.E432K | BLCA | 1 |
| p.V233G | BRCA | 1 |
| p.R456H | COAD | 1 |
| p.T394A | LGG | 1 |
| p.G396D | KIRP | 1 |
| p.S138L | CESC | 1 |
| p.P176S | LIHC | 1 |
| p.V316M | COAD | 1 |
| p.L287V | BLCA | 1 |
| p.R382C | STAD | 1 |
| p.C330W | OV | 1 |
| p.L120R | COAD | 1 |
| p.P196S | ACC | 1 |
| p.D139E | BRCA | 1 |
| p.V301G | BRCA | 1 |
| p.P176L | GBM | 1 |
| p.E261D | BLCA | 1 |
| p.D292V | BRCA | 1 |
| p.A295V | SKCM | 1 |
| p.E432K | LUSC | 1 |
| p.R193S | CHOL | 1 |
| p.S182L | STAD | 1 |
| p.R453W | BLCA | 1 |
| p.R193C | LUAD | 1 |
| p.R459W | STAD | 1 |
| p.Q436E | LUAD | 1 |
| p.E170K | HNSC | 1 |
| p.E374D | COAD | 1 |
| p.D441Y | BLCA | 1 |
| p.R198P | LUAD | 1 |
| p.R119S | KIRP | 1 |
| Top |
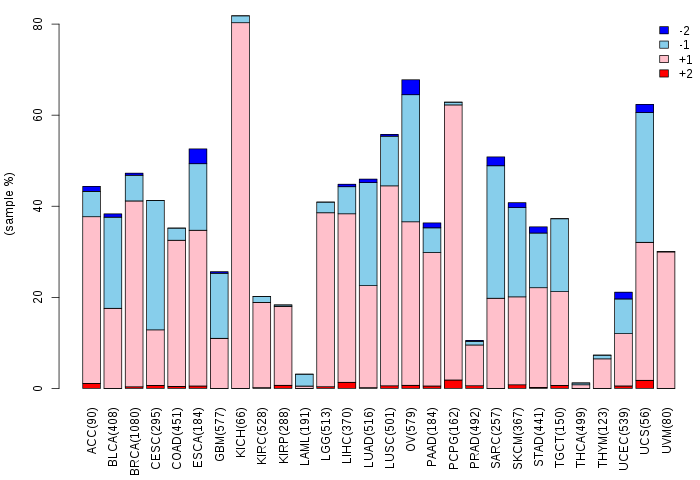
| TissGeneCNV for ATG4D |
| Copy number variations of TissGene across 28 cancer types (X-axis: cancer type and Y-axis: % of CNV samples) (TCGA Gistic2_CopyNumber_Gistic2_all_data_by_genes, Gistic2 copy number data, version 2016-08-16) |
 |
| Top |
| TissGeneFusions for ATG4D |
| Fusion genes including TissGene (ChimerDB 3.0, 2016-12-01 and TCGA fusion Portal 2015-12-01) |
| Database | Src | Cancer type | Sample | Fusion gene | ORF | 5'-gene BP | 3'-gene BP |
| Chimerdb3.0 | ChiTaRs | NA | BG393063 | ATG4D-C4orf22 | chr19:10664013 | chr4:81455000 | |
| Chimerdb3.0 | TopHat-Fusion | LUSC | TCGA-66-2766-01A | S1PR5-ATG4D | 3'UTR-CDS | chr19:10624169 | chr19:10655805 |
| TCGAfusionPortal | PRADA | OV | TCGA-13-1407-01A | ATG4D-UHRF1 | Out-of-frame | Chr19:10655001 | Chr19:4929234 |
| Top |
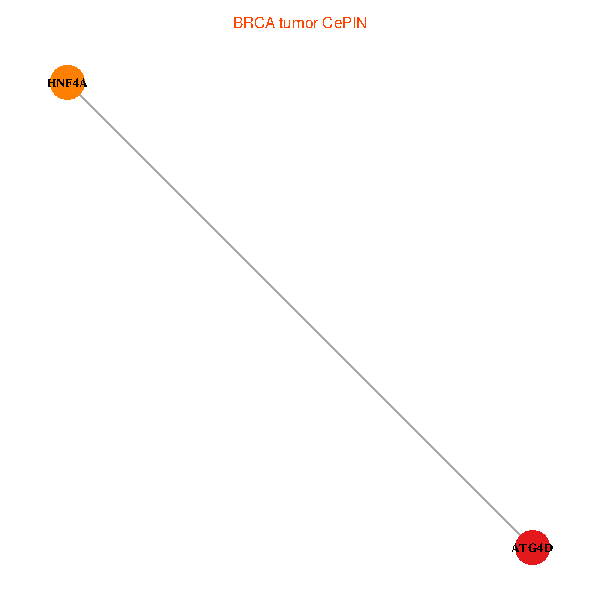
| TissGeneNet for ATG4D |
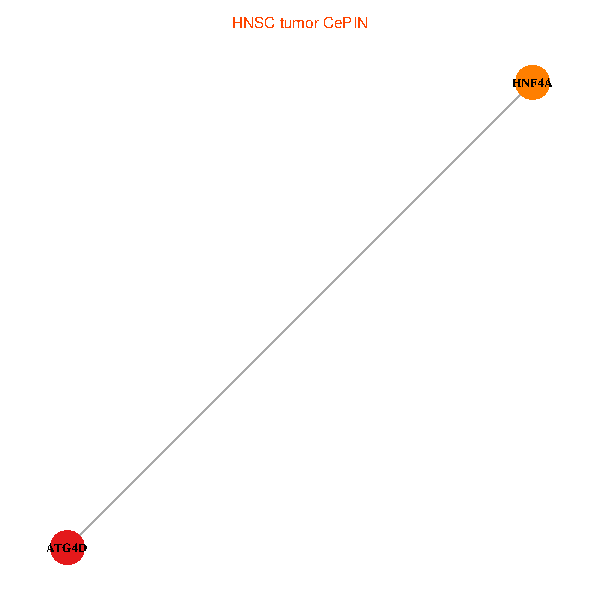
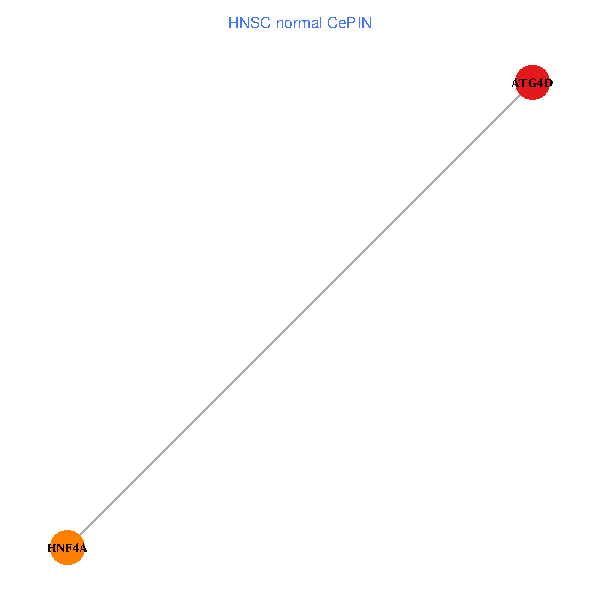
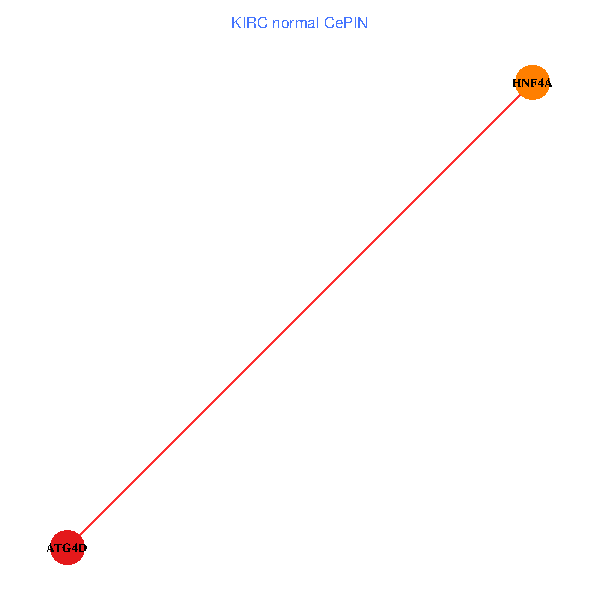
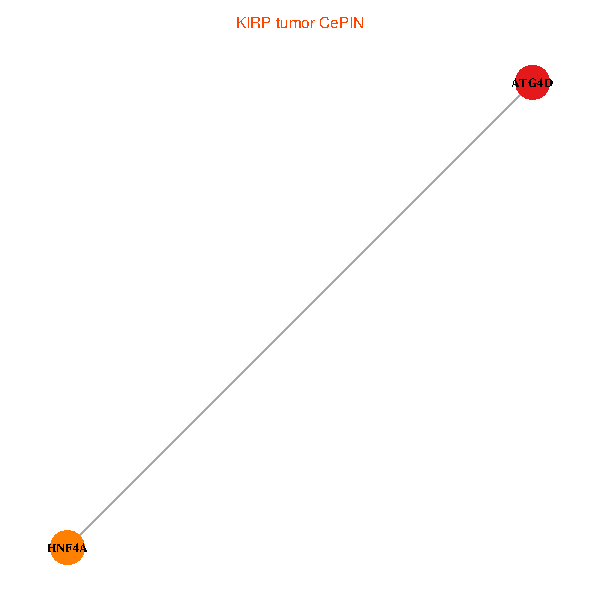
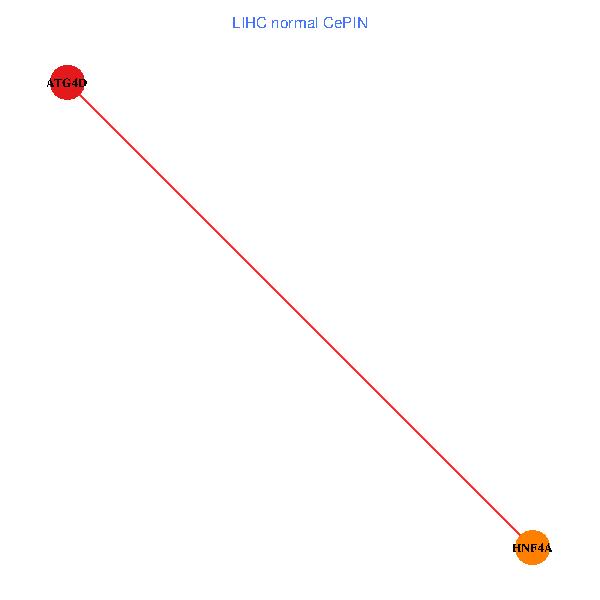
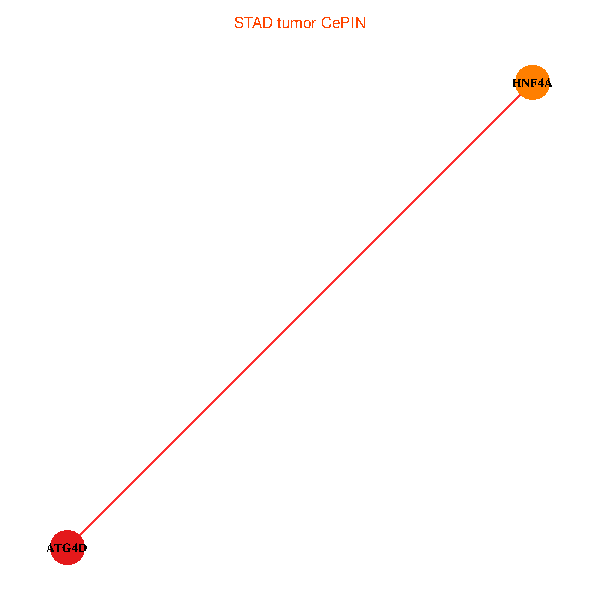
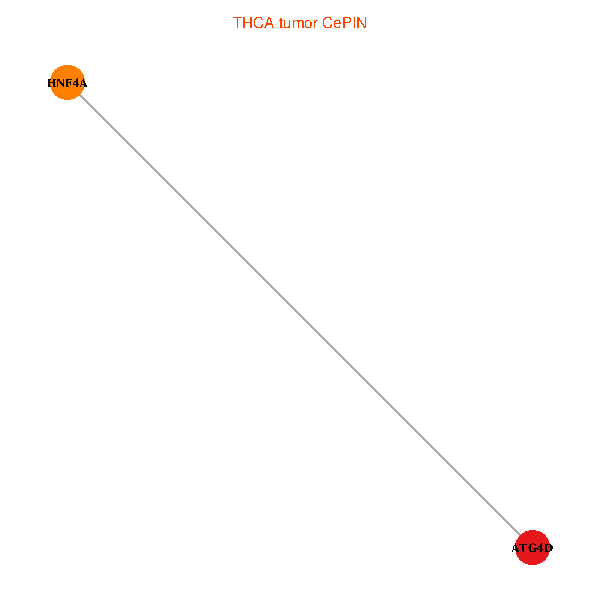
| Co-expressed gene networks based on protein-protein interaction data (CePIN) (TCGA IlluminaHiSeq_RNASeqV2, pan-cancer normalized log2(norm_counts+1) data, version 2016-08-16) (PINA2 ppi data) |
| BRCA (tumor) | BRCA (normal) |
| ATG4D, HNF4A (tumor) | ATG4D, HNF4A (normal) |
 |  |
| COAD (tumor) | COAD (normal) |
| ATG4D, HNF4A (tumor) | ATG4D, HNF4A (normal) |
 |  |
| HNSC (tumor) | HNSC (normal) |
| ATG4D, HNF4A (tumor) | ATG4D, HNF4A (normal) |
 |  |
| KICH (tumor) | KICH (normal) |
| ATG4D, HNF4A (tumor) | ATG4D, HNF4A (normal) |
 |  |
| KIRC (tumor) | KIRC (normal) |
| ATG4D, HNF4A (tumor) | ATG4D, HNF4A (normal) |
 |  |
| KIRP (tumor) | KIRP (normal) |
| ATG4D, HNF4A (tumor) | ATG4D, HNF4A (normal) |
 |  |
| LIHC (tumor) | LIHC (normal) |
| ATG4D, HNF4A (tumor) | ATG4D, HNF4A (normal) |
 |  |
| LUAD (tumor) | LUAD (normal) |
| ATG4D, HNF4A (tumor) | ATG4D, HNF4A (normal) |
 |  |
| LUSC (tumor) | LUSC (normal) |
| ATG4D, HNF4A (tumor) | ATG4D, HNF4A (normal) |
 |  |
| PRAD (tumor) | PRAD (normal) |
| ATG4D, HNF4A (tumor) | ATG4D, HNF4A (normal) |
 |  |
| STAD (tumor) | STAD (normal) |
| ATG4D, HNF4A (tumor) | ATG4D, HNF4A (normal) |
 |  |
| THCA (tumor) | THCA (normal) |
| ATG4D, HNF4A (tumor) | ATG4D, HNF4A (normal) |
 |  |
| Top |
| TissGeneProg for ATG4D |
| Kaplan-Meier plots with logrank tests of overall survival (OS) using 28 cancer types (TCGA IlluminaHiSeq_RNASeqV2, pan-cancer normalized log2(norm_counts+1) data, version 2016-08-16) (TCGA clinicalMatrix, phenotype data, version 2016-04-27) * Click on the image to enlarge it in a new window. |
 |
| Kaplan-Meier plots with logrank test of relapse free survival (RFS) using 28 cancer types (TCGA IlluminaHiSeq_RNASeqV2, pan-cancer normalized log2(norm_counts+1) data, version 2016-08-16) (TCGA clinicalMatrix, phenotype data, version 2016-04-27) * Click on the image enlarge it in a new window. |
 |
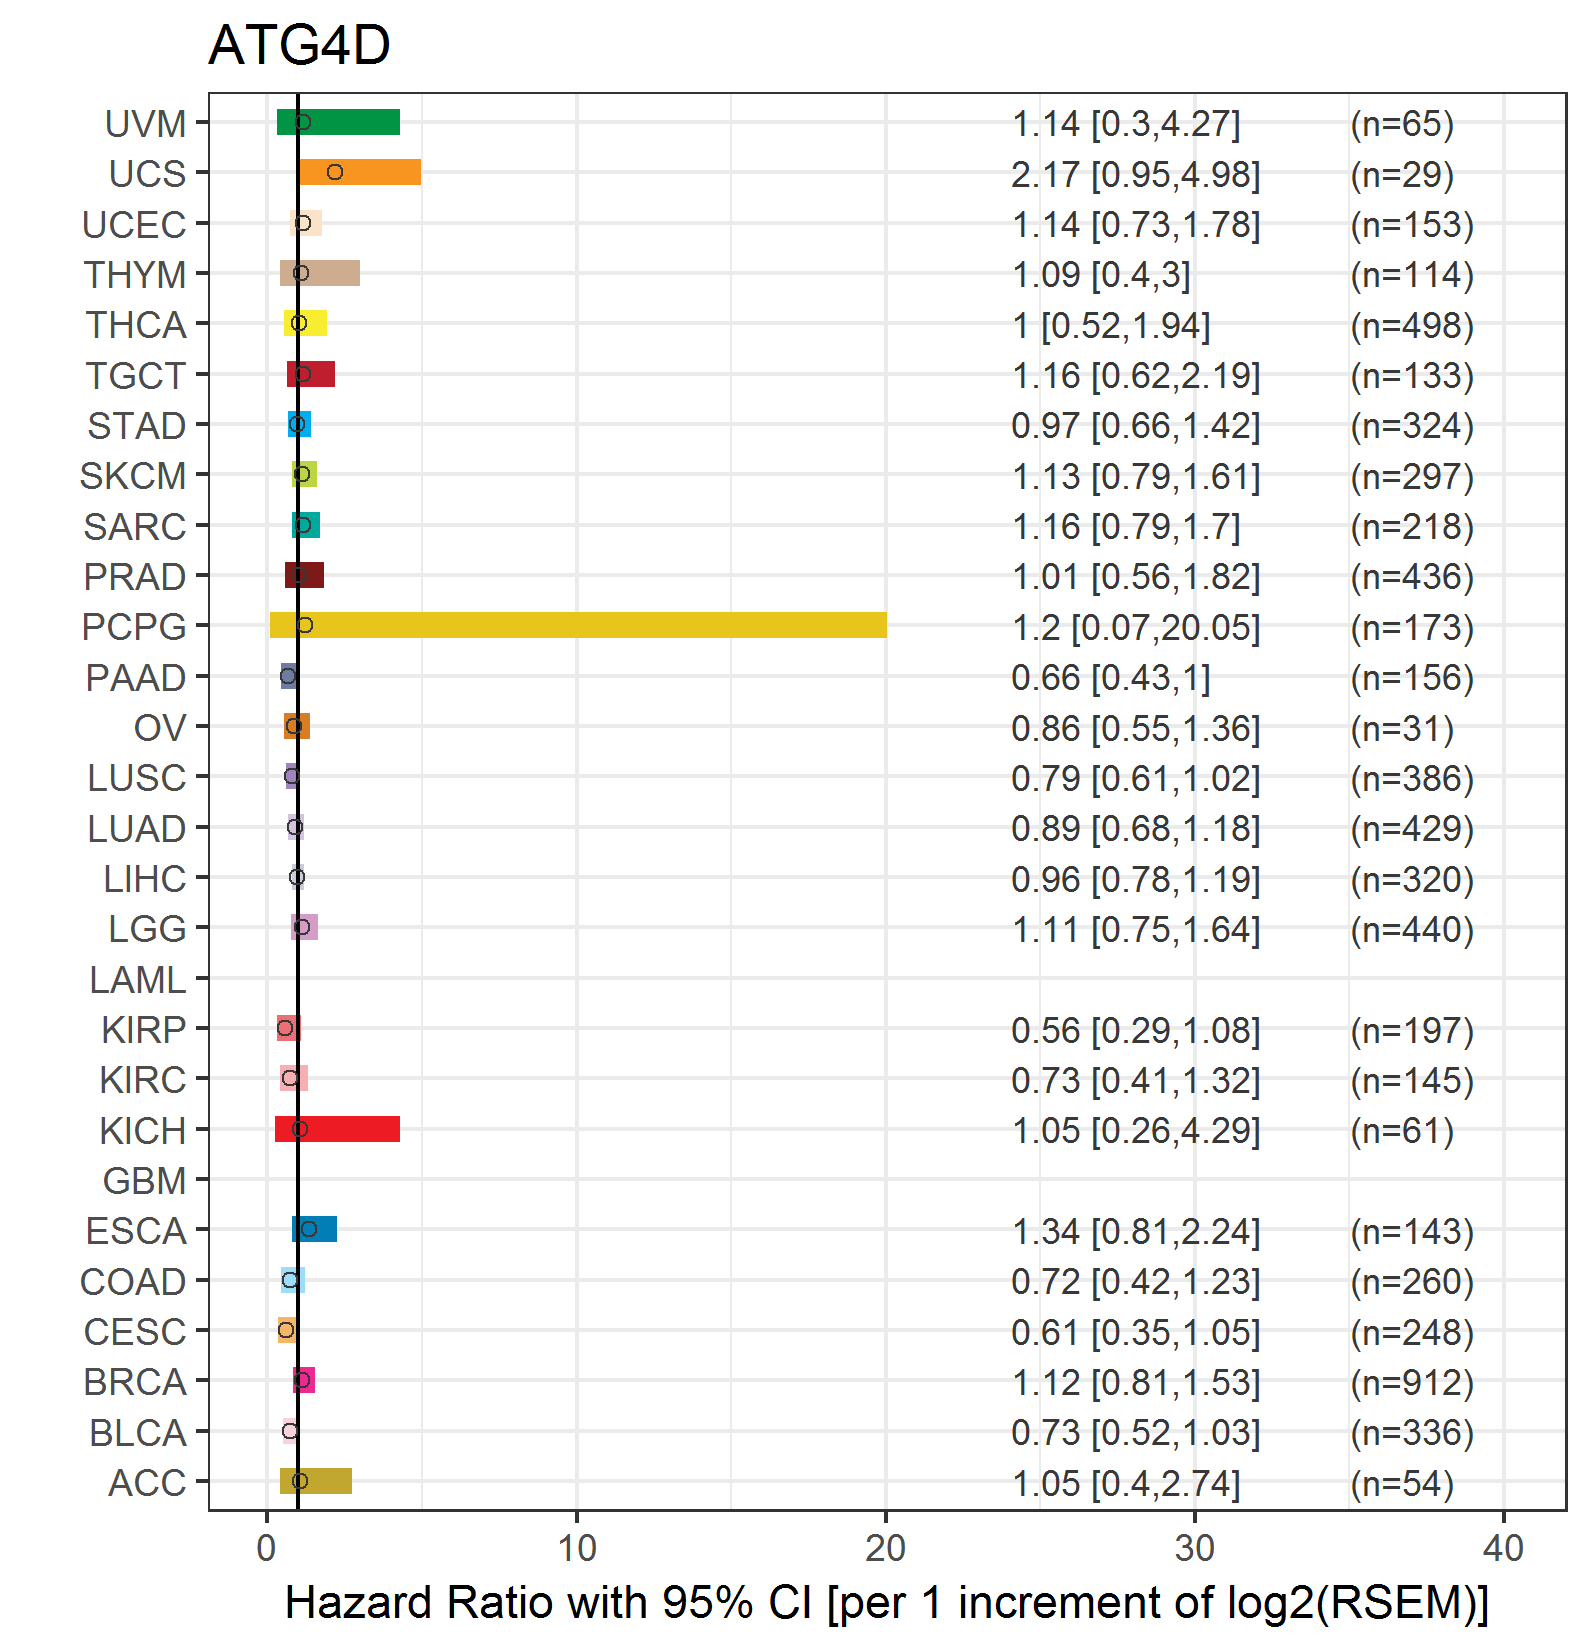
| Forest plot of Cox proportional hazard ratio (HR) and 95% CI of overall survival (OS) using 28 cancer types (TCGA IlluminaHiSeq_RNASeqV2, pan-cancer normalized log2(norm_counts+1) data, version 2016-08-16) (TCGA clinicalMatrix, phenotype data, version 2016-04-27) * Click on the image enlarge it in a new window. |
 |
| Forest plot of Cox proportional hazard ratio (HR) and 95% CI of relapse free survival (RFS) using 28 cancer types (TCGA IlluminaHiSeq_RNASeqV2, pan-cancer normalized log2(norm_counts+1) data, version 2016-08-16) (TCGA clinicalMatrix, phenotype data, version 2016-04-27) * Click on the image enlarge it in a new window. |
 |
| Top |
| TissGeneClin for ATG4D |
| TissGeneDrug for ATG4D |
| Drug information targeting TissGene (DrugBank Version 5.0.6, 2017-04-01) |
| DrugBank ID | Drug name | Drug activity | Drug type | Drug status |
| Top |
| TissGeneDisease for ATG4D |
| Disease information associated with TissGene (DisGeNet, 2016-06-01) |
| Disease ID | Disease name | # pubmeds | Source |
|
Copyright 2016-Present - The University of Texas Health Science Center at Houston (UTHealth) Web File Viewing | How to Report, Fraud, Waste and Abuse | State of Texas | Statewide Search | Texas Homeland Security | Site Policies |