 |
| |
| |
| |
| |
| |
| |
|

| TissGeneSummary for C11orf70 |
 Gene summary Gene summary |
| Basic gene information | Gene symbol | C11orf70 |
| Gene name | chromosome 11 open reading frame 70 | |
| Synonyms | - | |
| Cytomap | UCSC genome browser: 11q22.1 | |
| Type of gene | protein-coding | |
| RefGenes | NM_001195005.1, NM_032930.2, | |
| Description | uncharacterized protein C11orf70 | |
| Modification date | 20141207 | |
| dbXrefs | HGNC : HGNC | |
| Ensembl : ENSG00000137691 | ||
| HPRD : 14433 | ||
| Vega : OTTHUMG00000167320 | ||
| Protein | UniProt: go to UniProt's Cross Reference DB Table | |
| Expression | CleanEX: HS_C11orf70 | |
| BioGPS: 85016 | ||
| Pathway | NCI Pathway Interaction Database: C11orf70 | |
| KEGG: C11orf70 | ||
| REACTOME: C11orf70 | ||
| Pathway Commons: C11orf70 | ||
| Context | iHOP: C11orf70 | |
| ligand binding site mutation search in PubMed: C11orf70 | ||
| UCL Cancer Institute: C11orf70 | ||
| Assigned class in TissGDB* | C | |
| Included tissue-specific gene expression resources | ||
| Specific-tissues in normal samples (assigned by TissGDB using HPA, TiGER, and GTEx) | Testis | |
| Cancer types related to the specific-tissues in cancer samples (assigned by TissGDB using TCGA) | TGCT | |
| Reference showing the relevant tissue of C11orf70 | ||
| Description by TissGene annotations | Fused withOncogene Fused withTSGene | |
| * Class A consists of genes with literature evidence and is part of the cTissGenes. Class B consists of only cTissGenes without additional evidence. The remaining genes belong to Class C. |
| Gene ontology having evidence of Inferred from Direct Assay (IDA) from Entrez |
| GO ID | GO term | PubMed ID |
| Top |
| TissGeneExp for C11orf70 |
| Gene expressions across 28 cancer types (X-axis: cancer type and Y-axis: log2(norm_counts+1)) (TCGA IlluminaHiSeq_RNASeqV2, pan-cancer normalized log2(norm_counts+1) data, version 2016-08-16) |
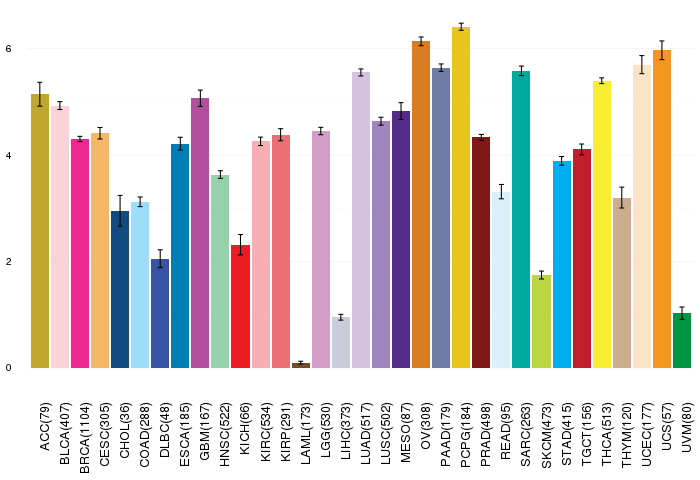 |
| Gene isoform expressions across 28 cancer types (X-axis: cancer type and Y-axis: log2(norm_counts+1)) (TCGA pan-cancer tcga_rsem_isoform_tpm, version 2016-09-01) |
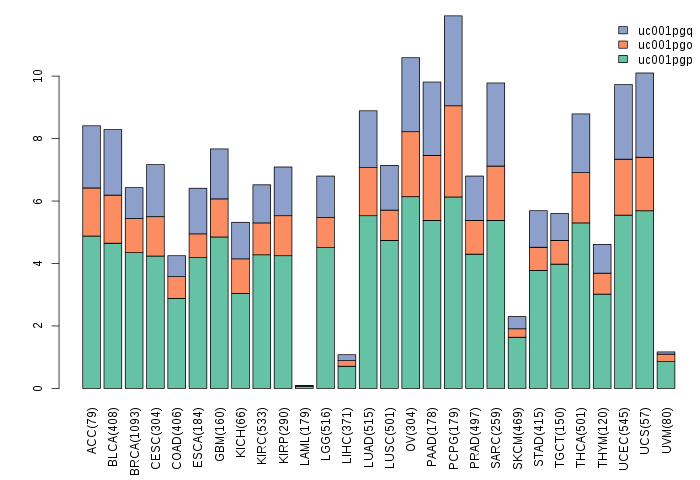 |
| Gene expressions across normal tissues of GTEx data (GTEx GTEx_Analysis_v6_RNA-seq_RNA-SeQCv1.1.8_gene_rpkm.gct) - Here, we shows the matched tissue types only among our 28 cancer types. |
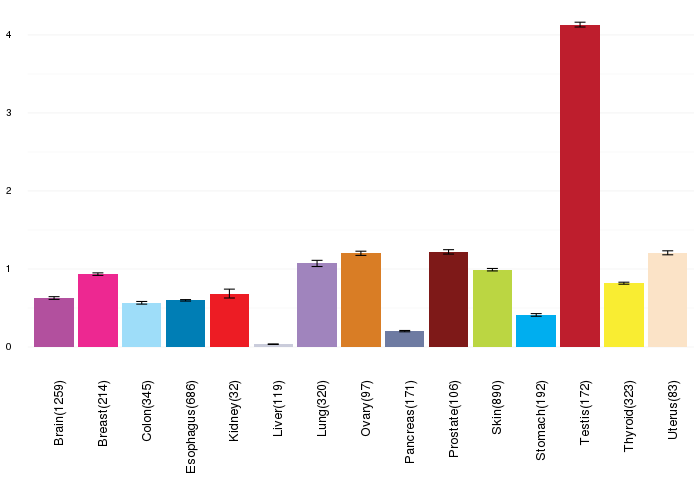 |
| Different expressions across 14 cancer types with more than 10 samples between matched tumors and normals (X-axis: cancer type and Y-axis: log2(norm_counts+1)) (TCGA IlluminaHiSeq_RNASeqV2, pan-cancer normalized log2(norm_counts+1) data, version 2016-08-16) |
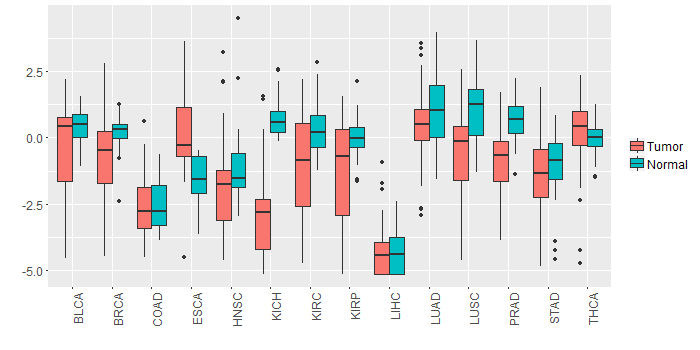 |
| - Significantly differentially expressed cancer types and information. (|Fold change|>1 and FDR<0.05) |
| Cancer type | Mean(exp) in tumor | Mean(exp) in matched normal | Log2FC | P-val. | FDR |
| LUSC | -0.535803697 | 1.007533558 | -1.543337255 | 3.63E-07 | 9.53E-07 |
| PRAD | -0.804489029 | 0.725614817 | -1.530103846 | 1.26E-12 | 6.57E-11 |
| KICH | -2.675568952 | 0.738743048 | -3.414312 | 9.61E-10 | 6.02E-09 |
| KIRC | -0.947071508 | 0.293272937 | -1.240344444 | 6.23E-07 | 1.62E-06 |
| KIRP | -1.167325327 | -0.007340952 | -1.159984375 | 0.00366 | 0.008880649 |
| Top |
| TissGene-miRNA for C11orf70 |
| Significantly anti-correlated miRNAs of TissGene across 28 cancer types (Gene-miRNA relations from TargetScanHuman Relsease 7.1, Conserved_Site_Context_Scores.txt.zip, 06.01.2016) (TCGA IlluminaHiSeq_miRNASeq, log2(RPM+1) data, version 2016-11-21) (TCGA IlluminaHiSeq_RNASeqV2, log2(normalized_count+1) data, version 2016-08-16) (Spearman’s Rank Correlation (p-value<0.05 and coefficient<-0.25)) |
| Cancer type | miRNA id | miRNA accession | P-val. | Coeff. | # samples |
| Top |
| TissGeneMut for C11orf70 |
| TissGeneSNV for C11orf70 |
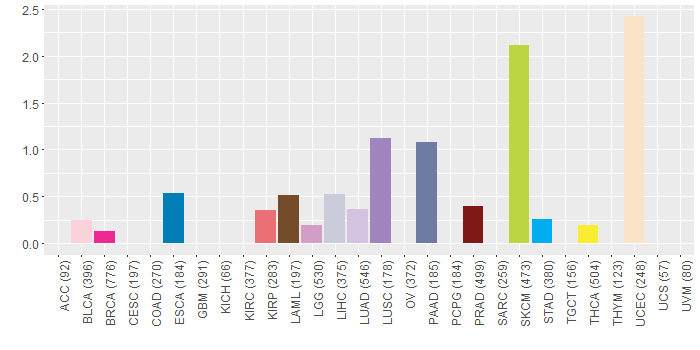
| nsSNV counts per each loci. Different colors of circles represent different cancer types. Circle size denotes number of samples. (TCGA somatic mutation (SNPs and small INDELs) data, version 2016-04-25) * Click on the image to enlarge it in a new window. |
 |
 |
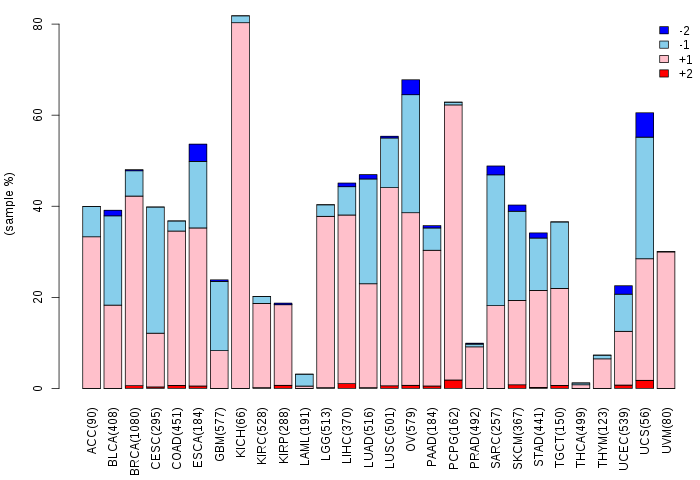
| Somatic nucleotide variants of TissGene across 28 cancer types (X-axis: cancer type and Y-axis: % of mutated samples) The numbers in parentheses are numbers of samples with mutation (nsSNVs). (TCGA somatic mutation (SNPs and small INDELs) data, version 2016-04-25) |
 |
| - nsSNVs sorted by frequency. |
| AAchange | Cancer type | # samples |
| p.E156K | SKCM | 2 |
| p.R167* | UCEC | 2 |
| p.E239* | SKCM | 1 |
| p.D265H | SKCM | 1 |
| p.V222I | LIHC | 1 |
| p.R144Q | SKCM | 1 |
| p.E156X | PRAD | 1 |
| p.V181I | BRCA | 1 |
| p.K199Q | MESO | 1 |
| p.D200Y | LUSC | 1 |
| p.E97K | BLCA | 1 |
| p.R205* | SKCM | 1 |
| p.L96F | PRAD | 1 |
| p.W48L | UCEC | 1 |
| p.R205Q | SKCM | 1 |
| p.R121Q | SKCM | 1 |
| p.R205X | SKCM | 1 |
| p.M230I | PAAD | 1 |
| p.Y57N | LIHC | 1 |
| p.L136I | UCEC | 1 |
| p.R214C | UCEC | 1 |
| p.E156* | PRAD | 1 |
| p.S217Y | PAAD | 1 |
| p.D151H | LUSC | 1 |
| p.H112D | KIRP | 1 |
| p.E239K | LGG | 1 |
| p.R252H | LUAD | 1 |
| p.E165* | LUAD | 1 |
| p.D185N | SKCM | 1 |
| p.G224D | LAML | 1 |
| p.C175Y | ESCA | 1 |
| p.K221T | THCA | 1 |
| p.A197T | UCEC | 1 |
| p.P249S | SKCM | 1 |
| p.E92G | STAD | 1 |
| p.M108I | LGG | 1 |
| p.S82F | LGG | 1 |
| Top |
| TissGeneCNV for C11orf70 |
| Copy number variations of TissGene across 28 cancer types (X-axis: cancer type and Y-axis: % of CNV samples) (TCGA Gistic2_CopyNumber_Gistic2_all_data_by_genes, Gistic2 copy number data, version 2016-08-16) |
 |
| Top |
| TissGeneFusions for C11orf70 |
| Fusion genes including TissGene (ChimerDB 3.0, 2016-12-01 and TCGA fusion Portal 2015-12-01) |
| Database | Src | Cancer type | Sample | Fusion gene | ORF | 5'-gene BP | 3'-gene BP |
| Chimerdb3.0 | FusionScan | ESCA | TCGA-IG-A3I8-01A | ST3GAL4-C11orf70 | In-Frame | chr11:126279306 | chr11:101929610 |
| Chimerdb3.0 | FusionScan | ESCA | TCGA-IG-A3I8-01A | ST3GAL4-C11orf70 | In-Frame | chr11:126283543 | chr11:101929610 |
| TCGAfusionPortal | PRADA | BLCA | TCGA-C4-A0F0-01A | DYNC2H1-C11orf70 | Out-of-frame | Chr11:102999734 | Chr11:101918546 |
| TCGAfusionPortal | PRADA | LUAD | TCGA-62-A46O-01A | YAP1-C11orf70 | In-frame | Chr11:101985125 | Chr11:101951946 |
| TCGAfusionPortal | PRADA | LUAD | TCGA-69-7979-01A | YAP1-C11orf70 | In-frame | Chr11:101985125 | Chr11:101918546 |
| Top |
| TissGeneNet for C11orf70 |
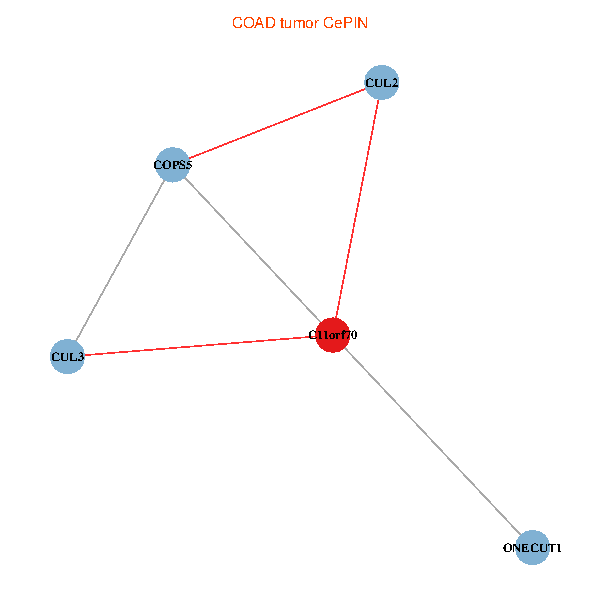
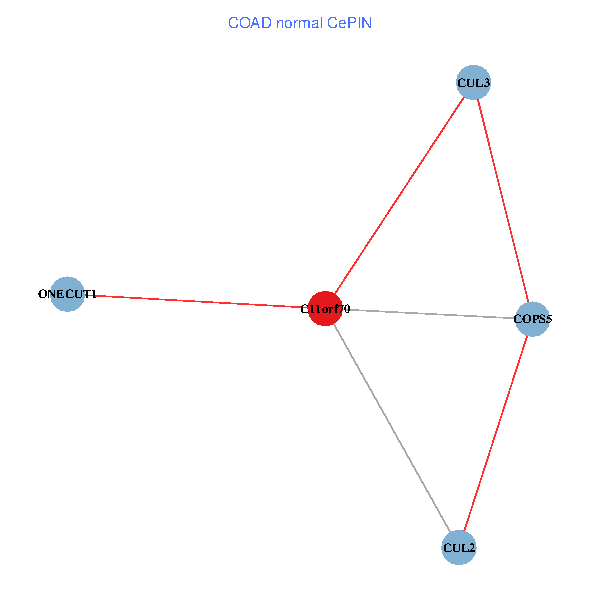
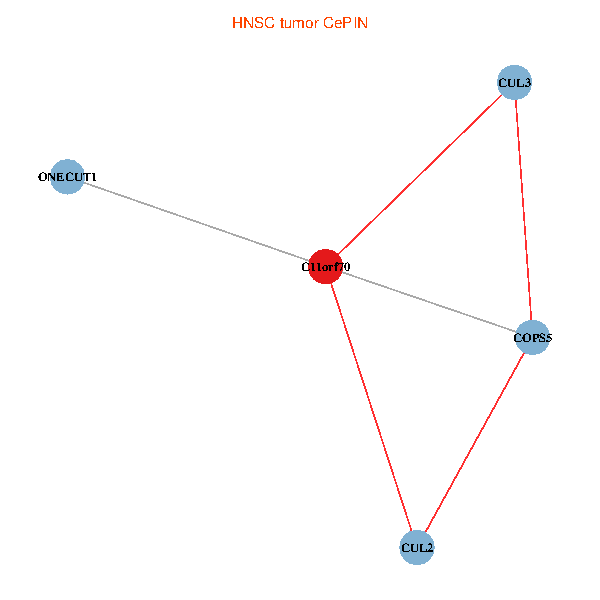
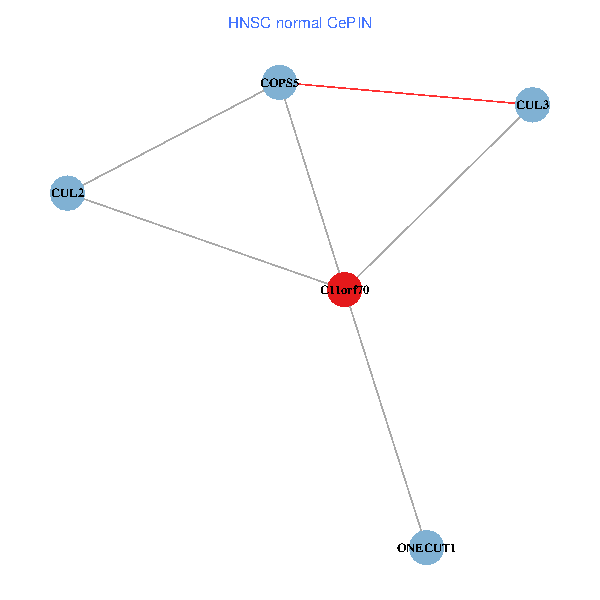
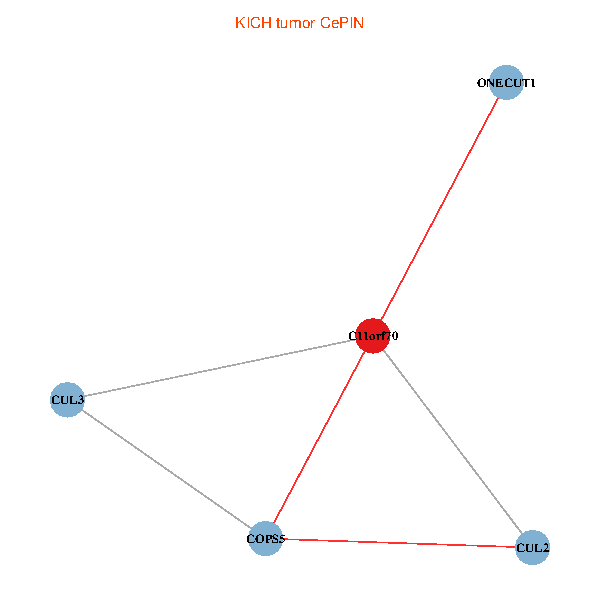
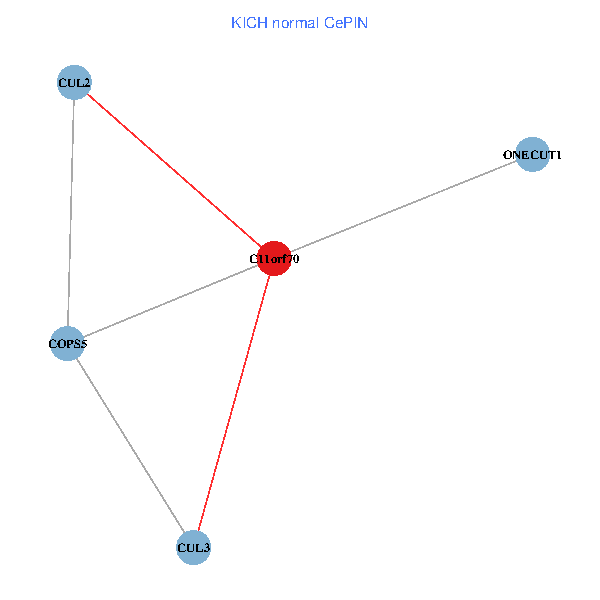
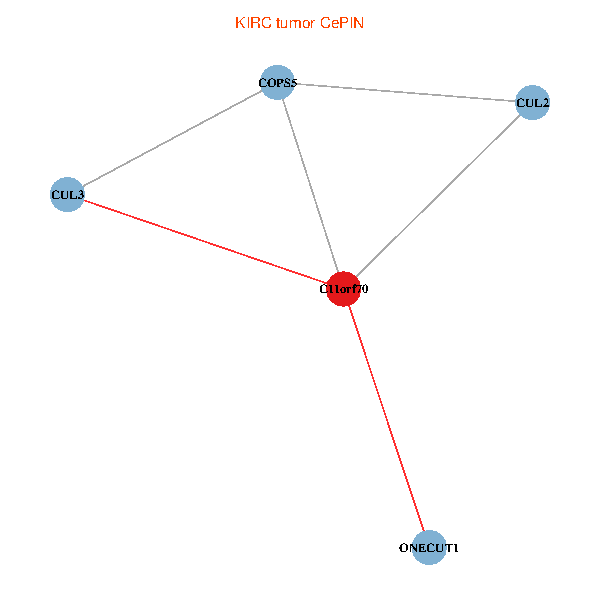
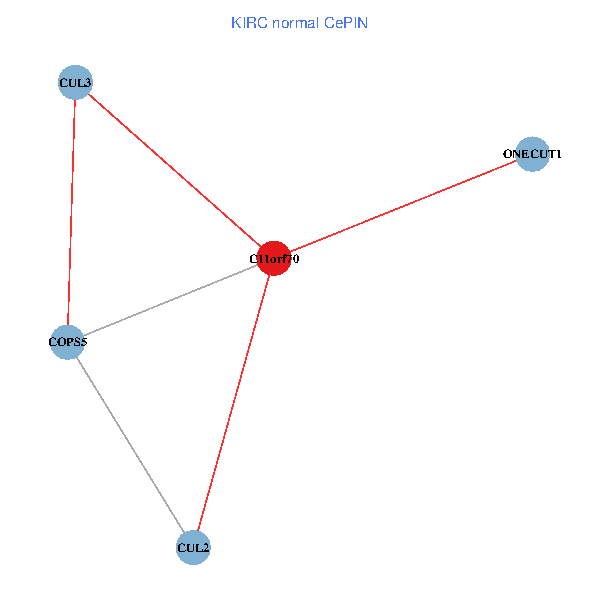
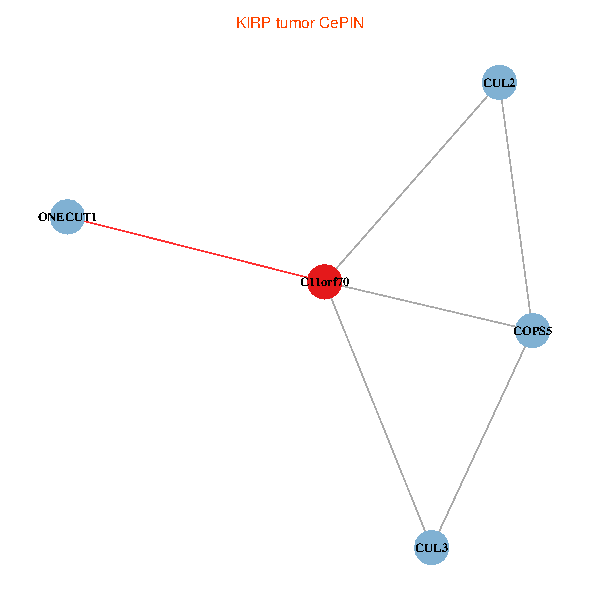
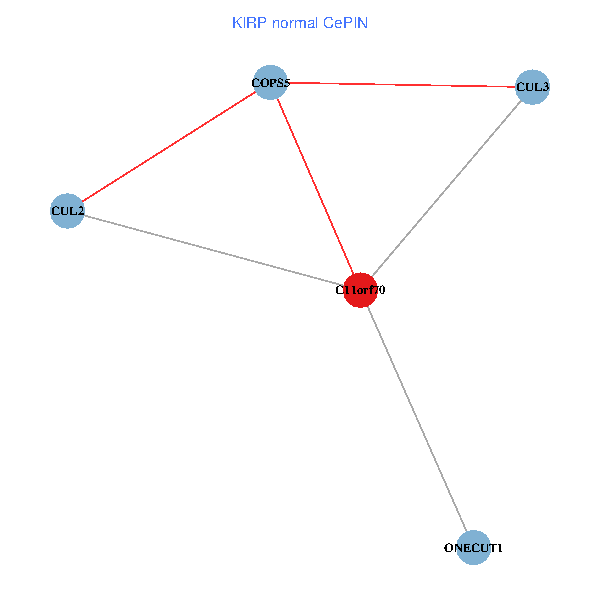
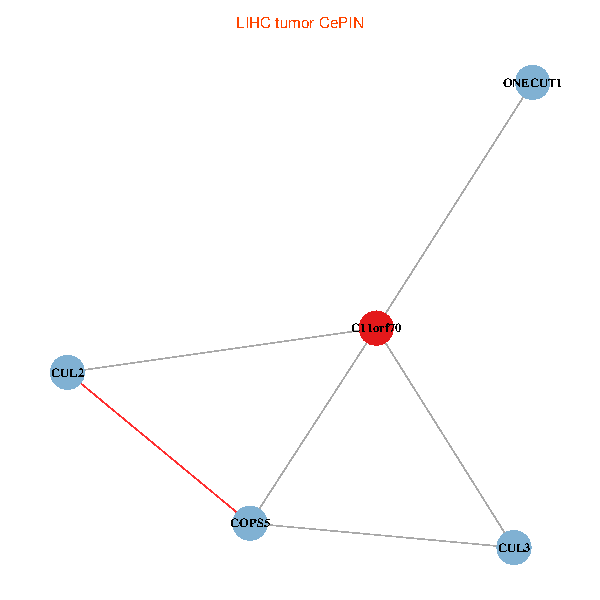
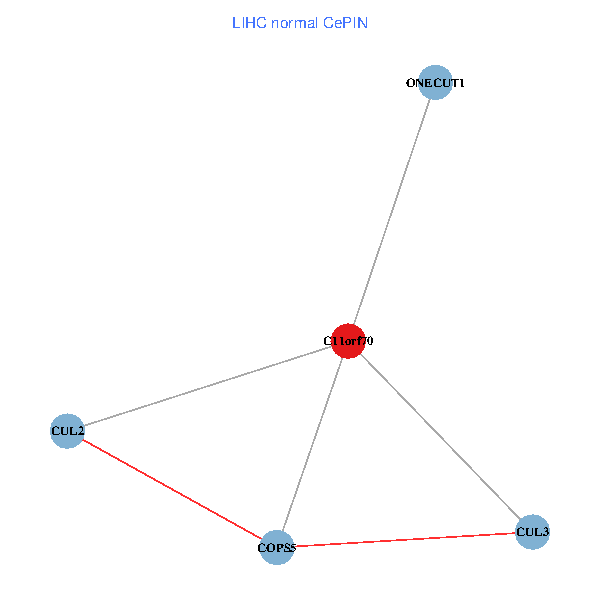
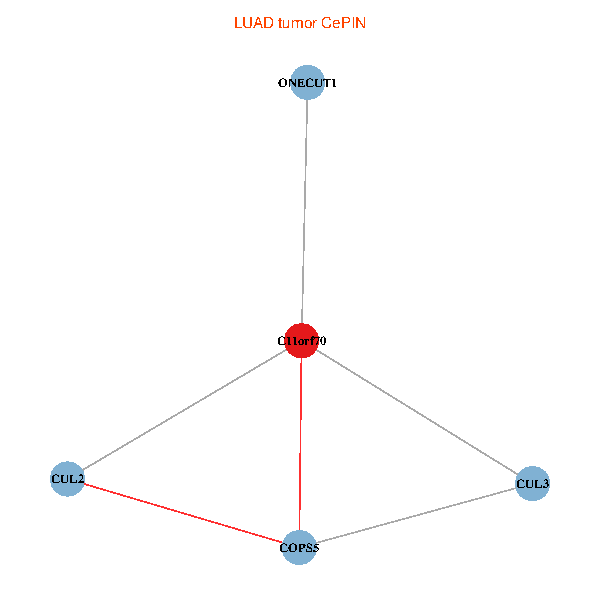
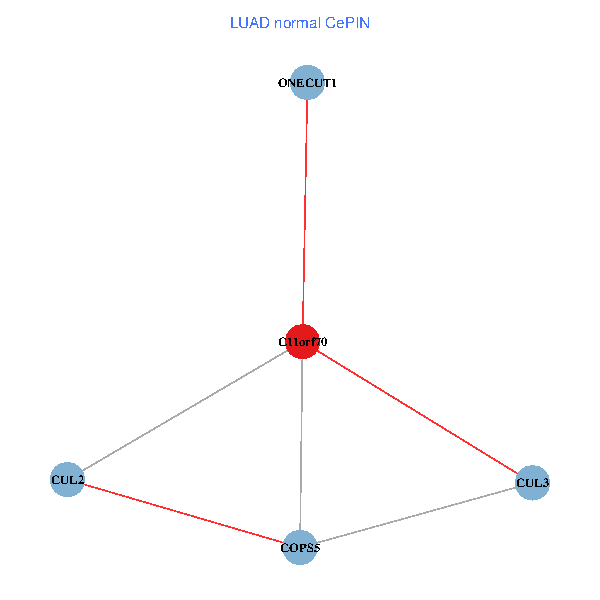
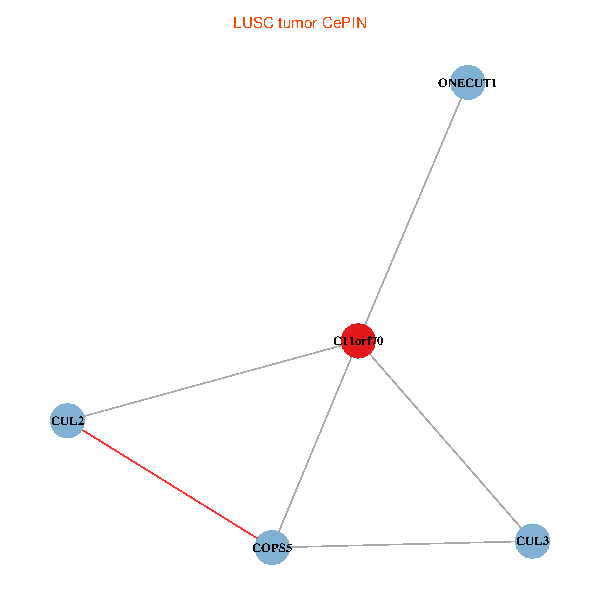
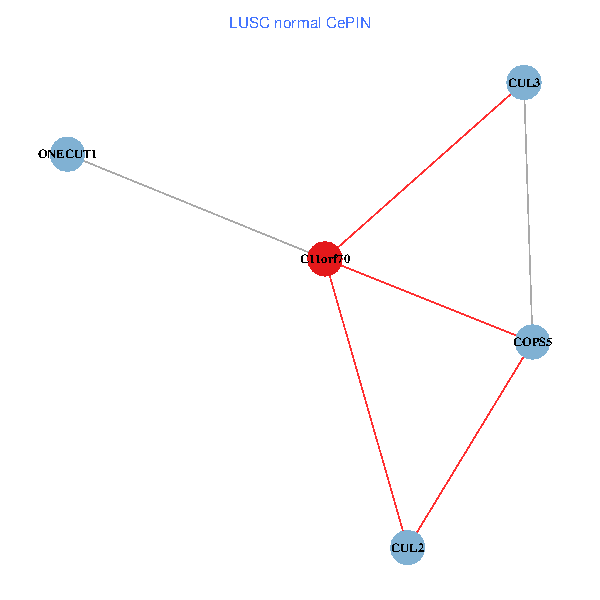
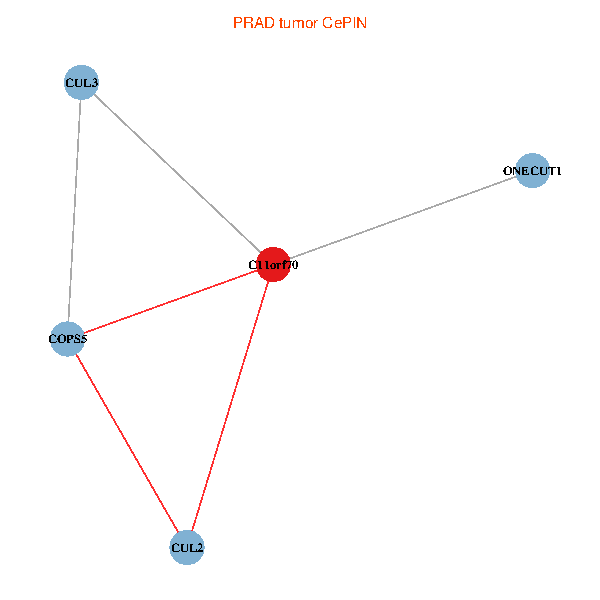
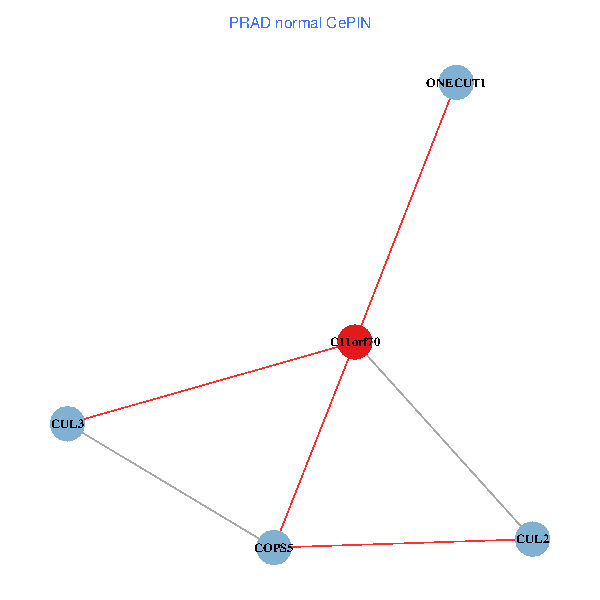
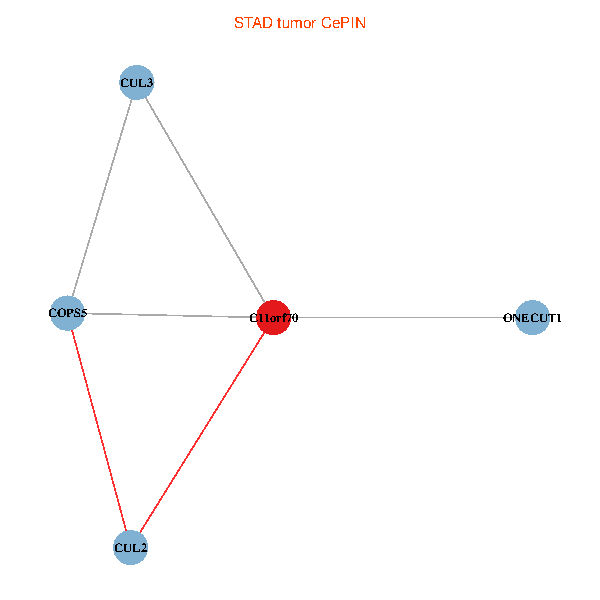
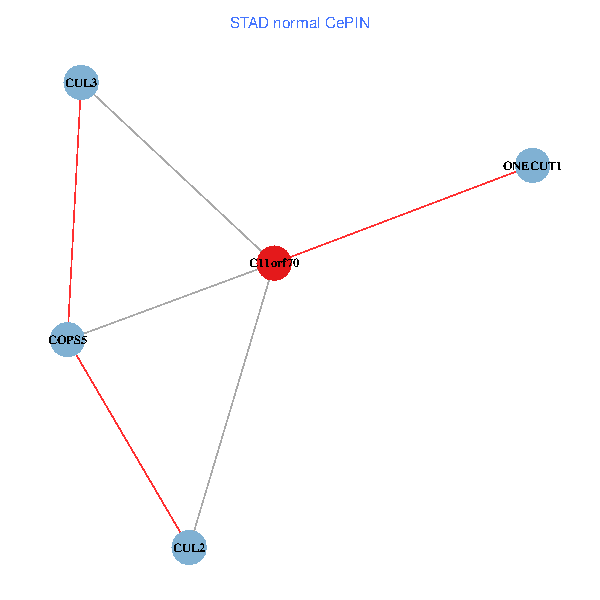
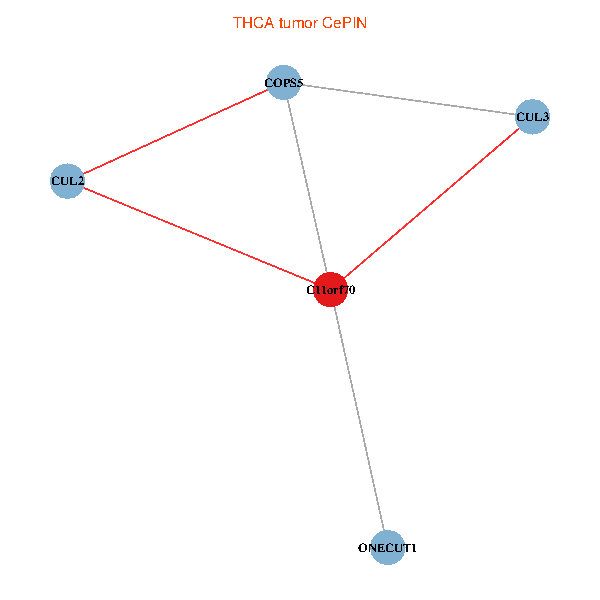
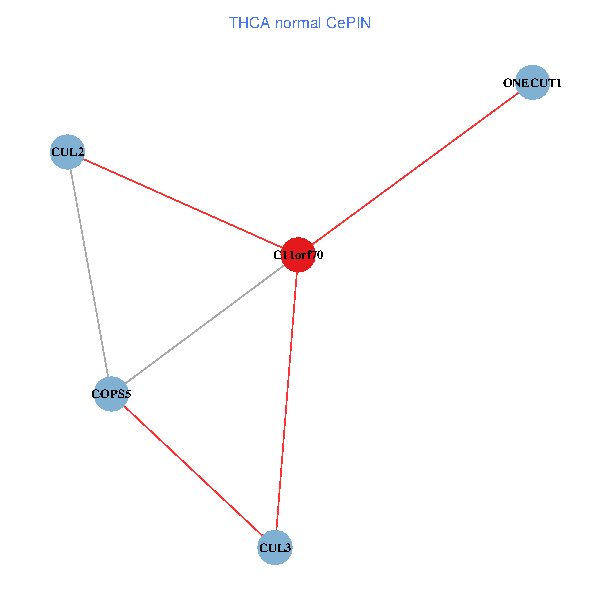
| Co-expressed gene networks based on protein-protein interaction data (CePIN) (TCGA IlluminaHiSeq_RNASeqV2, pan-cancer normalized log2(norm_counts+1) data, version 2016-08-16) (PINA2 ppi data) |
| BRCA (tumor) | BRCA (normal) |
| C11orf70, CUL2, ONECUT1, CUL3, COPS5 (tumor) | C11orf70, CUL2, ONECUT1, CUL3, COPS5 (normal) |
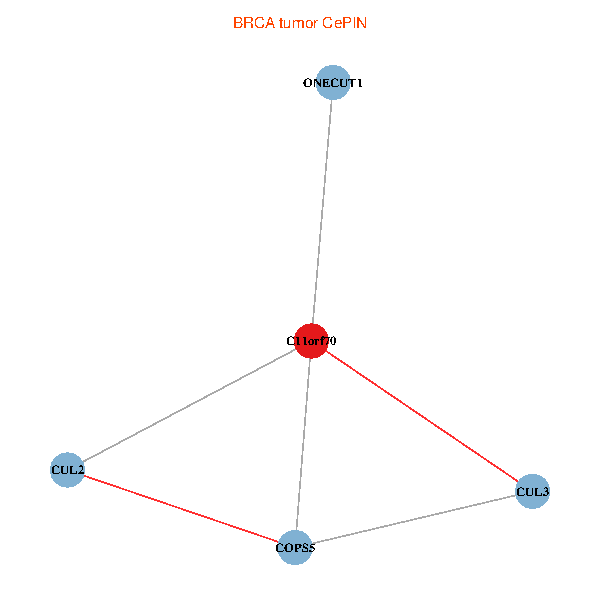 | 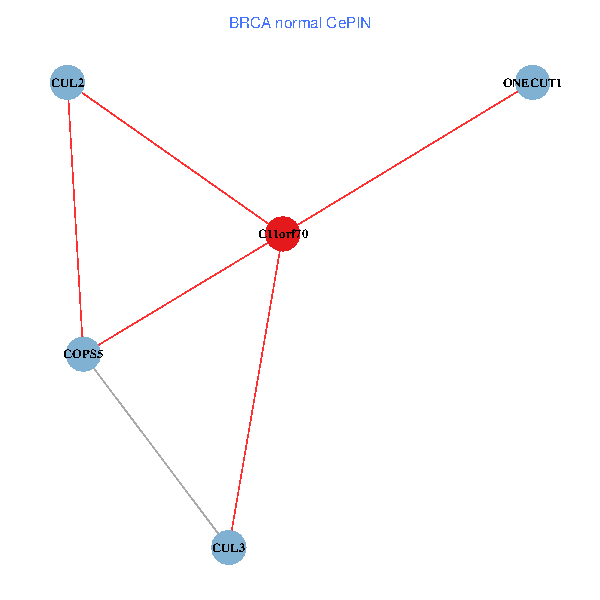 |
| COAD (tumor) | COAD (normal) |
| C11orf70, CUL2, ONECUT1, CUL3, COPS5 (tumor) | C11orf70, CUL2, ONECUT1, CUL3, COPS5 (normal) |
 |  |
| HNSC (tumor) | HNSC (normal) |
| C11orf70, CUL2, ONECUT1, CUL3, COPS5 (tumor) | C11orf70, CUL2, ONECUT1, CUL3, COPS5 (normal) |
 |  |
| KICH (tumor) | KICH (normal) |
| C11orf70, CUL2, ONECUT1, CUL3, COPS5 (tumor) | C11orf70, CUL2, ONECUT1, CUL3, COPS5 (normal) |
 |  |
| KIRC (tumor) | KIRC (normal) |
| C11orf70, CUL2, ONECUT1, CUL3, COPS5 (tumor) | C11orf70, CUL2, ONECUT1, CUL3, COPS5 (normal) |
 |  |
| KIRP (tumor) | KIRP (normal) |
| C11orf70, CUL2, ONECUT1, CUL3, COPS5 (tumor) | C11orf70, CUL2, ONECUT1, CUL3, COPS5 (normal) |
 |  |
| LIHC (tumor) | LIHC (normal) |
| C11orf70, CUL2, ONECUT1, CUL3, COPS5 (tumor) | C11orf70, CUL2, ONECUT1, CUL3, COPS5 (normal) |
 |  |
| LUAD (tumor) | LUAD (normal) |
| C11orf70, CUL2, ONECUT1, CUL3, COPS5 (tumor) | C11orf70, CUL2, ONECUT1, CUL3, COPS5 (normal) |
 |  |
| LUSC (tumor) | LUSC (normal) |
| C11orf70, CUL2, ONECUT1, CUL3, COPS5 (tumor) | C11orf70, CUL2, ONECUT1, CUL3, COPS5 (normal) |
 |  |
| PRAD (tumor) | PRAD (normal) |
| C11orf70, CUL2, ONECUT1, CUL3, COPS5 (tumor) | C11orf70, CUL2, ONECUT1, CUL3, COPS5 (normal) |
 |  |
| STAD (tumor) | STAD (normal) |
| C11orf70, CUL2, ONECUT1, CUL3, COPS5 (tumor) | C11orf70, CUL2, ONECUT1, CUL3, COPS5 (normal) |
 |  |
| THCA (tumor) | THCA (normal) |
| C11orf70, CUL2, ONECUT1, CUL3, COPS5 (tumor) | C11orf70, CUL2, ONECUT1, CUL3, COPS5 (normal) |
 |  |
| Top |
| TissGeneProg for C11orf70 |
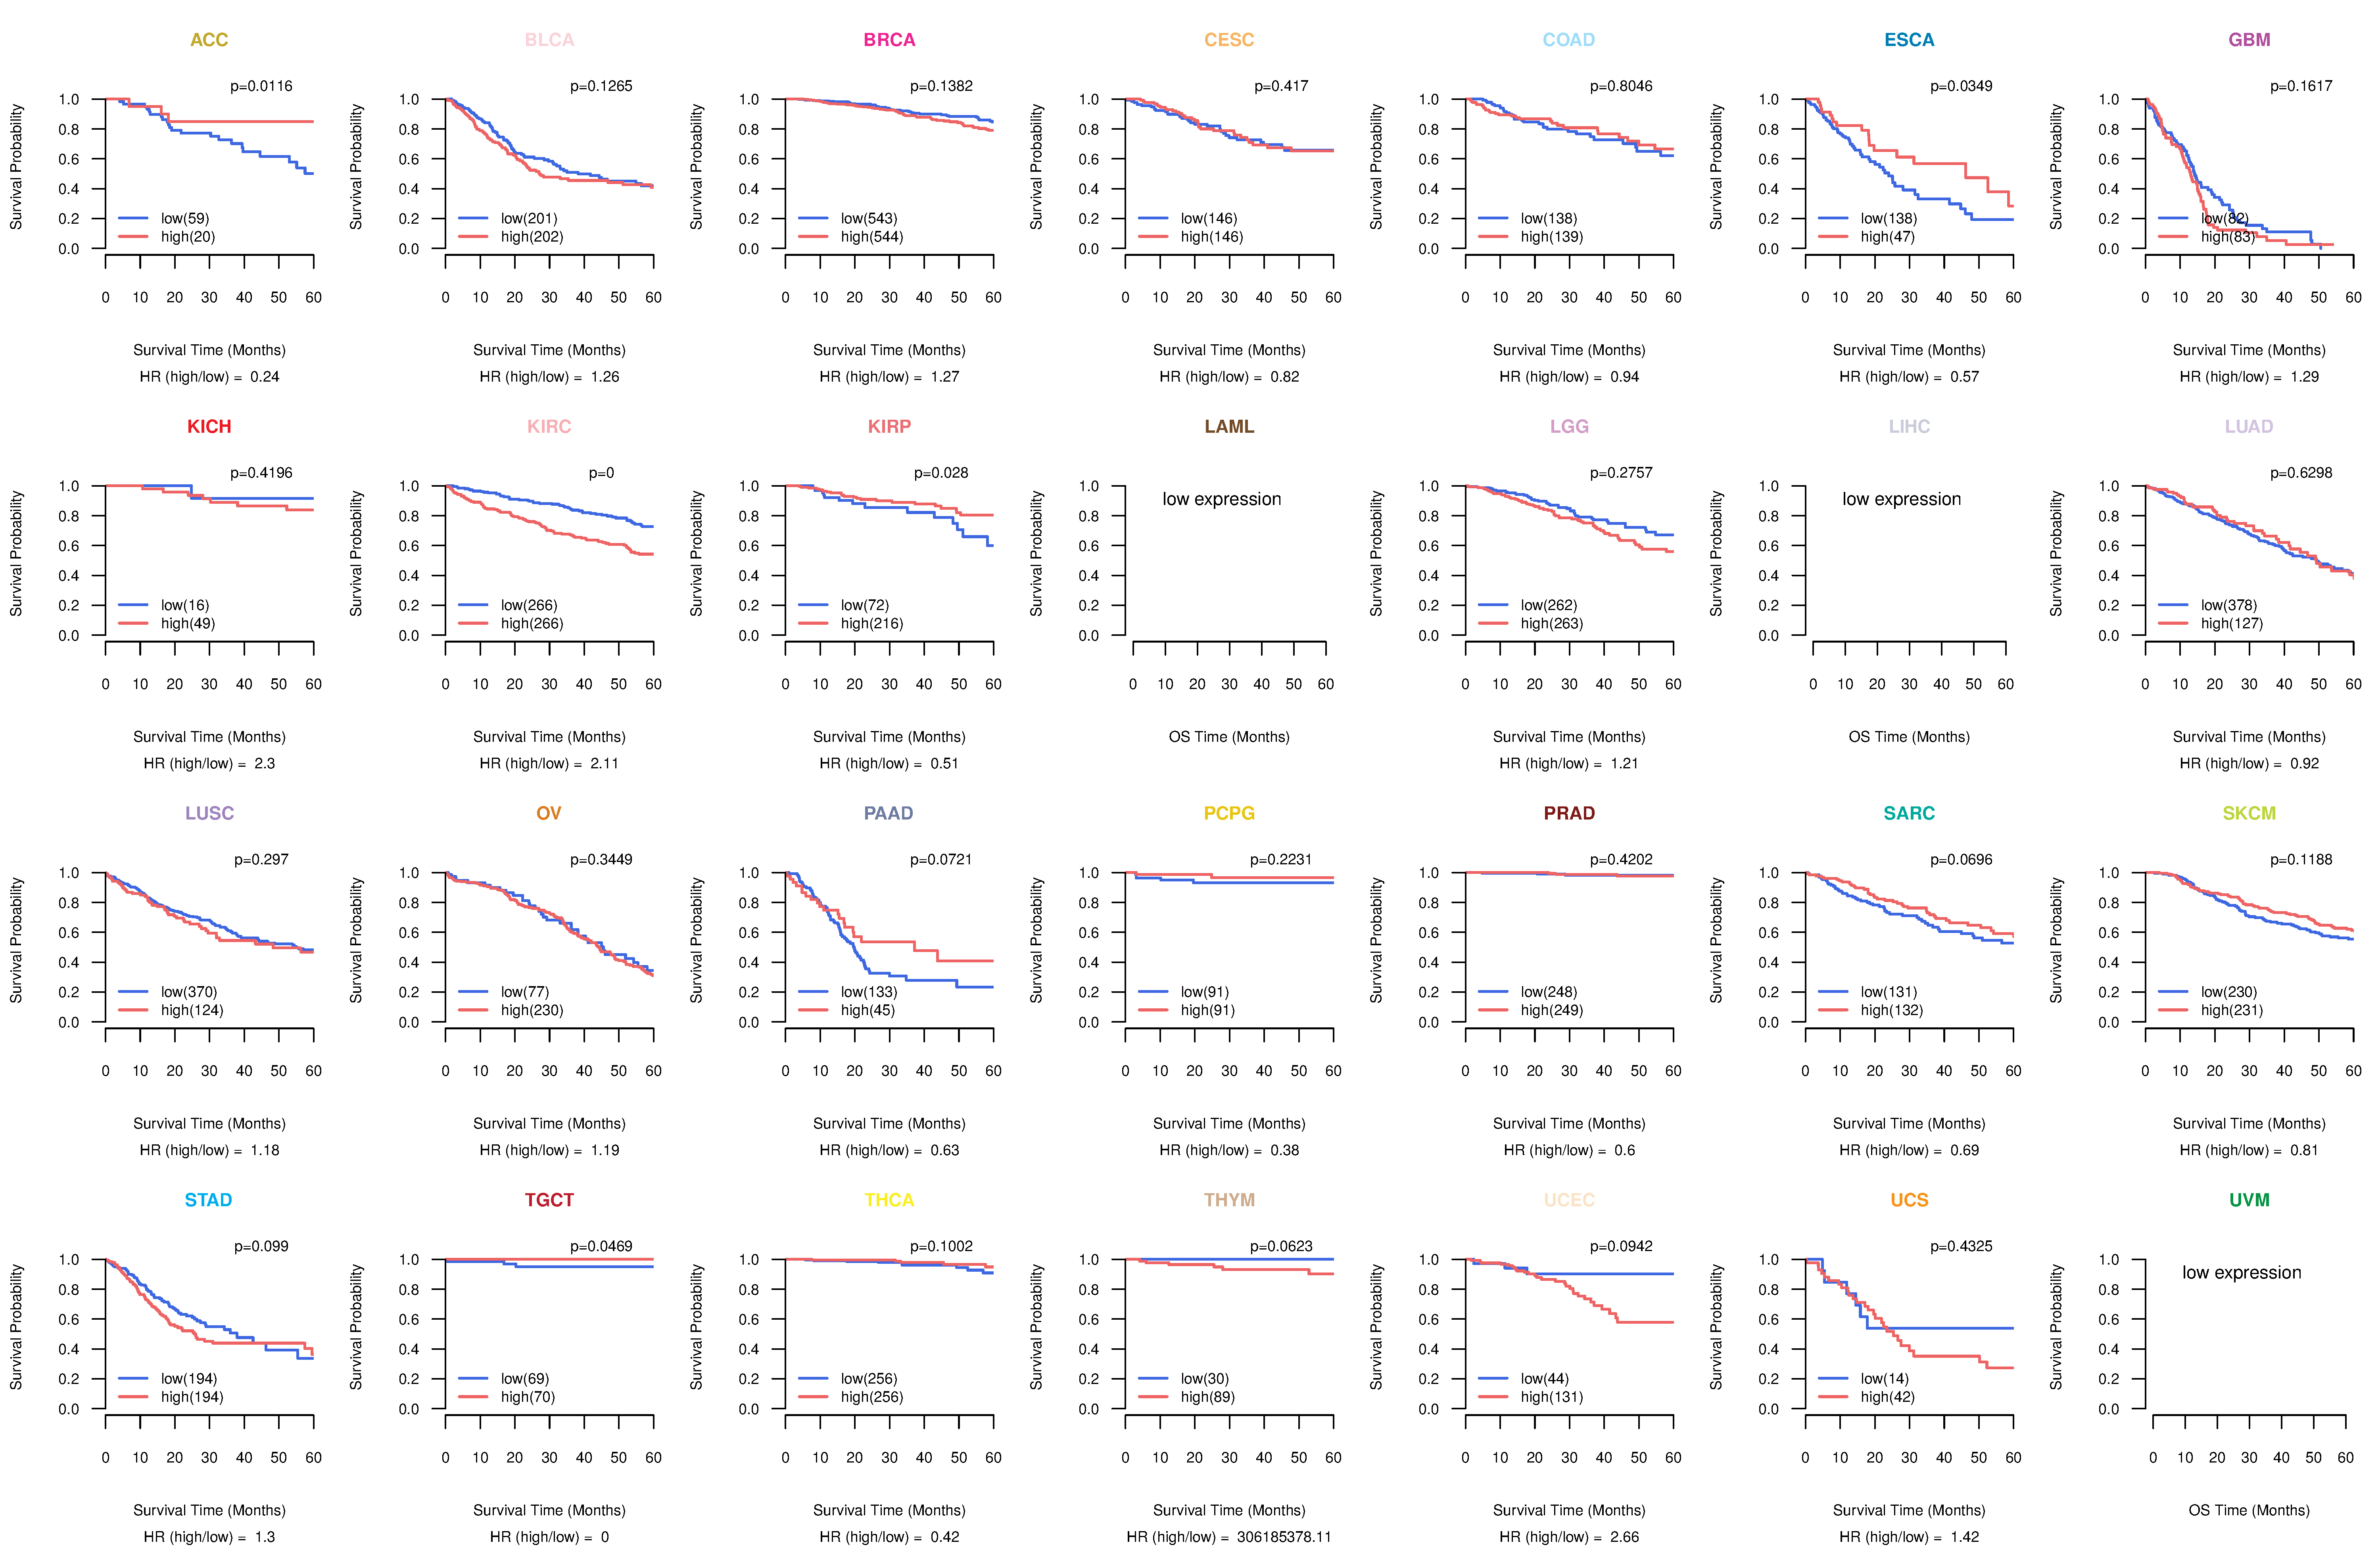
| Kaplan-Meier plots with logrank tests of overall survival (OS) using 28 cancer types (TCGA IlluminaHiSeq_RNASeqV2, pan-cancer normalized log2(norm_counts+1) data, version 2016-08-16) (TCGA clinicalMatrix, phenotype data, version 2016-04-27) * Click on the image to enlarge it in a new window. |
 |
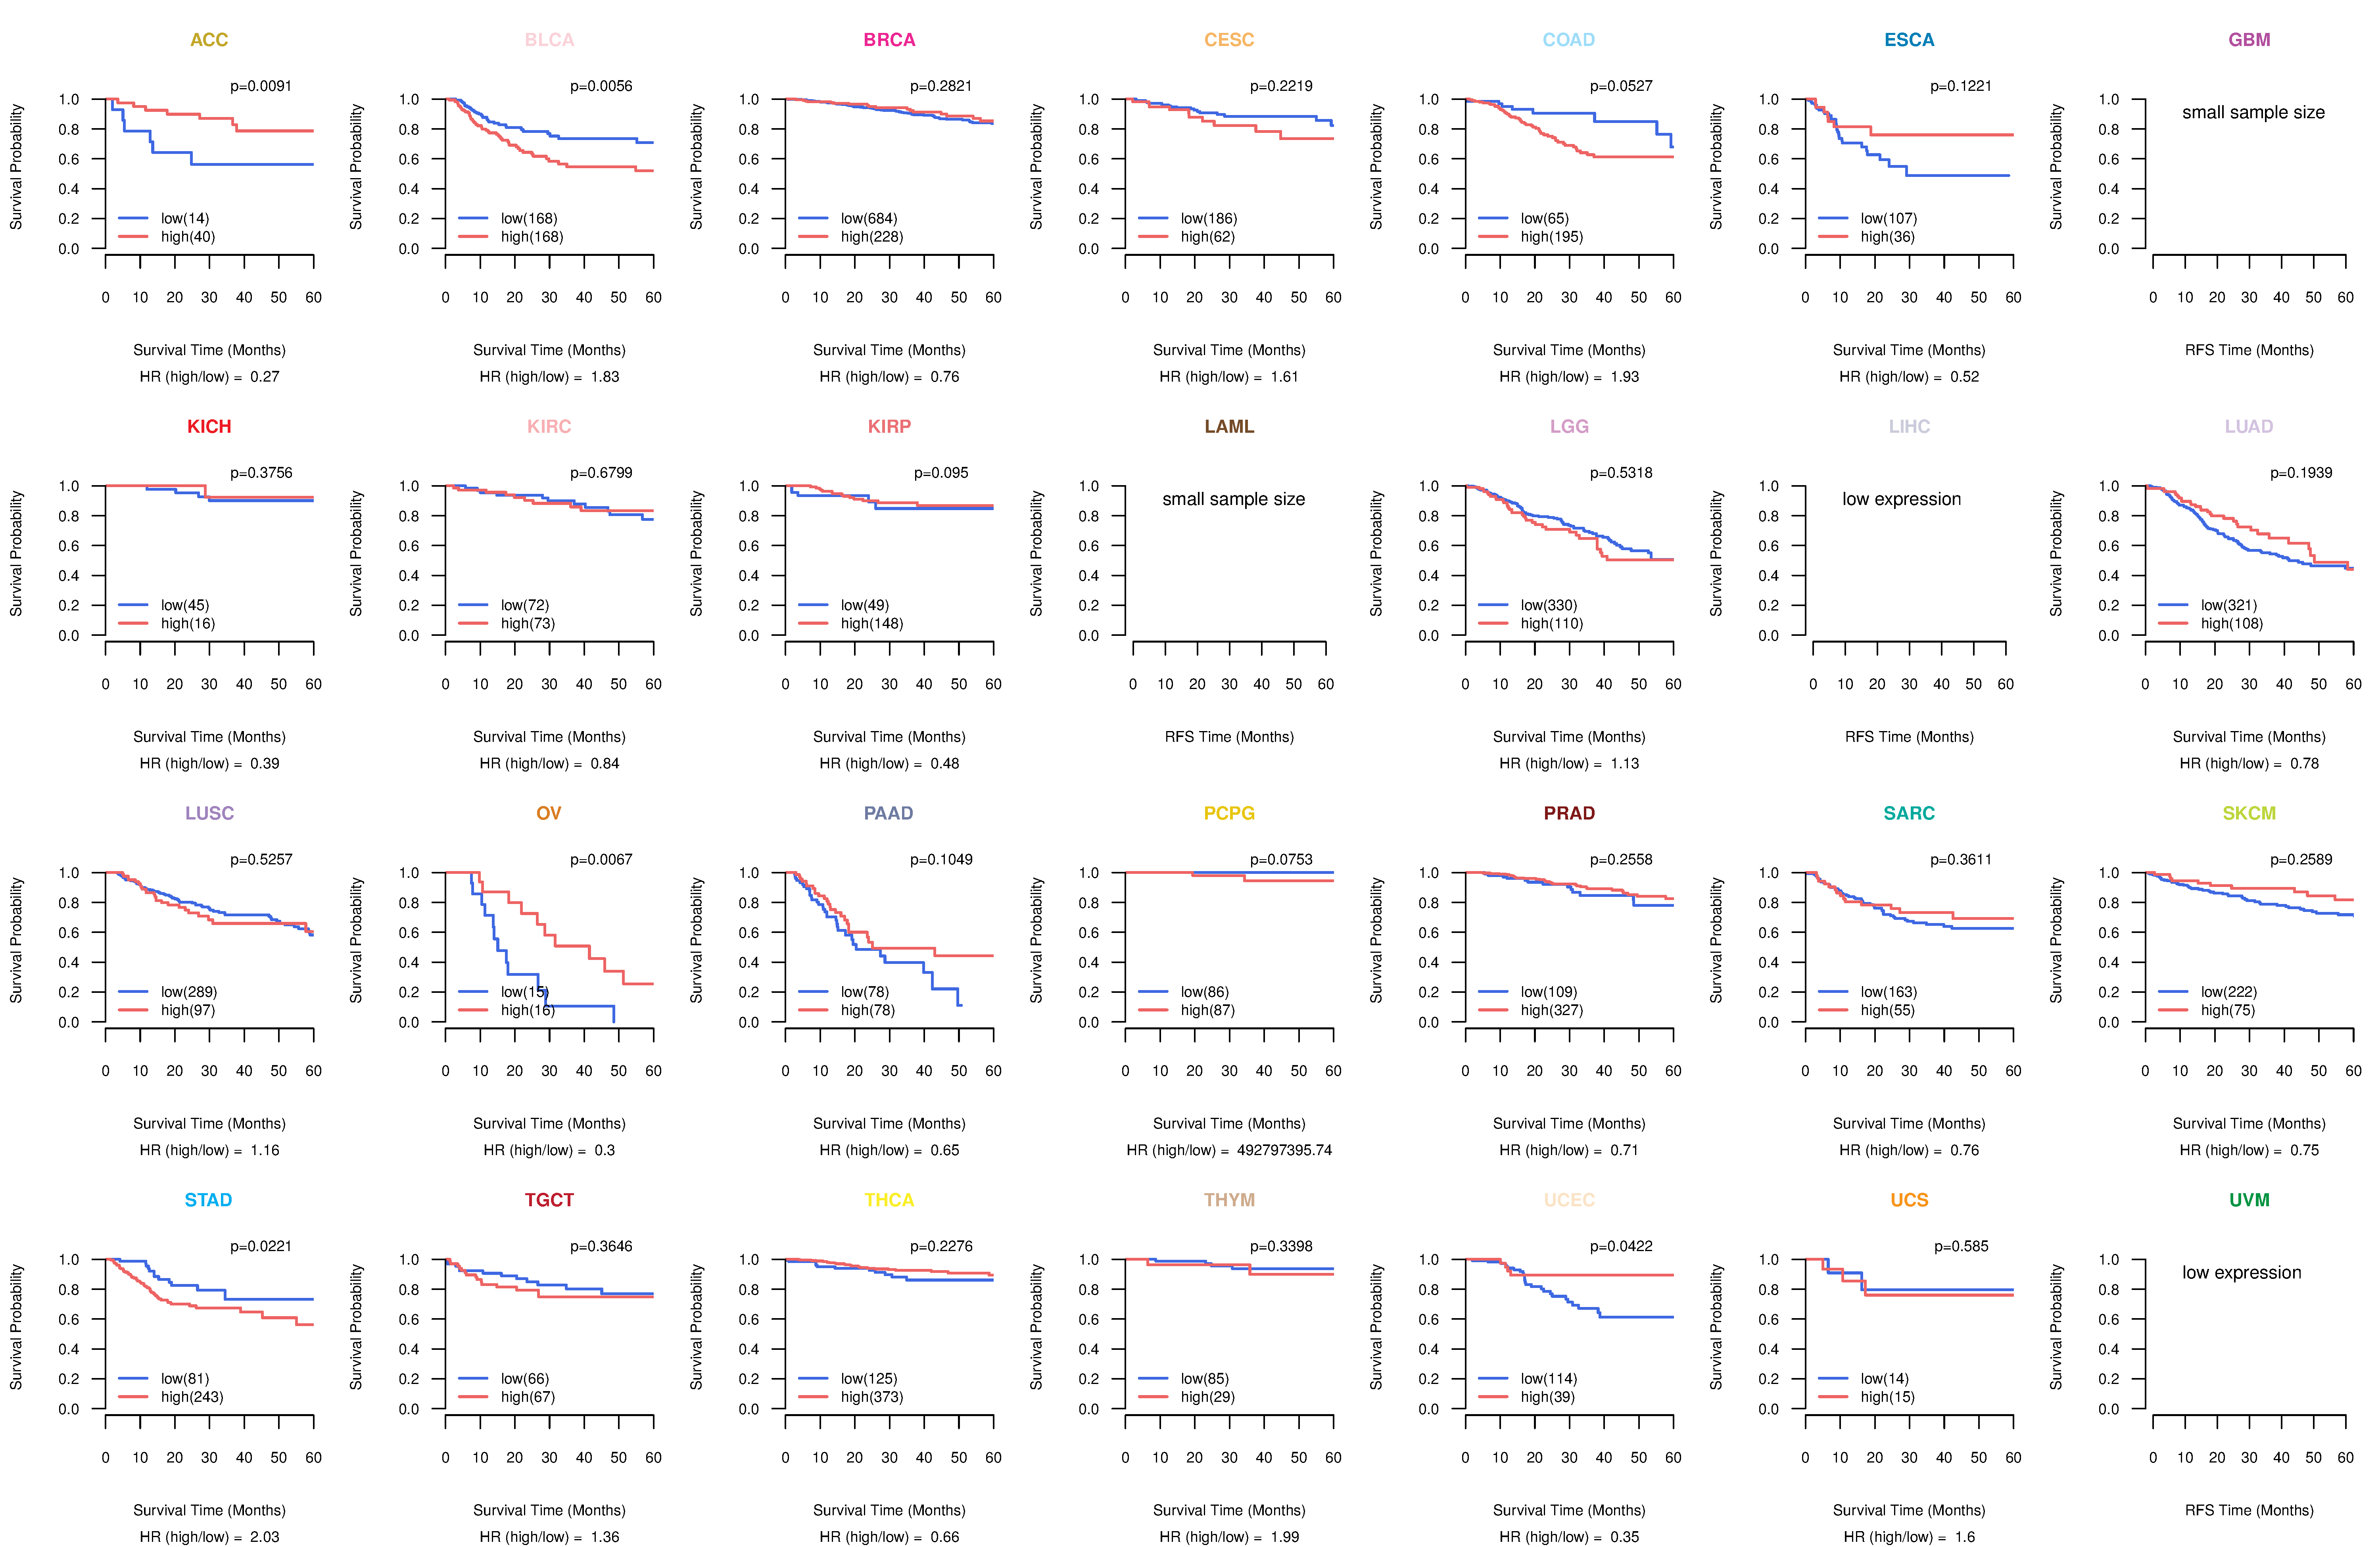
| Kaplan-Meier plots with logrank test of relapse free survival (RFS) using 28 cancer types (TCGA IlluminaHiSeq_RNASeqV2, pan-cancer normalized log2(norm_counts+1) data, version 2016-08-16) (TCGA clinicalMatrix, phenotype data, version 2016-04-27) * Click on the image enlarge it in a new window. |
 |
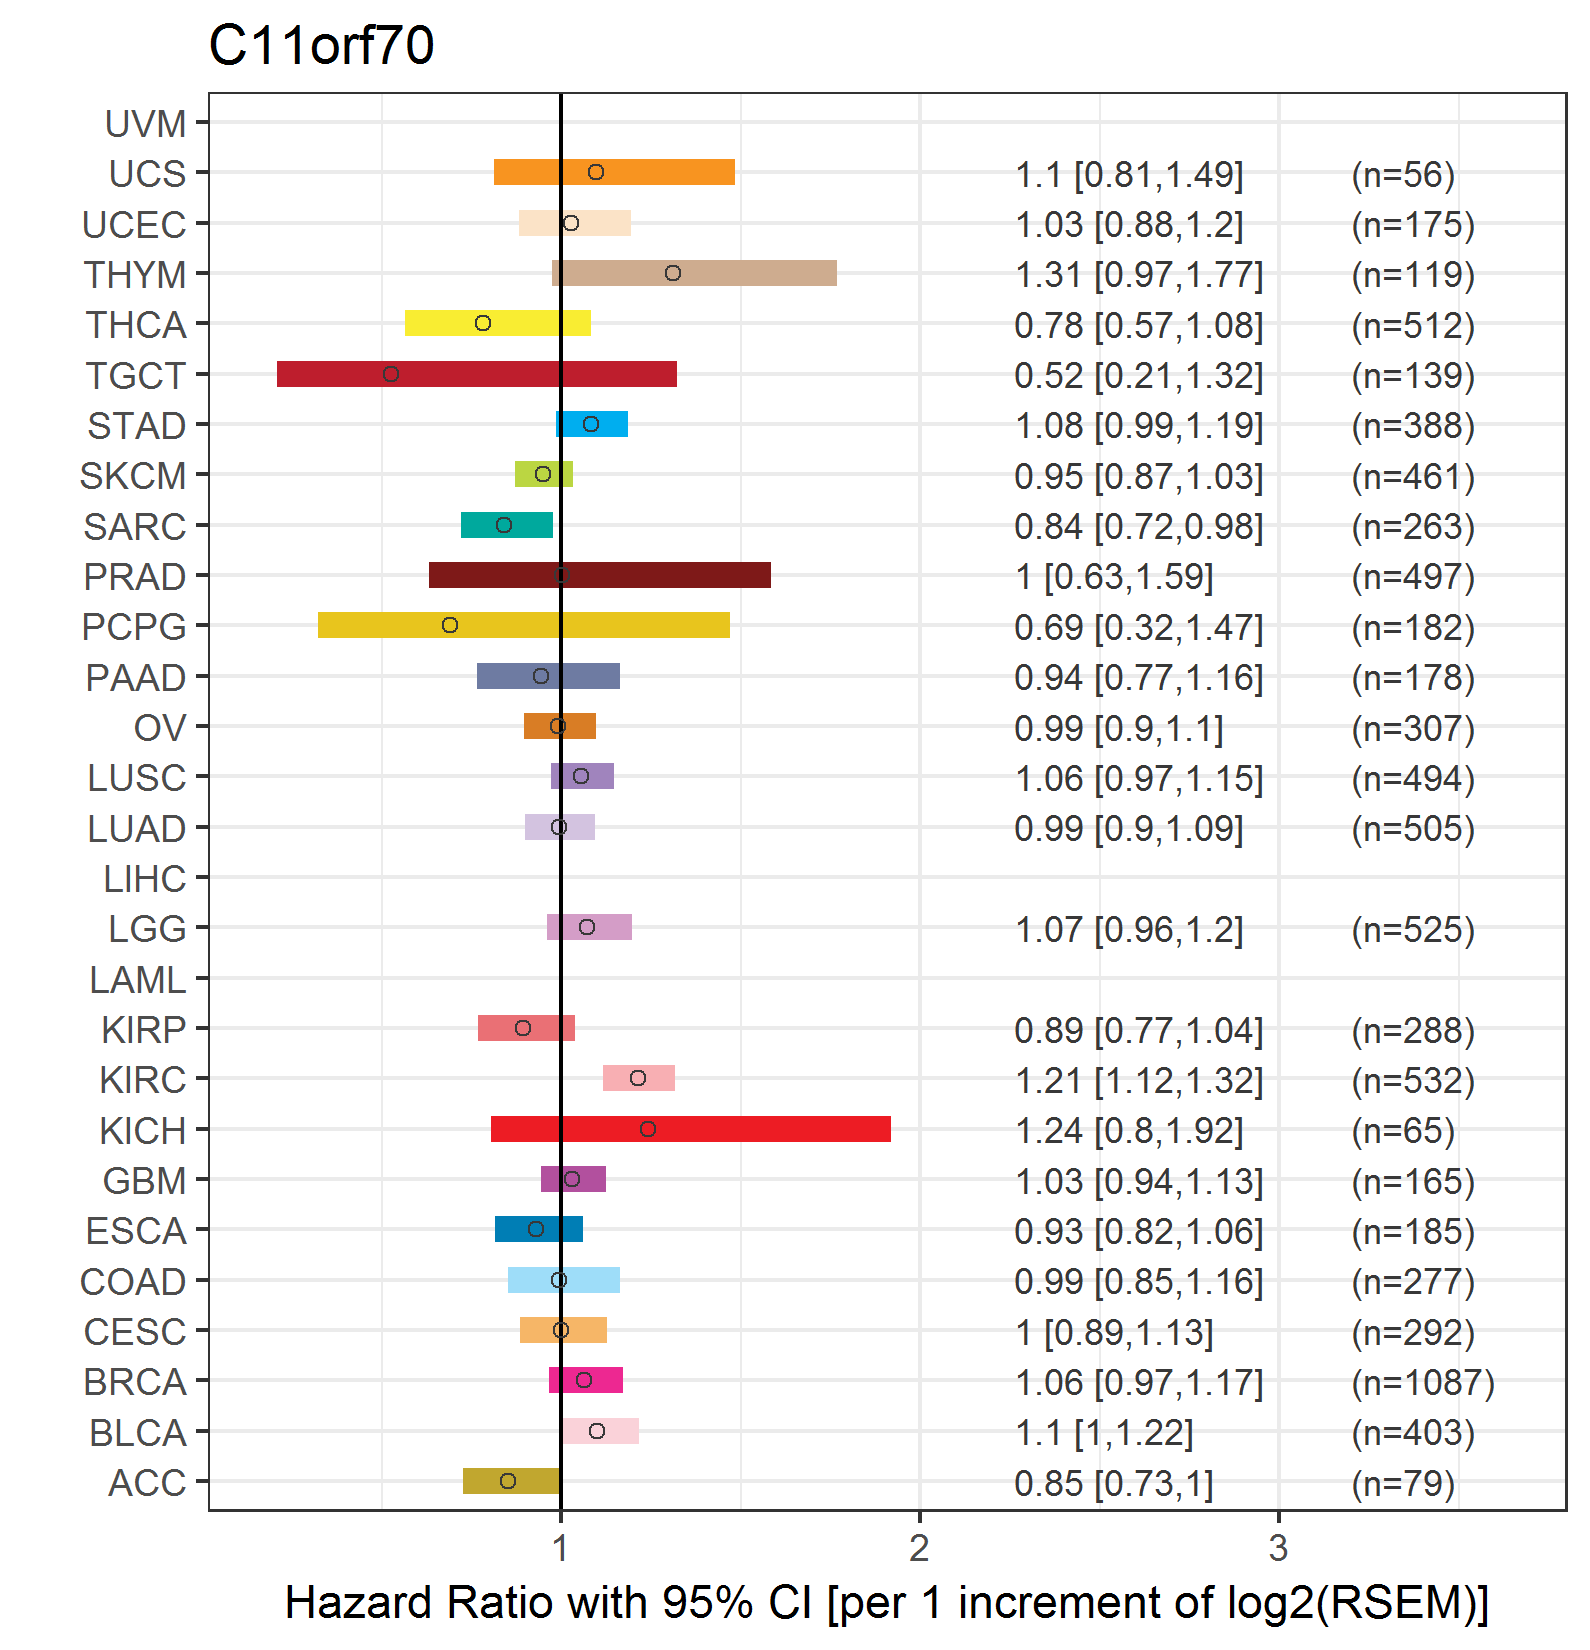
| Forest plot of Cox proportional hazard ratio (HR) and 95% CI of overall survival (OS) using 28 cancer types (TCGA IlluminaHiSeq_RNASeqV2, pan-cancer normalized log2(norm_counts+1) data, version 2016-08-16) (TCGA clinicalMatrix, phenotype data, version 2016-04-27) * Click on the image enlarge it in a new window. |
 |
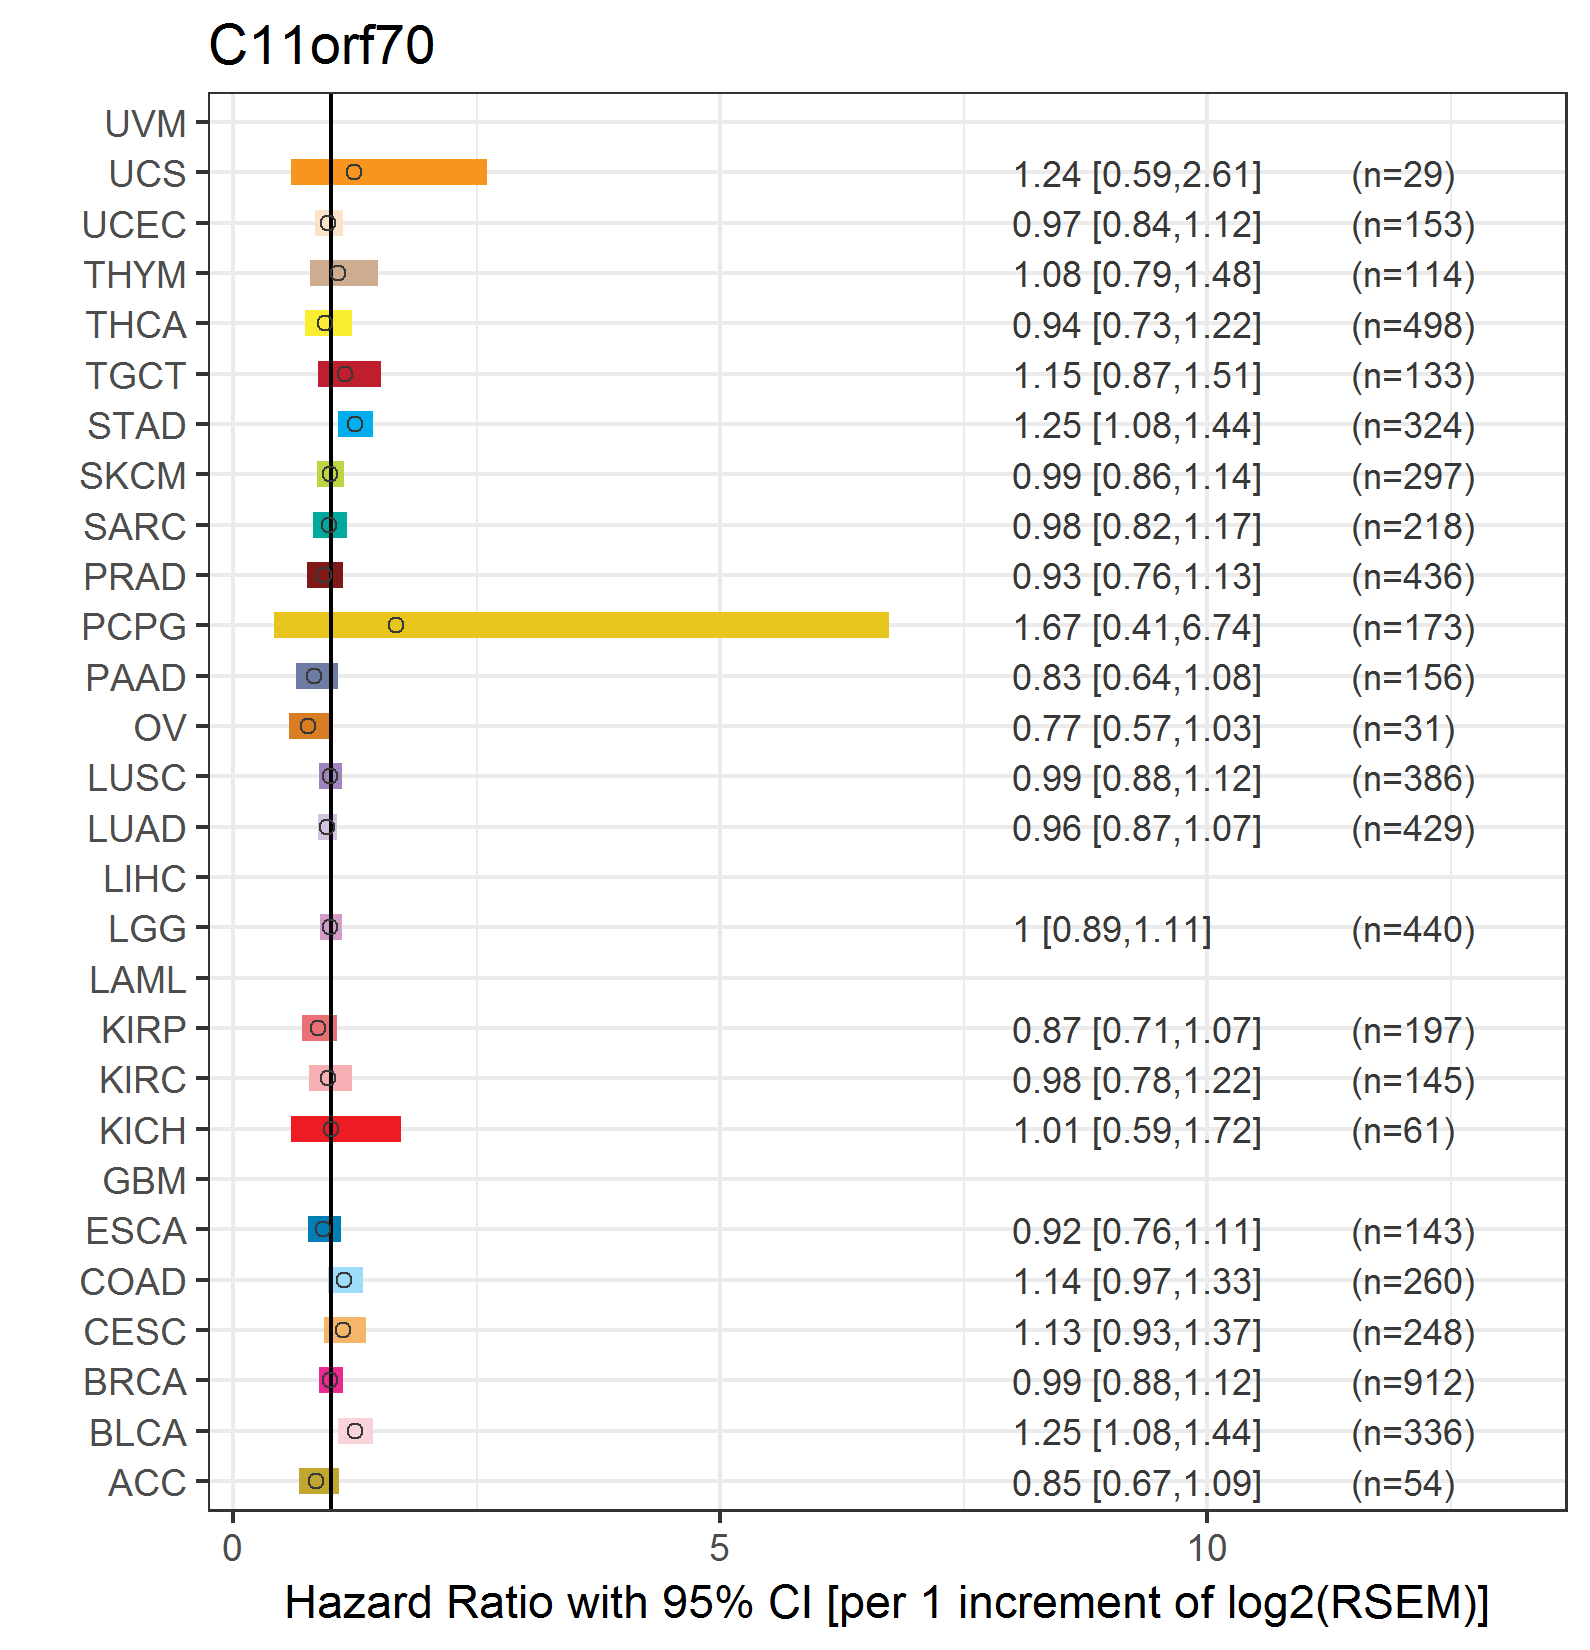
| Forest plot of Cox proportional hazard ratio (HR) and 95% CI of relapse free survival (RFS) using 28 cancer types (TCGA IlluminaHiSeq_RNASeqV2, pan-cancer normalized log2(norm_counts+1) data, version 2016-08-16) (TCGA clinicalMatrix, phenotype data, version 2016-04-27) * Click on the image enlarge it in a new window. |
 |
| Top |
| TissGeneClin for C11orf70 |
| TissGeneDrug for C11orf70 |
| Drug information targeting TissGene (DrugBank Version 5.0.6, 2017-04-01) |
| DrugBank ID | Drug name | Drug activity | Drug type | Drug status |
| Top |
| TissGeneDisease for C11orf70 |
| Disease information associated with TissGene (DisGeNet, 2016-06-01) |
| Disease ID | Disease name | # pubmeds | Source |
|
Copyright 2016-Present - The University of Texas Health Science Center at Houston (UTHealth) Web File Viewing | How to Report, Fraud, Waste and Abuse | State of Texas | Statewide Search | Texas Homeland Security | Site Policies |