 |
| |
| |
| |
| |
| |
| |
|

| TissGeneSummary for ATCAY |
 Gene summary Gene summary |
| Basic gene information | Gene symbol | ATCAY |
| Gene name | ataxia, cerebellar, Cayman type | |
| Synonyms | BNIP-H|CLAC | |
| Cytomap | UCSC genome browser: 19p13.3 | |
| Type of gene | protein-coding | |
| RefGenes | NM_033064.4, | |
| Description | BNIP-2-homolgyBNIP-2-homologyCayman ataxiaataxia cayman type proteincaytaxin | |
| Modification date | 20141207 | |
| dbXrefs | MIM : 608179 | |
| HGNC : HGNC | ||
| Ensembl : ENSG00000167654 | ||
| HPRD : 10491 | ||
| Vega : OTTHUMG00000181836 | ||
| Protein | UniProt: go to UniProt's Cross Reference DB Table | |
| Expression | CleanEX: HS_ATCAY | |
| BioGPS: 85300 | ||
| Pathway | NCI Pathway Interaction Database: ATCAY | |
| KEGG: ATCAY | ||
| REACTOME: ATCAY | ||
| Pathway Commons: ATCAY | ||
| Context | iHOP: ATCAY | |
| ligand binding site mutation search in PubMed: ATCAY | ||
| UCL Cancer Institute: ATCAY | ||
| Assigned class in TissGDB* | C | |
| Included tissue-specific gene expression resources | HPA,TiGER | |
| Specific-tissues in normal samples (assigned by TissGDB using HPA, TiGER, and GTEx) | Brain | |
| Cancer types related to the specific-tissues in cancer samples (assigned by TissGDB using TCGA) | GBM,LGG | |
| Reference showing the relevant tissue of ATCAY | ||
| Description by TissGene annotations | Protective TissGene in RFS | |
| * Class A consists of genes with literature evidence and is part of the cTissGenes. Class B consists of only cTissGenes without additional evidence. The remaining genes belong to Class C. |
| Gene ontology having evidence of Inferred from Direct Assay (IDA) from Entrez |
| GO ID | GO term | PubMed ID | GO:0032880 | regulation of protein localization | 16899818 | GO:2000212 | negative regulation of glutamate metabolic process | 16899818 | GO:0032880 | regulation of protein localization | 16899818 | GO:2000212 | negative regulation of glutamate metabolic process | 16899818 |
| Top |
| TissGeneExp for ATCAY |
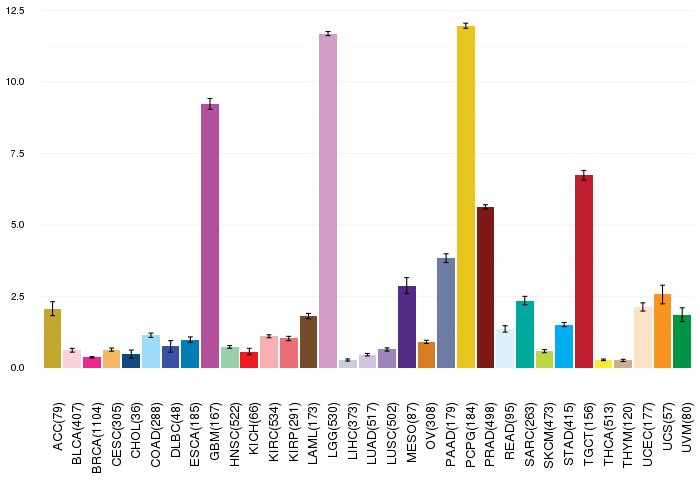
| Gene expressions across 28 cancer types (X-axis: cancer type and Y-axis: log2(norm_counts+1)) (TCGA IlluminaHiSeq_RNASeqV2, pan-cancer normalized log2(norm_counts+1) data, version 2016-08-16) |
 |
| Gene isoform expressions across 28 cancer types (X-axis: cancer type and Y-axis: log2(norm_counts+1)) (TCGA pan-cancer tcga_rsem_isoform_tpm, version 2016-09-01) |
 |
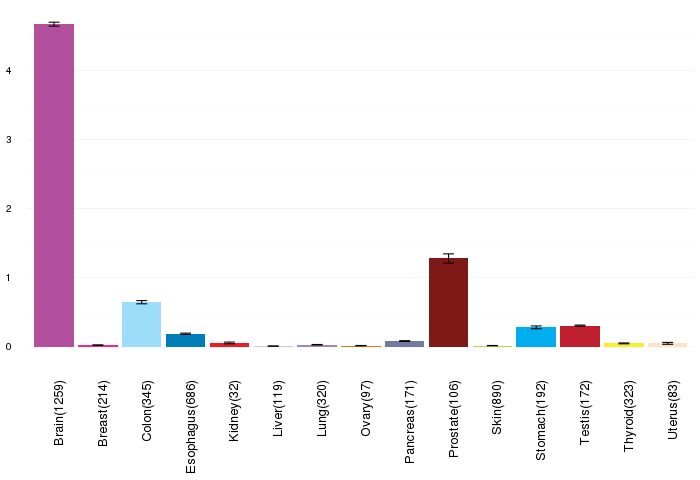
| Gene expressions across normal tissues of GTEx data (GTEx GTEx_Analysis_v6_RNA-seq_RNA-SeQCv1.1.8_gene_rpkm.gct) - Here, we shows the matched tissue types only among our 28 cancer types. |
 |
| Different expressions across 14 cancer types with more than 10 samples between matched tumors and normals (X-axis: cancer type and Y-axis: log2(norm_counts+1)) (TCGA IlluminaHiSeq_RNASeqV2, pan-cancer normalized log2(norm_counts+1) data, version 2016-08-16) |
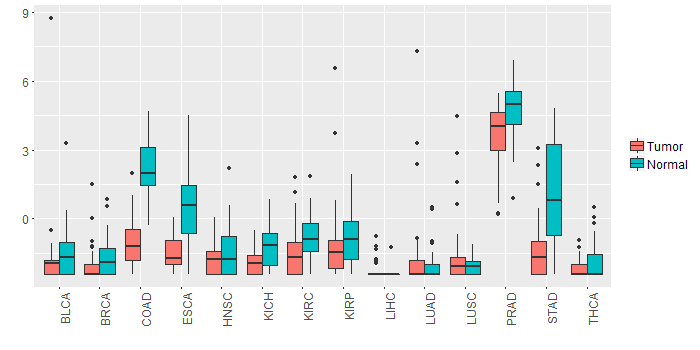 |
| - Significantly differentially expressed cancer types and information. (|Fold change|>1 and FDR<0.05) |
| Cancer type | Mean(exp) in tumor | Mean(exp) in matched normal | Log2FC | P-val. | FDR |
| PRAD | 3.710931701 | 4.842895162 | -1.131963462 | 1.64E-05 | 8.49E-05 |
| COAD | -1.051189453 | 2.081660547 | -3.13285 | 1.28E-12 | 3.34E-11 |
| STAD | -1.307126472 | 1.052461028 | -2.3595875 | 1.35E-05 | 0.000148105 |
| Top |
| TissGene-miRNA for ATCAY |
| Significantly anti-correlated miRNAs of TissGene across 28 cancer types (Gene-miRNA relations from TargetScanHuman Relsease 7.1, Conserved_Site_Context_Scores.txt.zip, 06.01.2016) (TCGA IlluminaHiSeq_miRNASeq, log2(RPM+1) data, version 2016-11-21) (TCGA IlluminaHiSeq_RNASeqV2, log2(normalized_count+1) data, version 2016-08-16) (Spearman’s Rank Correlation (p-value<0.05 and coefficient<-0.25)) |
| Cancer type | miRNA id | miRNA accession | P-val. | Coeff. | # samples |
| Top |
| TissGeneMut for ATCAY |
| TissGeneSNV for ATCAY |
| nsSNV counts per each loci. Different colors of circles represent different cancer types. Circle size denotes number of samples. (TCGA somatic mutation (SNPs and small INDELs) data, version 2016-04-25) * Click on the image to enlarge it in a new window. |
 |
 |
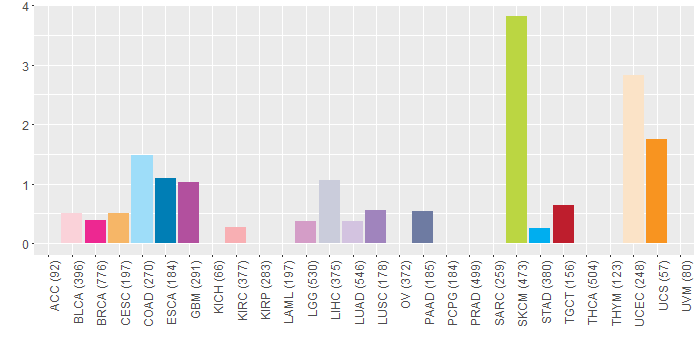
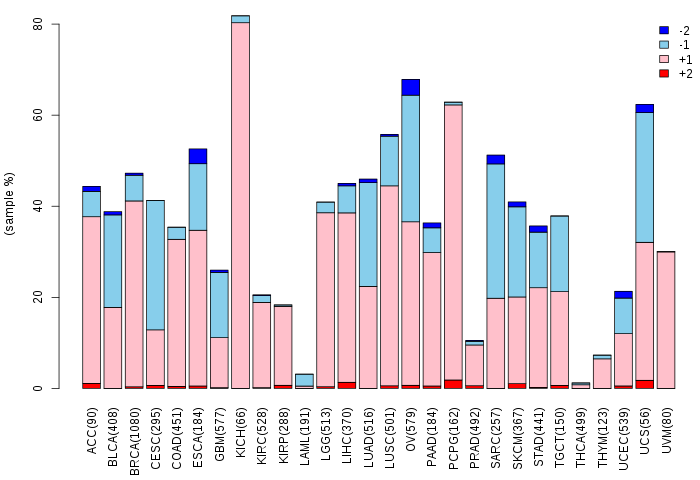
| Somatic nucleotide variants of TissGene across 28 cancer types (X-axis: cancer type and Y-axis: % of mutated samples) The numbers in parentheses are numbers of samples with mutation (nsSNVs). (TCGA somatic mutation (SNPs and small INDELs) data, version 2016-04-25) |
 |
| - nsSNVs sorted by frequency. |
| AAchange | Cancer type | # samples |
| p.E115K | SKCM | 3 |
| p.R58L | TGCT | 1 |
| p.M175T | UCEC | 1 |
| p.R242Q | SKCM | 1 |
| p.D258N | UCEC | 1 |
| p.D92N | SKCM | 1 |
| p.R285H | COAD | 1 |
| p.E347Q | HNSC | 1 |
| p.Y254* | LUAD | 1 |
| p.V280L | CHOL | 1 |
| p.S81F | SKCM | 1 |
| p.T149M | GBM | 1 |
| p.A65V | KIRC | 1 |
| p.R165H | BRCA | 1 |
| p.G181R | SKCM | 1 |
| p.G248R | SKCM | 1 |
| p.G237S | COAD | 1 |
| p.M244T | BRCA | 1 |
| p.A330V | PAAD | 1 |
| p.E333Q | LUAD | 1 |
| p.R248Q | GBM | 1 |
| p.L204F | HNSC | 1 |
| p.A341V | UCEC | 1 |
| p.P131S | SKCM | 1 |
| p.L305P | LIHC | 1 |
| p.K61R | COAD | 1 |
| p.P286S | SKCM | 1 |
| p.E115K | UCEC | 1 |
| p.L343P | LIHC | 1 |
| p.V314I | LGG | 1 |
| p.R152H | ESCA | 1 |
| p.E99K | UCS | 1 |
| p.L174M | LUSC | 1 |
| p.D121N | SKCM | 1 |
| p.D86N | SKCM | 1 |
| p.G55* | BLCA | 1 |
| p.A155T | GBM | 1 |
| p.V299A | BLCA | 1 |
| p.M10T | CESC | 1 |
| p.S147I | HNSC | 1 |
| p.H180N | HNSC | 1 |
| p.E30Q | ESCA | 1 |
| p.R278W | LIHC | 1 |
| p.G237D | SKCM | 1 |
| p.E108K | SKCM | 1 |
| p.N114K | SKCM | 1 |
| p.A135V | STAD | 1 |
| p.M181T | UCEC | 1 |
| p.E364K | SKCM | 1 |
| p.D304Y | UCEC | 1 |
| p.M175I | SKCM | 1 |
| p.R262Q | UCEC | 1 |
| p.P66T | COAD | 1 |
| p.D105N | READ | 1 |
| p.A135T | LGG | 1 |
| p.E326K | SKCM | 1 |
| p.F292L | UCEC | 1 |
| p.S78A | BRCA | 1 |
| p.S359C | HNSC | 1 |
| p.G111E | SKCM | 1 |
| p.V193I | LIHC | 1 |
| Top |
| TissGeneCNV for ATCAY |
| Copy number variations of TissGene across 28 cancer types (X-axis: cancer type and Y-axis: % of CNV samples) (TCGA Gistic2_CopyNumber_Gistic2_all_data_by_genes, Gistic2 copy number data, version 2016-08-16) |
 |
| Top |
| TissGeneFusions for ATCAY |
| Fusion genes including TissGene (ChimerDB 3.0, 2016-12-01 and TCGA fusion Portal 2015-12-01) |
| Database | Src | Cancer type | Sample | Fusion gene | ORF | 5'-gene BP | 3'-gene BP |
| Chimerdb3.0 | ChiTaRs | NA | BF528840 | ATCAY-ATCAY | chr19:3927319 | chr19:3927402 | |
| Chimerdb3.0 | ChiTaRs | NA | AX747461 | ATCAY-ATCAY | chr19:3927687 | chr19:3924666 | |
| Chimerdb3.0 | ChiTaRs | NA | BF527108 | ATCAY-ATCAY | chr19:3924891 | chr19:3924865 | |
| Chimerdb3.0 | FusionScan | ESCA | TCGA-JY-A6FD-01A | PPP2R2A-ATCAY | Out-of-Frame | chr8:26151256 | chr19:3913755 |
| Top |
| TissGeneNet for ATCAY |
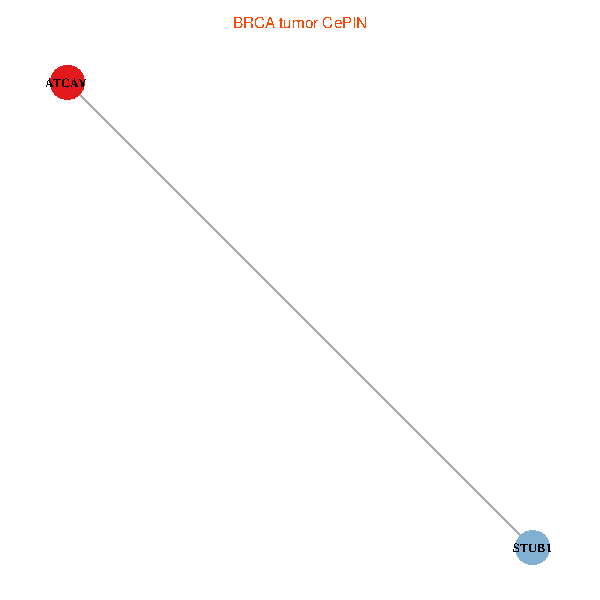
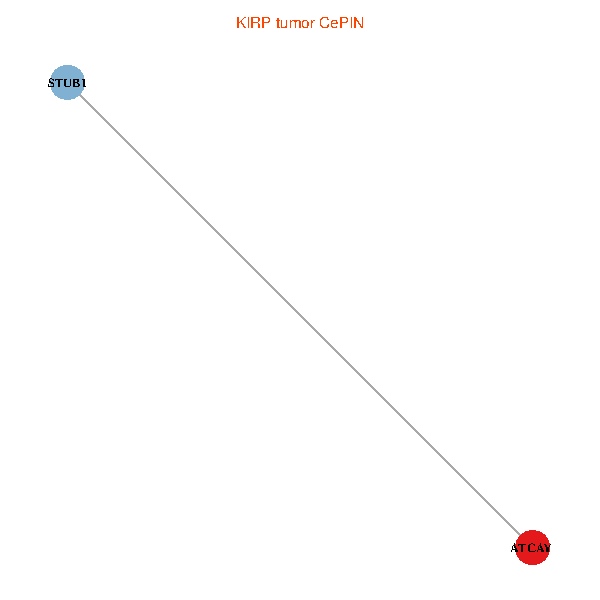
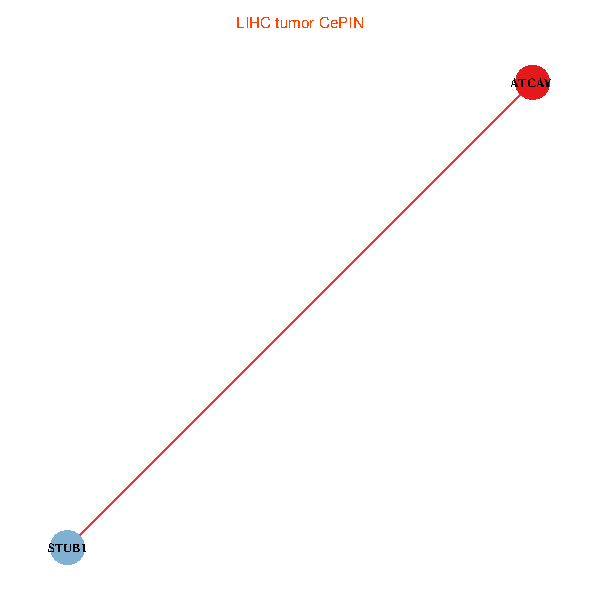
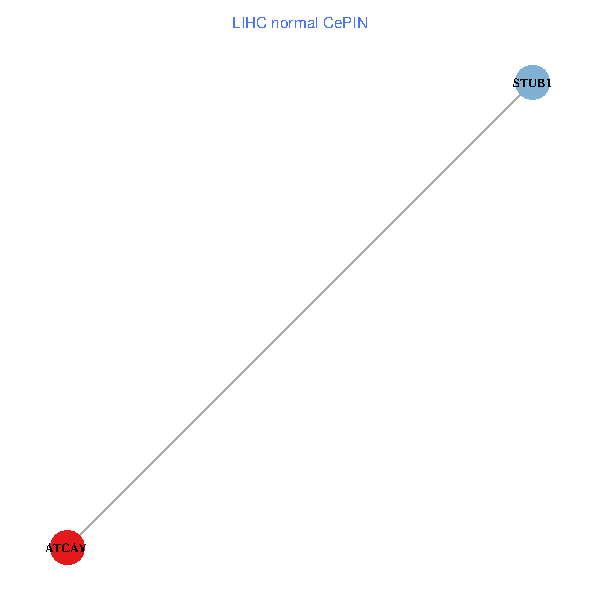
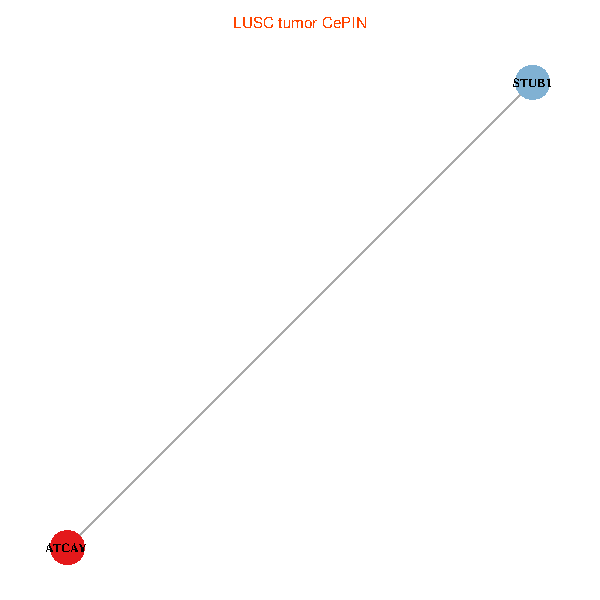
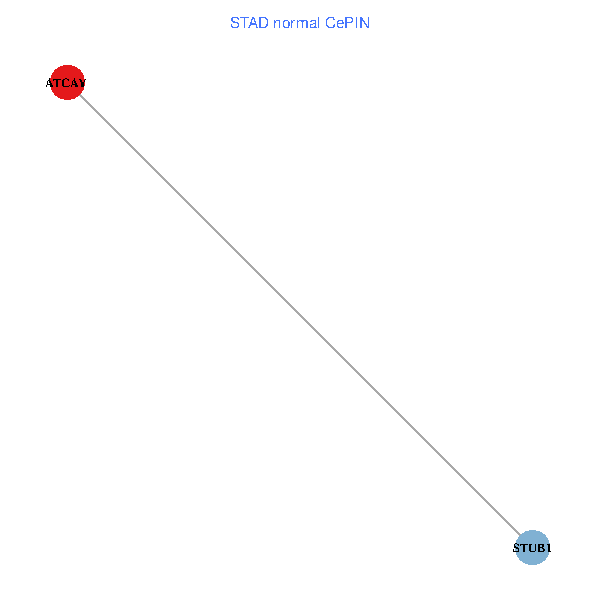
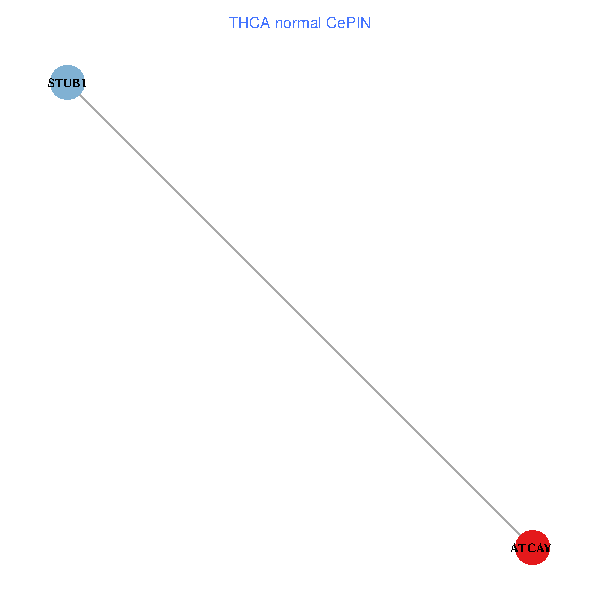
| Co-expressed gene networks based on protein-protein interaction data (CePIN) (TCGA IlluminaHiSeq_RNASeqV2, pan-cancer normalized log2(norm_counts+1) data, version 2016-08-16) (PINA2 ppi data) |
| BRCA (tumor) | BRCA (normal) |
| ATCAY, STUB1 (tumor) | ATCAY, STUB1 (normal) |
 |  |
| COAD (tumor) | COAD (normal) |
| ATCAY, STUB1 (tumor) | ATCAY, STUB1 (normal) |
 |  |
| HNSC (tumor) | HNSC (normal) |
| ATCAY, STUB1 (tumor) | ATCAY, STUB1 (normal) |
 |  |
| KICH (tumor) | KICH (normal) |
| ATCAY, STUB1 (tumor) | ATCAY, STUB1 (normal) |
 |  |
| KIRC (tumor) | KIRC (normal) |
| ATCAY, STUB1 (tumor) | ATCAY, STUB1 (normal) |
 |  |
| KIRP (tumor) | KIRP (normal) |
| ATCAY, STUB1 (tumor) | ATCAY, STUB1 (normal) |
 |  |
| LIHC (tumor) | LIHC (normal) |
| ATCAY, STUB1 (tumor) | ATCAY, STUB1 (normal) |
 |  |
| LUAD (tumor) | LUAD (normal) |
| ATCAY, STUB1 (tumor) | ATCAY, STUB1 (normal) |
 |  |
| LUSC (tumor) | LUSC (normal) |
| ATCAY, STUB1 (tumor) | ATCAY, STUB1 (normal) |
 |  |
| PRAD (tumor) | PRAD (normal) |
| ATCAY, STUB1 (tumor) | ATCAY, STUB1 (normal) |
 |  |
| STAD (tumor) | STAD (normal) |
| ATCAY, STUB1 (tumor) | ATCAY, STUB1 (normal) |
 |  |
| THCA (tumor) | THCA (normal) |
| ATCAY, STUB1 (tumor) | ATCAY, STUB1 (normal) |
 |  |
| Top |
| TissGeneProg for ATCAY |
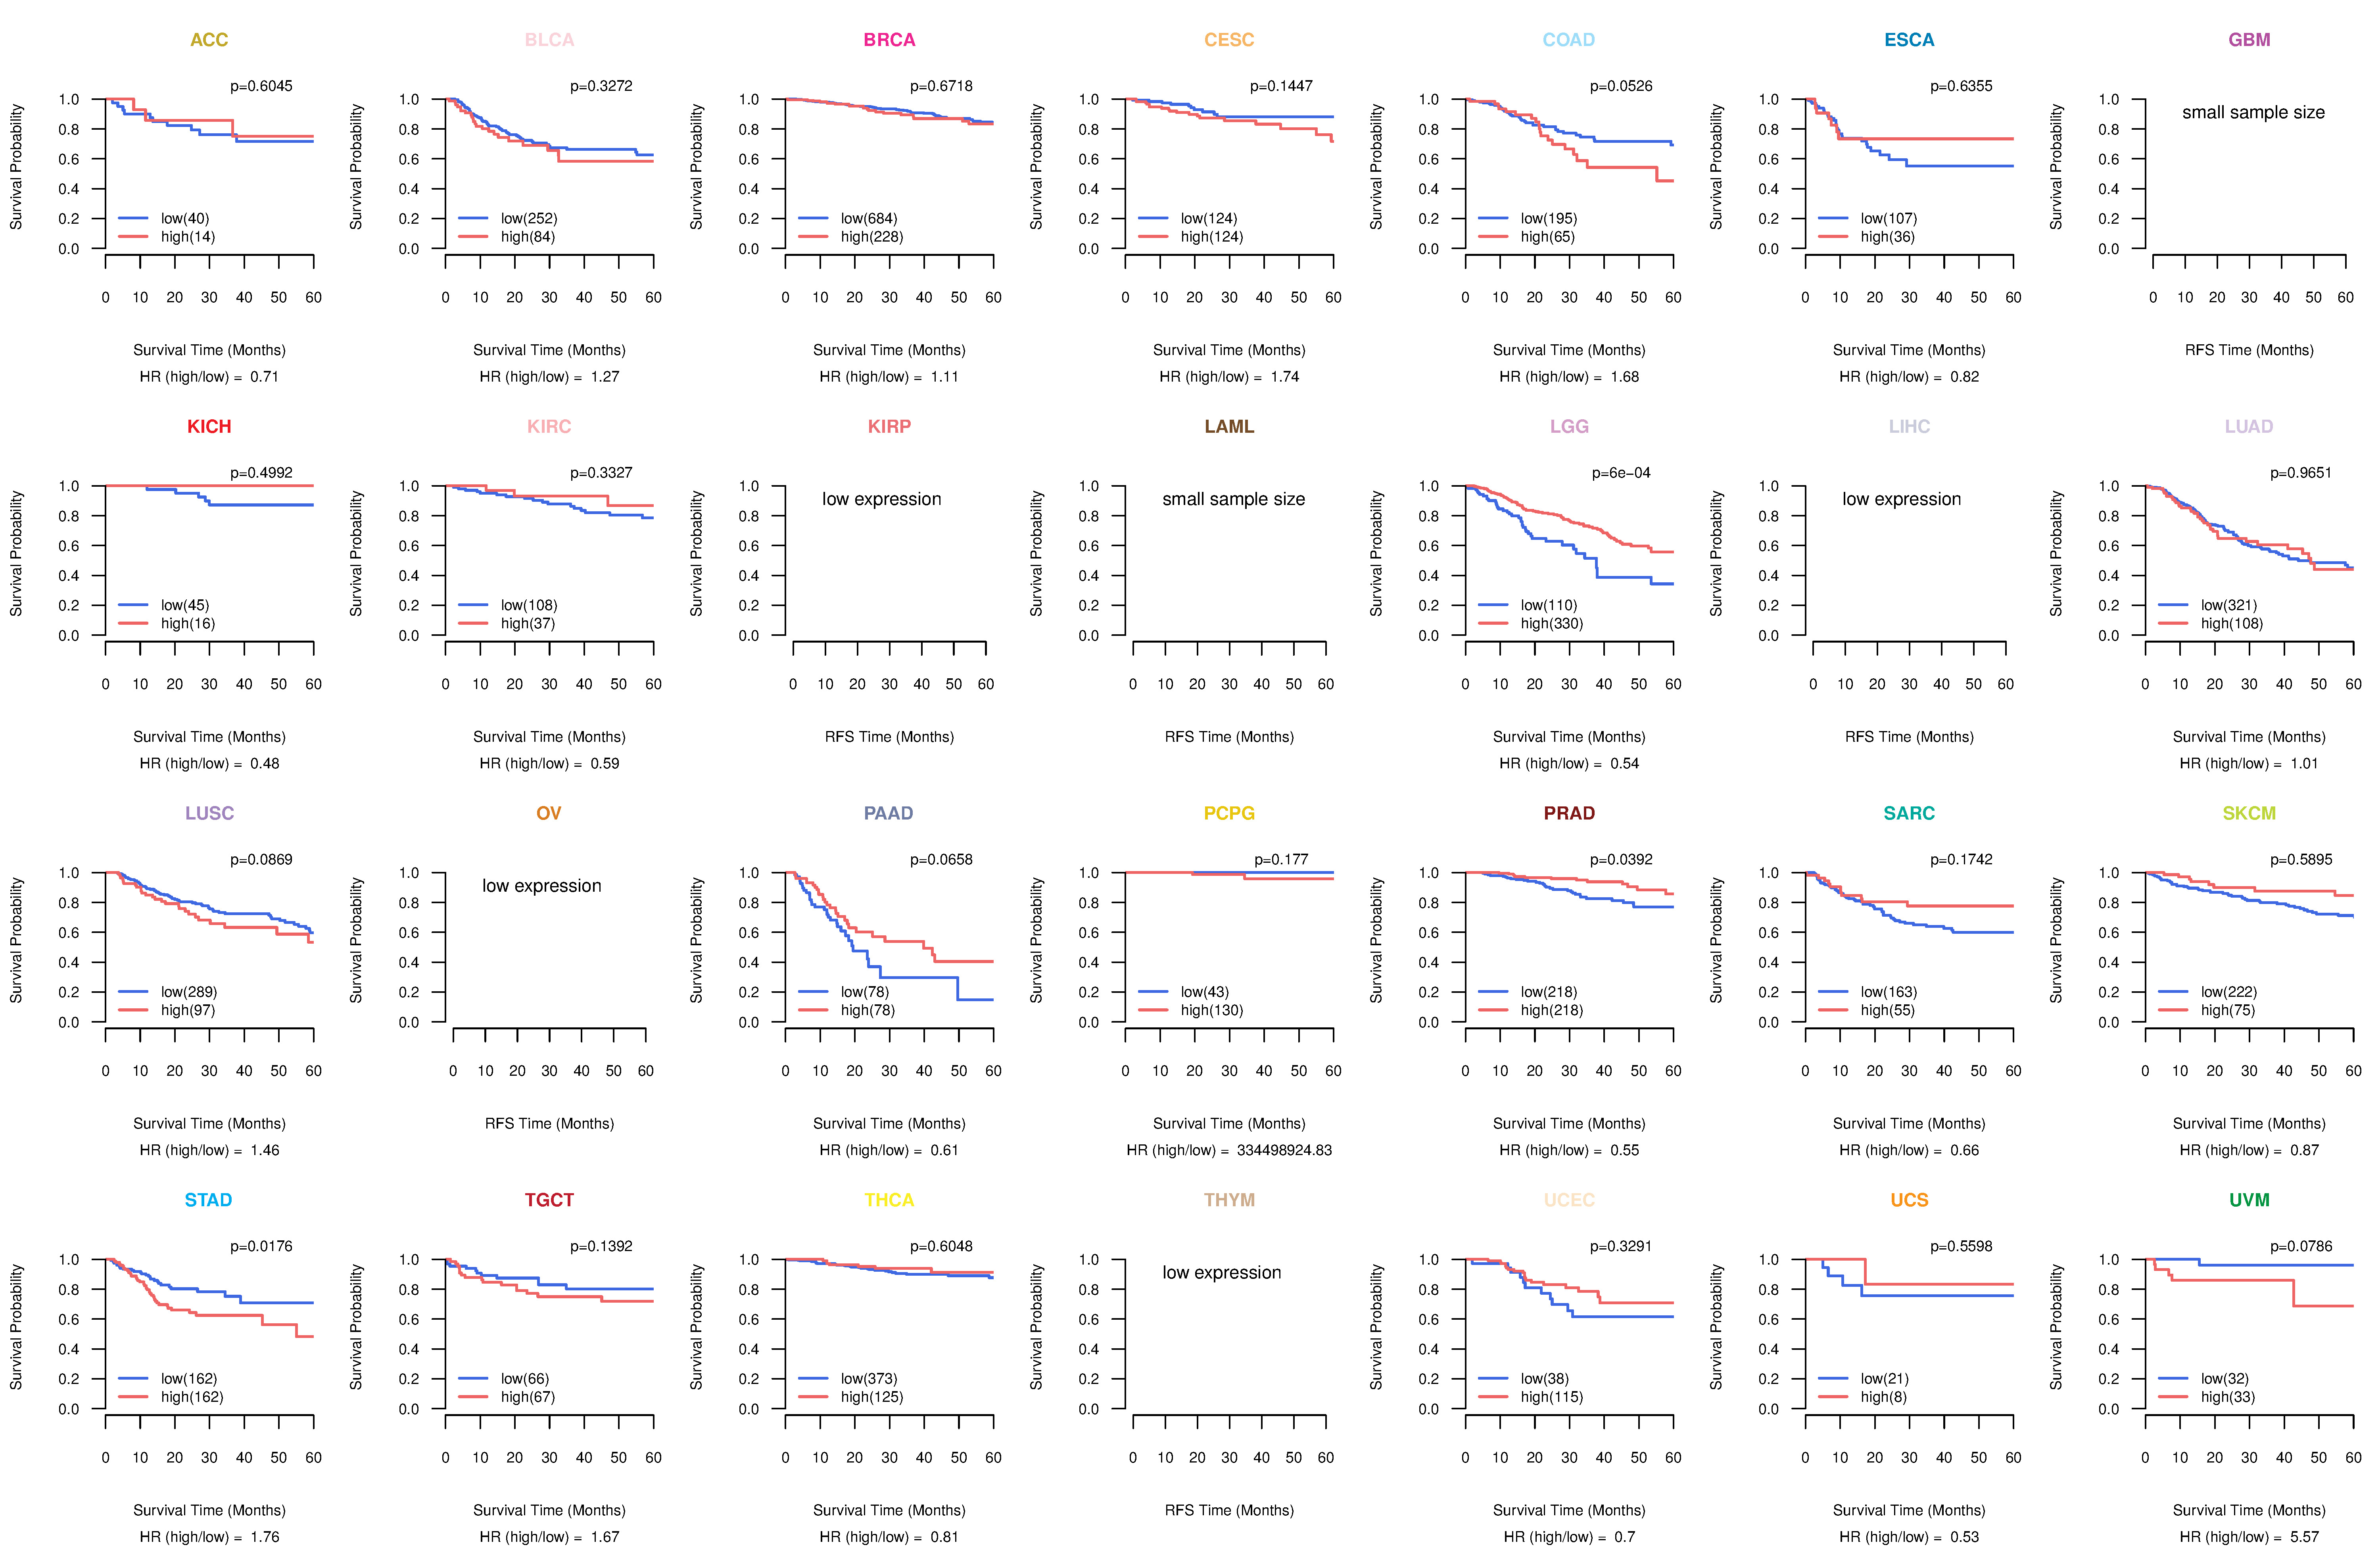
| Kaplan-Meier plots with logrank tests of overall survival (OS) using 28 cancer types (TCGA IlluminaHiSeq_RNASeqV2, pan-cancer normalized log2(norm_counts+1) data, version 2016-08-16) (TCGA clinicalMatrix, phenotype data, version 2016-04-27) * Click on the image to enlarge it in a new window. |
 |
| Kaplan-Meier plots with logrank test of relapse free survival (RFS) using 28 cancer types (TCGA IlluminaHiSeq_RNASeqV2, pan-cancer normalized log2(norm_counts+1) data, version 2016-08-16) (TCGA clinicalMatrix, phenotype data, version 2016-04-27) * Click on the image enlarge it in a new window. |
 |
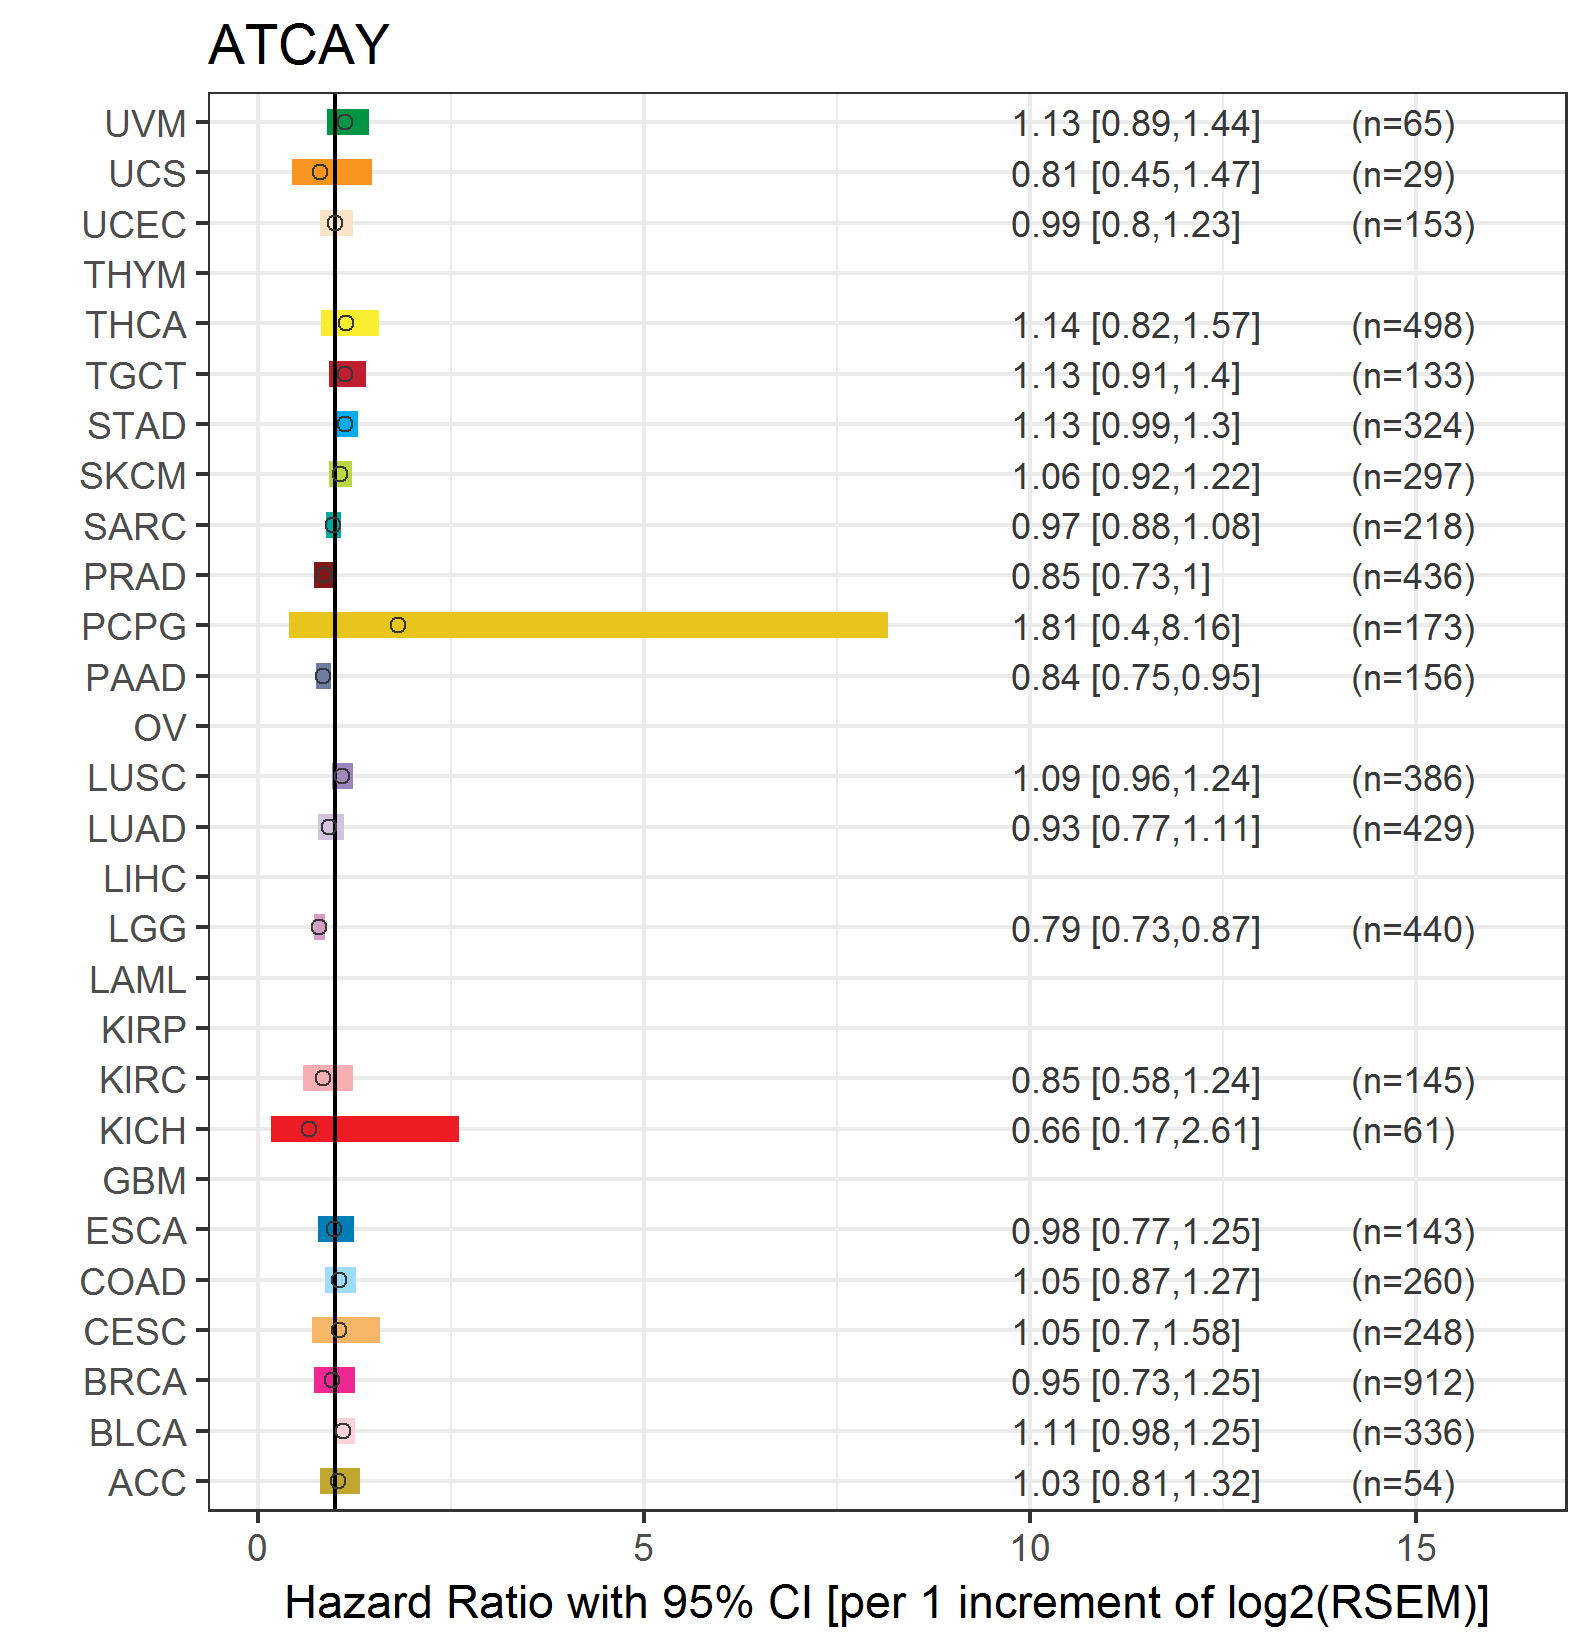
| Forest plot of Cox proportional hazard ratio (HR) and 95% CI of overall survival (OS) using 28 cancer types (TCGA IlluminaHiSeq_RNASeqV2, pan-cancer normalized log2(norm_counts+1) data, version 2016-08-16) (TCGA clinicalMatrix, phenotype data, version 2016-04-27) * Click on the image enlarge it in a new window. |
 |
| Forest plot of Cox proportional hazard ratio (HR) and 95% CI of relapse free survival (RFS) using 28 cancer types (TCGA IlluminaHiSeq_RNASeqV2, pan-cancer normalized log2(norm_counts+1) data, version 2016-08-16) (TCGA clinicalMatrix, phenotype data, version 2016-04-27) * Click on the image enlarge it in a new window. |
 |
| Top |
| TissGeneClin for ATCAY |
| TissGeneDrug for ATCAY |
| Drug information targeting TissGene (DrugBank Version 5.0.6, 2017-04-01) |
| DrugBank ID | Drug name | Drug activity | Drug type | Drug status |
| Top |
| TissGeneDisease for ATCAY |
| Disease information associated with TissGene (DisGeNet, 2016-06-01) |
| Disease ID | Disease name | # pubmeds | Source |
| umls:C0004134 | Ataxia | 3 | BeFree |
| umls:C0013421 | Dystonia | 3 | BeFree,RGD |
| umls:C0234366 | Ataxic | 2 | BeFree |
| umls:C0333463 | Senile Plaques | 2 | BeFree |
| umls:C0393593 | Dystonia Disorders | 2 | BeFree |
| umls:C2936349 | Plaque, Amyloid | 2 | BeFree |
| umls:C0004936 | Mental disorders | 1 | BeFree |
| umls:C0007758 | Cerebellar Ataxia | 1 | BeFree |
| umls:C0007760 | Cerebellar Diseases | 1 | BeFree |
| umls:C0025362 | Mental Retardation | 1 | BeFree |
| umls:C0027765 | nervous system disorder | 1 | BeFree |
| umls:C0031511 | Pheochromocytoma | 1 | BeFree |
| umls:C0036341 | Schizophrenia | 1 | LHGDN |
| umls:C0079504 | Hermanski-Pudlak Syndrome | 1 | BeFree |
| umls:C1832585 | CEREBELLAR ATAXIA, CAYMAN TYPE | 1 | CTD_human,MGD,ORPHANET,UNIPROT |
|
Copyright 2016-Present - The University of Texas Health Science Center at Houston (UTHealth) Web File Viewing | How to Report, Fraud, Waste and Abuse | State of Texas | Statewide Search | Texas Homeland Security | Site Policies |