 |
| |
| |
| |
| |
| |
| |
|

| TissGeneSummary for TMEFF1 |
 Gene summary Gene summary |
| Basic gene information | Gene symbol | TMEFF1 |
| Gene name | transmembrane protein with EGF-like and two follistatin-like domains 1 | |
| Synonyms | C9orf2|CT120.1|H7365|TR-1 | |
| Cytomap | UCSC genome browser: 9q31 | |
| Type of gene | protein-coding | |
| RefGenes | NM_003692.4, | |
| Description | cancer/testis antigen family 120, member 1tomoregulin-1transmembrane protein with EGF-like and one follistatin-like domain | |
| Modification date | 20141207 | |
| dbXrefs | MIM : 603421 | |
| HGNC : HGNC | ||
| Ensembl : ENSG00000241697 | ||
| HPRD : 04570 | ||
| Vega : OTTHUMG00000020367 | ||
| Protein | UniProt: go to UniProt's Cross Reference DB Table | |
| Expression | CleanEX: HS_TMEFF1 | |
| BioGPS: 8577 | ||
| Pathway | NCI Pathway Interaction Database: TMEFF1 | |
| KEGG: TMEFF1 | ||
| REACTOME: TMEFF1 | ||
| Pathway Commons: TMEFF1 | ||
| Context | iHOP: TMEFF1 | |
| ligand binding site mutation search in PubMed: TMEFF1 | ||
| UCL Cancer Institute: TMEFF1 | ||
| Assigned class in TissGDB* | C | |
| Included tissue-specific gene expression resources | HPA,GTEx | |
| Specific-tissues in normal samples (assigned by TissGDB using HPA, TiGER, and GTEx) | BrainTestis | |
| Cancer types related to the specific-tissues in cancer samples (assigned by TissGDB using TCGA) | GBM,LGGTGCT | |
| Reference showing the relevant tissue of TMEFF1 | ||
| Description by TissGene annotations | Protective TissGene in OS Cancer gene | |
| * Class A consists of genes with literature evidence and is part of the cTissGenes. Class B consists of only cTissGenes without additional evidence. The remaining genes belong to Class C. |
| Gene ontology having evidence of Inferred from Direct Assay (IDA) from Entrez |
| GO ID | GO term | PubMed ID |
| Top |
| TissGeneExp for TMEFF1 |
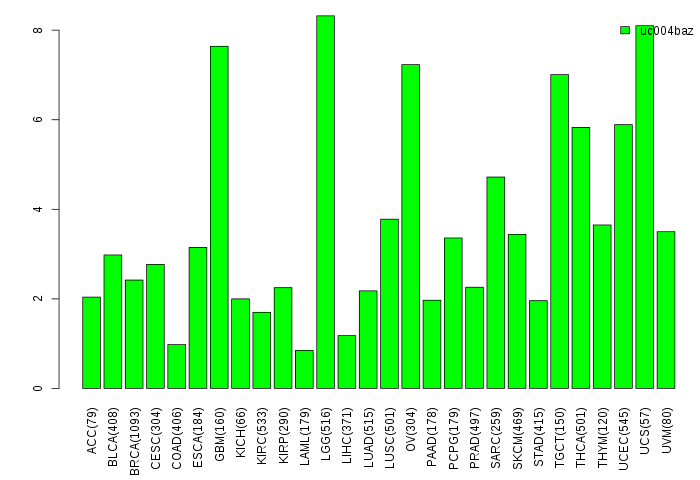
| Gene expressions across 28 cancer types (X-axis: cancer type and Y-axis: log2(norm_counts+1)) (TCGA IlluminaHiSeq_RNASeqV2, pan-cancer normalized log2(norm_counts+1) data, version 2016-08-16) |
 |
| Gene isoform expressions across 28 cancer types (X-axis: cancer type and Y-axis: log2(norm_counts+1)) (TCGA pan-cancer tcga_rsem_isoform_tpm, version 2016-09-01) |
 |
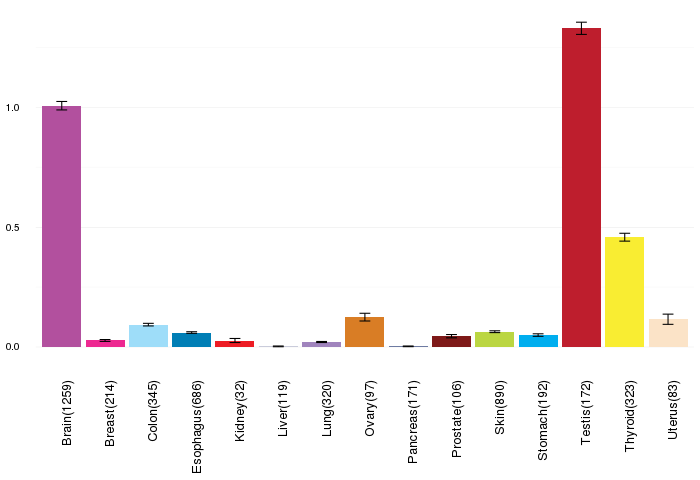
| Gene expressions across normal tissues of GTEx data (GTEx GTEx_Analysis_v6_RNA-seq_RNA-SeQCv1.1.8_gene_rpkm.gct) - Here, we shows the matched tissue types only among our 28 cancer types. |
 |
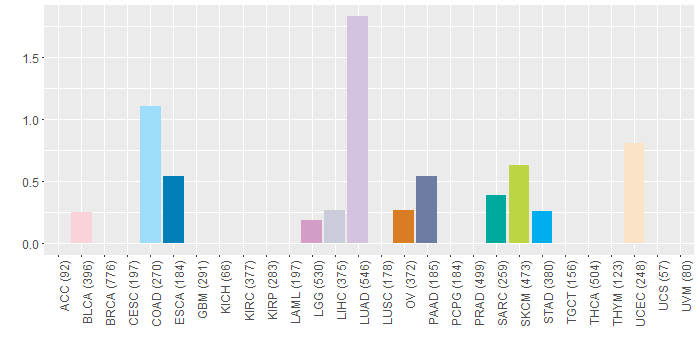
| Different expressions across 14 cancer types with more than 10 samples between matched tumors and normals (X-axis: cancer type and Y-axis: log2(norm_counts+1)) (TCGA IlluminaHiSeq_RNASeqV2, pan-cancer normalized log2(norm_counts+1) data, version 2016-08-16) |
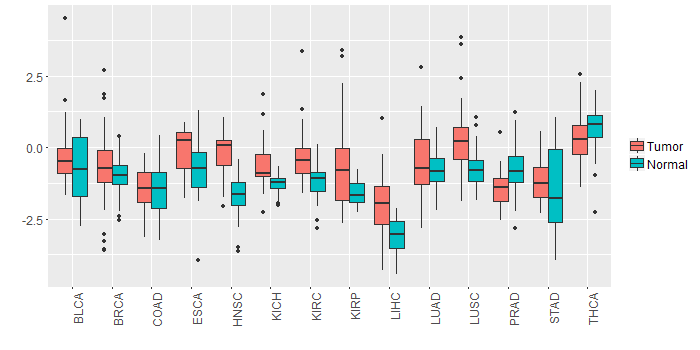 |
| - Significantly differentially expressed cancer types and information. (|Fold change|>1 and FDR<0.05) |
| Cancer type | Mean(exp) in tumor | Mean(exp) in matched normal | Log2FC | P-val. | FDR |
| LIHC | -2.017839025 | -3.121677025 | 1.103838 | 2.29E-09 | 2.31E-08 |
| HNSC | -0.189305956 | -1.691064095 | 1.50175814 | 1.89E-15 | 1.85E-13 |
| LUSC | 0.259999288 | -0.785765418 | 1.045764706 | 6.01E-08 | 1.74E-07 |
| Top |
| TissGene-miRNA for TMEFF1 |
| Significantly anti-correlated miRNAs of TissGene across 28 cancer types (Gene-miRNA relations from TargetScanHuman Relsease 7.1, Conserved_Site_Context_Scores.txt.zip, 06.01.2016) (TCGA IlluminaHiSeq_miRNASeq, log2(RPM+1) data, version 2016-11-21) (TCGA IlluminaHiSeq_RNASeqV2, log2(normalized_count+1) data, version 2016-08-16) (Spearman’s Rank Correlation (p-value<0.05 and coefficient<-0.25)) |
| Cancer type | miRNA id | miRNA accession | P-val. | Coeff. | # samples |
| Top |
| TissGeneMut for TMEFF1 |
| TissGeneSNV for TMEFF1 |
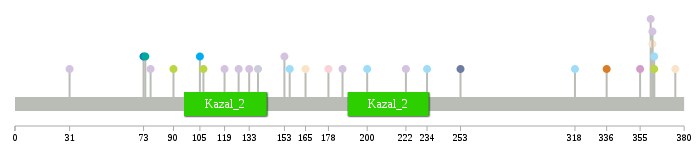
| nsSNV counts per each loci. Different colors of circles represent different cancer types. Circle size denotes number of samples. (TCGA somatic mutation (SNPs and small INDELs) data, version 2016-04-25) * Click on the image to enlarge it in a new window. |
 |
 |
| Somatic nucleotide variants of TissGene across 28 cancer types (X-axis: cancer type and Y-axis: % of mutated samples) The numbers in parentheses are numbers of samples with mutation (nsSNVs). (TCGA somatic mutation (SNPs and small INDELs) data, version 2016-04-25) |
 |
| - nsSNVs sorted by frequency. |
| AAchange | Cancer type | # samples |
| p.D314Y | READ | 1 |
| p.L318F | COAD | 1 |
| p.A127V | LUAD | 1 |
| p.I138T | LIHC | 1 |
| p.R363* | SKCM | 1 |
| p.R362C | UCEC | 1 |
| p.R363Q | COAD | 1 |
| p.R362L | LUAD | 1 |
| p.T375M | UCEC | 1 |
| p.V105I | STAD | 1 |
| p.G361* | LUAD | 1 |
| p.P126T | HNSC | 1 |
| p.Y253H | PAAD | 1 |
| p.E178K | BLCA | 1 |
| p.V186F | LUAD | 1 |
| p.D73E | ESCA | 1 |
| p.C355Y | LGG | 1 |
| p.L119F | LUAD | 1 |
| p.E156D | COAD | 1 |
| p.E90K | SKCM | 1 |
| p.E153* | LUAD | 1 |
| p.K130N | READ | 1 |
| p.R264X | READ | 1 |
| p.K133I | LUAD | 1 |
| p.I222V | LUAD | 1 |
| p.V31L | LUAD | 1 |
| p.V74I | SARC | 1 |
| p.R165I | UCEC | 1 |
| p.H234Q | COAD | 1 |
| p.N200K | COAD | 1 |
| p.Y107H | SKCM | 1 |
| p.C129Y | HNSC | 1 |
| p.C77F | LUAD | 1 |
| p.I336T | OV | 1 |
| Top |
| TissGeneCNV for TMEFF1 |
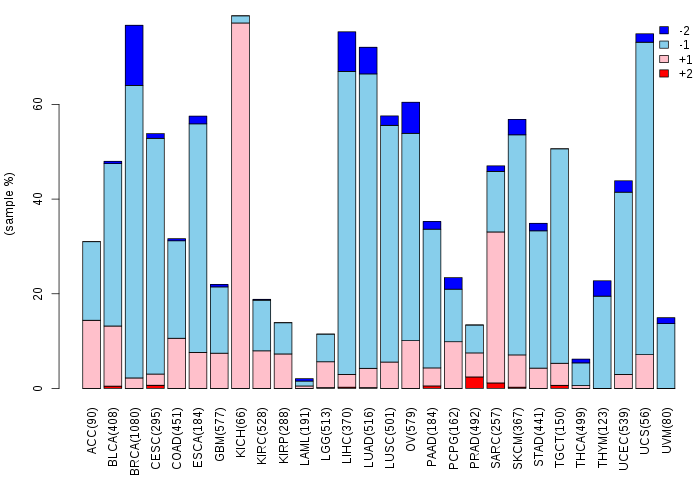
| Copy number variations of TissGene across 28 cancer types (X-axis: cancer type and Y-axis: % of CNV samples) (TCGA Gistic2_CopyNumber_Gistic2_all_data_by_genes, Gistic2 copy number data, version 2016-08-16) |
 |
| Top |
| TissGeneFusions for TMEFF1 |
| Fusion genes including TissGene (ChimerDB 3.0, 2016-12-01 and TCGA fusion Portal 2015-12-01) |
| Database | Src | Cancer type | Sample | Fusion gene | ORF | 5'-gene BP | 3'-gene BP |
| TCGAfusionPortal | PRADA | BRCA | TCGA-B6-A0I9-01A | NIPSNAP3A-TMEFF1 | Out-of-frame | Chr9:107510133 | Chr9:103310026 |
| Top |
| TissGeneNet for TMEFF1 |
| Co-expressed gene networks based on protein-protein interaction data (CePIN) (TCGA IlluminaHiSeq_RNASeqV2, pan-cancer normalized log2(norm_counts+1) data, version 2016-08-16) (PINA2 ppi data) |
| Top |
| TissGeneProg for TMEFF1 |
| Kaplan-Meier plots with logrank tests of overall survival (OS) using 28 cancer types (TCGA IlluminaHiSeq_RNASeqV2, pan-cancer normalized log2(norm_counts+1) data, version 2016-08-16) (TCGA clinicalMatrix, phenotype data, version 2016-04-27) * Click on the image to enlarge it in a new window. |
 |
| Kaplan-Meier plots with logrank test of relapse free survival (RFS) using 28 cancer types (TCGA IlluminaHiSeq_RNASeqV2, pan-cancer normalized log2(norm_counts+1) data, version 2016-08-16) (TCGA clinicalMatrix, phenotype data, version 2016-04-27) * Click on the image enlarge it in a new window. |
 |
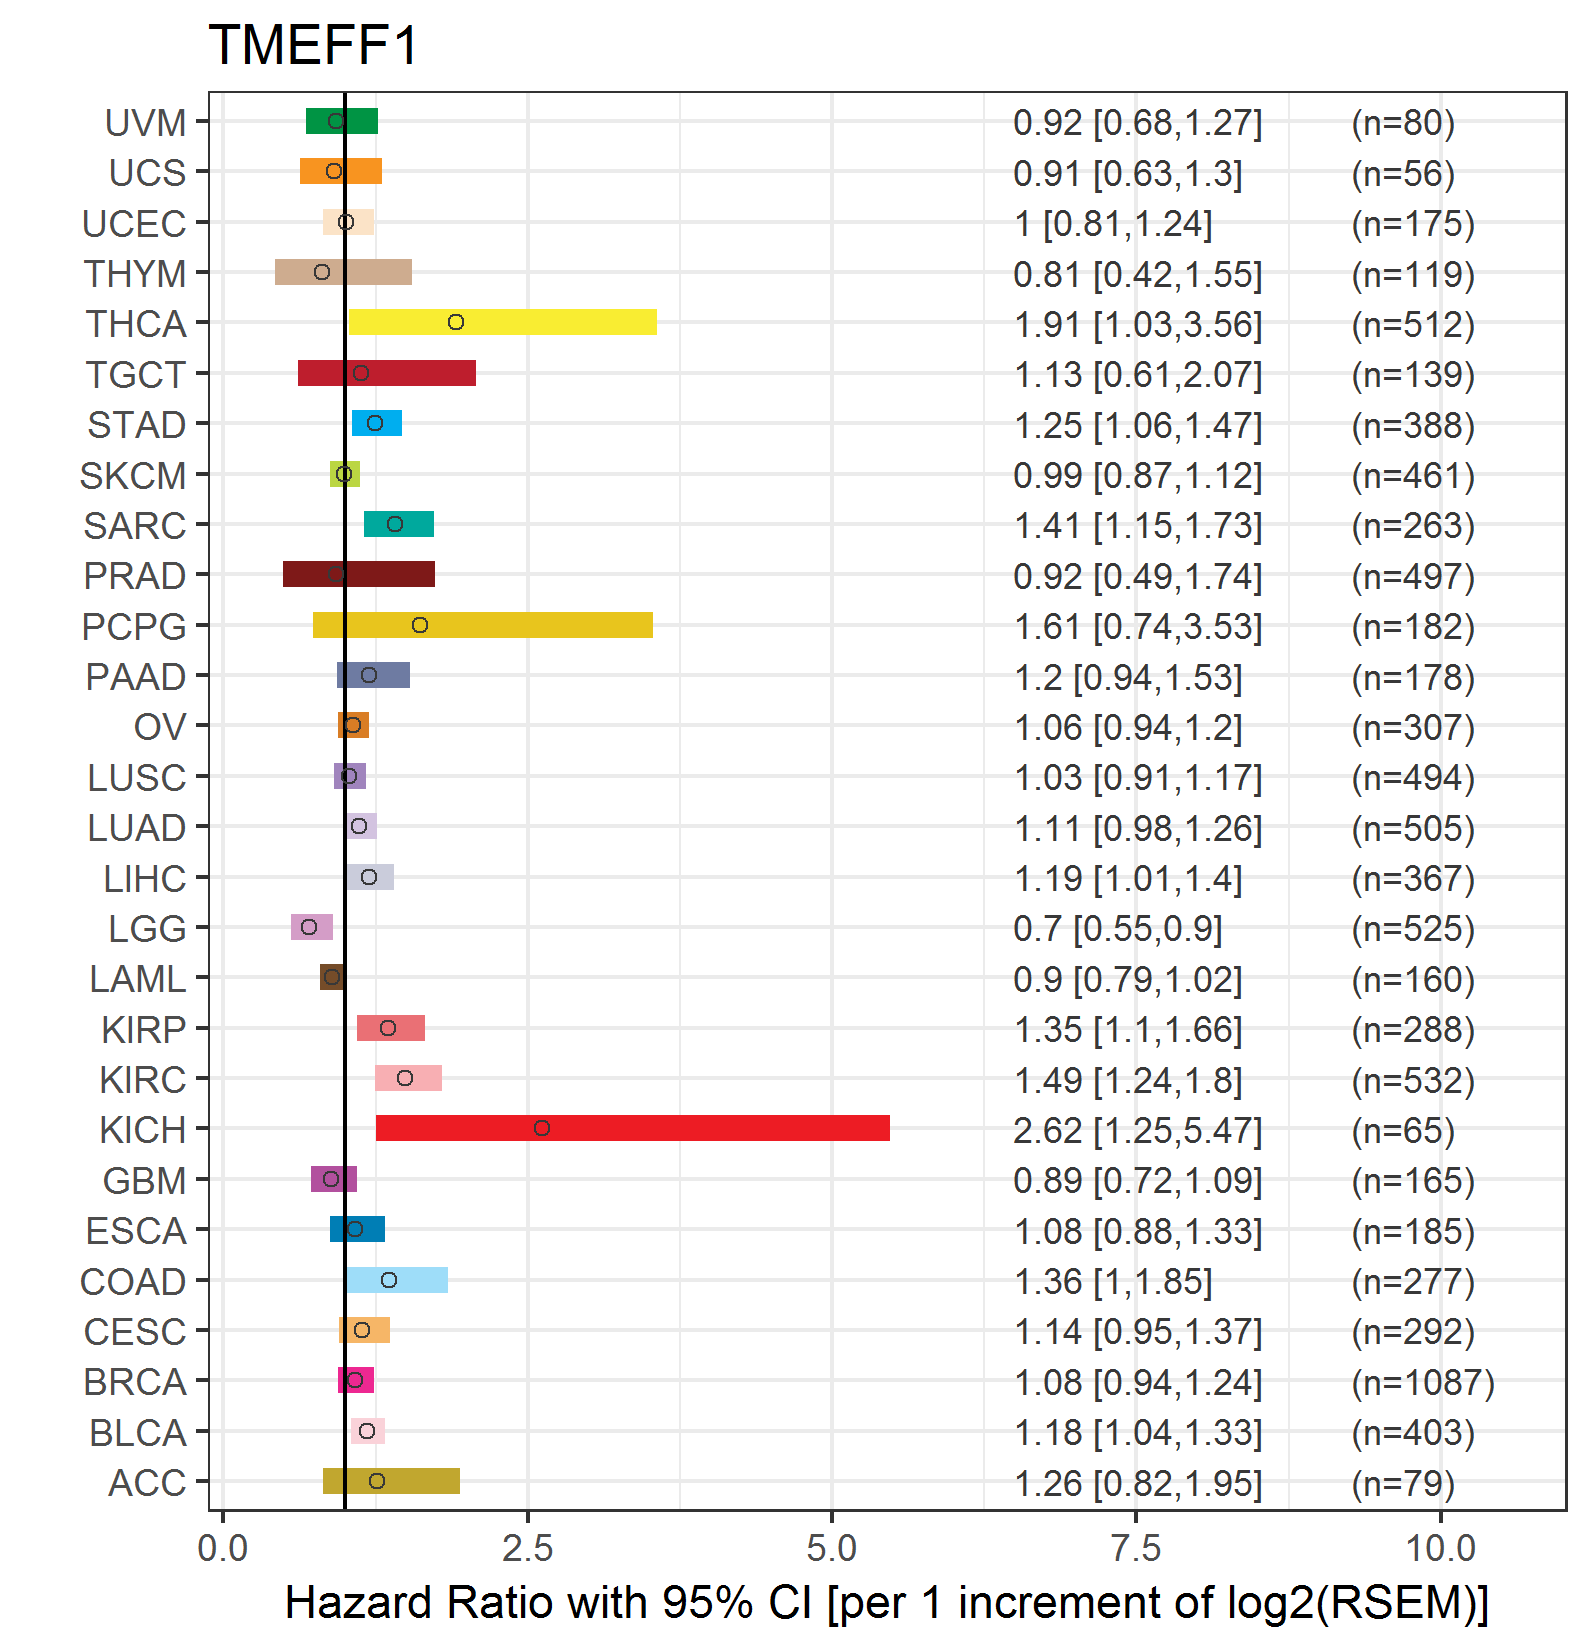
| Forest plot of Cox proportional hazard ratio (HR) and 95% CI of overall survival (OS) using 28 cancer types (TCGA IlluminaHiSeq_RNASeqV2, pan-cancer normalized log2(norm_counts+1) data, version 2016-08-16) (TCGA clinicalMatrix, phenotype data, version 2016-04-27) * Click on the image enlarge it in a new window. |
 |
| Forest plot of Cox proportional hazard ratio (HR) and 95% CI of relapse free survival (RFS) using 28 cancer types (TCGA IlluminaHiSeq_RNASeqV2, pan-cancer normalized log2(norm_counts+1) data, version 2016-08-16) (TCGA clinicalMatrix, phenotype data, version 2016-04-27) * Click on the image enlarge it in a new window. |
 |
| Top |
| TissGeneClin for TMEFF1 |
| TissGeneDrug for TMEFF1 |
| Drug information targeting TissGene (DrugBank Version 5.0.6, 2017-04-01) |
| DrugBank ID | Drug name | Drug activity | Drug type | Drug status |
| Top |
| TissGeneDisease for TMEFF1 |
| Disease information associated with TissGene (DisGeNet, 2016-06-01) |
| Disease ID | Disease name | # pubmeds | Source |
| umls:C0006118 | Brain Neoplasms | 1 | BeFree,LHGDN |
| umls:C0008924 | Cleft Lip | 1 | GAD |
| umls:C0008925 | Cleft Palate | 1 | GAD |
| umls:C0153633 | Malignant neoplasm of brain | 1 | BeFree |
|
Copyright 2016-Present - The University of Texas Health Science Center at Houston (UTHealth) Web File Viewing | How to Report, Fraud, Waste and Abuse | State of Texas | Statewide Search | Texas Homeland Security | Site Policies |