 |
| |
| |
| |
| |
| |
| |
|

| TissGeneSummary for TDRD12 |
 Gene summary Gene summary |
| Basic gene information | Gene symbol | TDRD12 |
| Gene name | tudor domain containing 12 | |
| Synonyms | ECAT8 | |
| Cytomap | UCSC genome browser: 19q13.11 | |
| Type of gene | protein-coding | |
| RefGenes | NM_001015890.1, NM_001110822.1, | |
| Description | ES cell associated transcript 8ES cell-associated transcript 8 proteinputative ATP-dependent RNA helicase TDRD12tudor domain-containing protein 12 | |
| Modification date | 20141207 | |
| dbXrefs | HGNC : HGNC | |
| Ensembl : ENSG00000173809 | ||
| Vega : OTTHUMG00000177230 | ||
| Protein | UniProt: go to UniProt's Cross Reference DB Table | |
| Expression | CleanEX: HS_TDRD12 | |
| BioGPS: 91646 | ||
| Pathway | NCI Pathway Interaction Database: TDRD12 | |
| KEGG: TDRD12 | ||
| REACTOME: TDRD12 | ||
| Pathway Commons: TDRD12 | ||
| Context | iHOP: TDRD12 | |
| ligand binding site mutation search in PubMed: TDRD12 | ||
| UCL Cancer Institute: TDRD12 | ||
| Assigned class in TissGDB* | C | |
| Included tissue-specific gene expression resources | HPA,GTEx | |
| Specific-tissues in normal samples (assigned by TissGDB using HPA, TiGER, and GTEx) | Testis | |
| Cancer types related to the specific-tissues in cancer samples (assigned by TissGDB using TCGA) | TGCT | |
| Reference showing the relevant tissue of TDRD12 | ||
| Description by TissGene annotations | TissgsKTS CNV lost TissGeneKTS | |
| * Class A consists of genes with literature evidence and is part of the cTissGenes. Class B consists of only cTissGenes without additional evidence. The remaining genes belong to Class C. |
| Gene ontology having evidence of Inferred from Direct Assay (IDA) from Entrez |
| GO ID | GO term | PubMed ID |
| Top |
| TissGeneExp for TDRD12 |
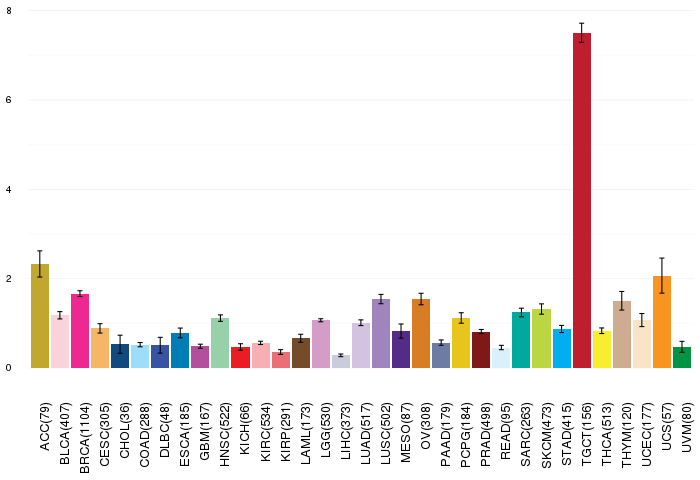
| Gene expressions across 28 cancer types (X-axis: cancer type and Y-axis: log2(norm_counts+1)) (TCGA IlluminaHiSeq_RNASeqV2, pan-cancer normalized log2(norm_counts+1) data, version 2016-08-16) |
 |
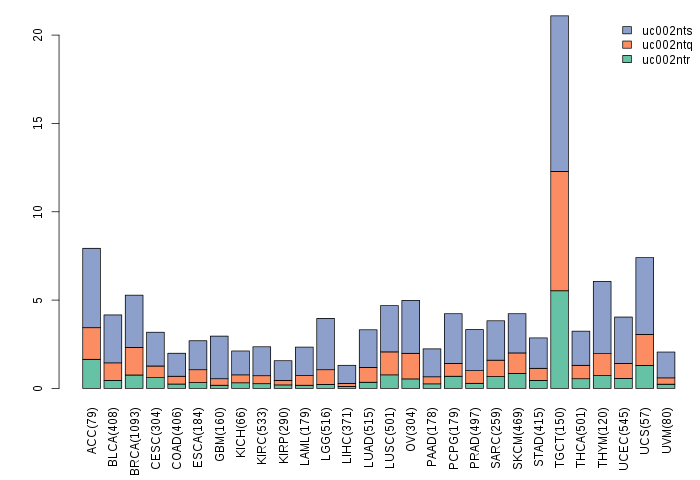
| Gene isoform expressions across 28 cancer types (X-axis: cancer type and Y-axis: log2(norm_counts+1)) (TCGA pan-cancer tcga_rsem_isoform_tpm, version 2016-09-01) |
 |
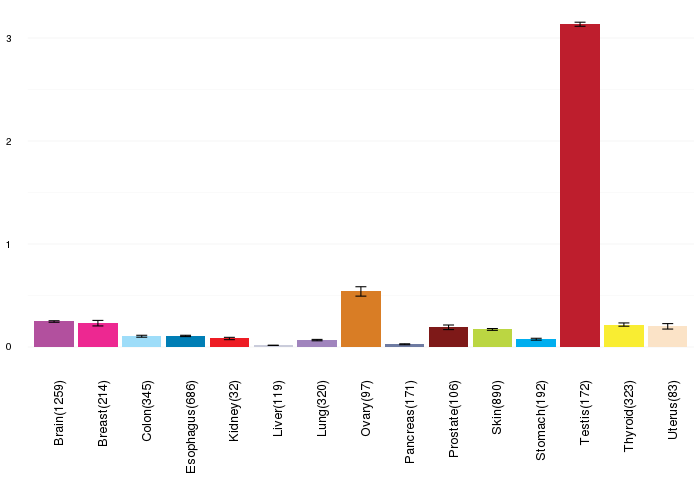
| Gene expressions across normal tissues of GTEx data (GTEx GTEx_Analysis_v6_RNA-seq_RNA-SeQCv1.1.8_gene_rpkm.gct) - Here, we shows the matched tissue types only among our 28 cancer types. |
 |
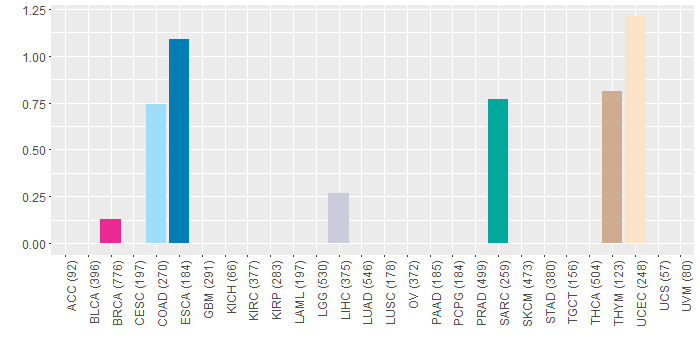
| Different expressions across 14 cancer types with more than 10 samples between matched tumors and normals (X-axis: cancer type and Y-axis: log2(norm_counts+1)) (TCGA IlluminaHiSeq_RNASeqV2, pan-cancer normalized log2(norm_counts+1) data, version 2016-08-16) |
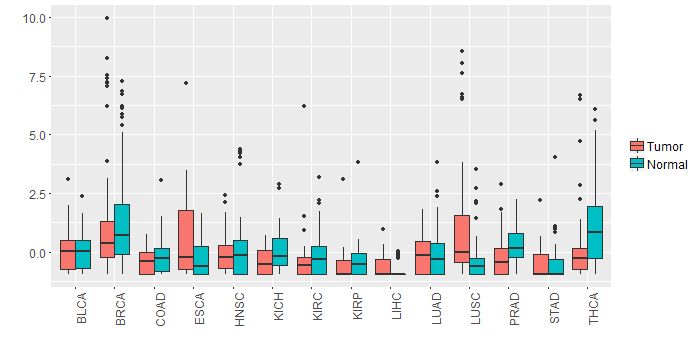 |
| - Significantly differentially expressed cancer types and information. (|Fold change|>1 and FDR<0.05) |
| Cancer type | Mean(exp) in tumor | Mean(exp) in matched normal | Log2FC | P-val. | FDR |
| THCA | 0.114680068 | 1.207412271 | -1.092732203 | 0.000861 | 0.002040957 |
| LUSC | 1.108926728 | -0.310657586 | 1.419584314 | 0.000545 | 0.001053511 |
| Top |
| TissGene-miRNA for TDRD12 |
| Significantly anti-correlated miRNAs of TissGene across 28 cancer types (Gene-miRNA relations from TargetScanHuman Relsease 7.1, Conserved_Site_Context_Scores.txt.zip, 06.01.2016) (TCGA IlluminaHiSeq_miRNASeq, log2(RPM+1) data, version 2016-11-21) (TCGA IlluminaHiSeq_RNASeqV2, log2(normalized_count+1) data, version 2016-08-16) (Spearman’s Rank Correlation (p-value<0.05 and coefficient<-0.25)) |
| Cancer type | miRNA id | miRNA accession | P-val. | Coeff. | # samples |
| Top |
| TissGeneMut for TDRD12 |
| TissGeneSNV for TDRD12 |
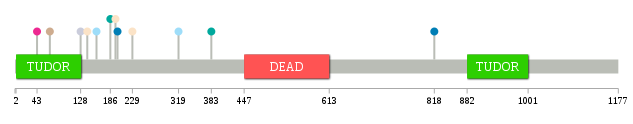
| nsSNV counts per each loci. Different colors of circles represent different cancer types. Circle size denotes number of samples. (TCGA somatic mutation (SNPs and small INDELs) data, version 2016-04-25) * Click on the image to enlarge it in a new window. |
 |
 |
| Somatic nucleotide variants of TissGene across 28 cancer types (X-axis: cancer type and Y-axis: % of mutated samples) The numbers in parentheses are numbers of samples with mutation (nsSNVs). (TCGA somatic mutation (SNPs and small INDELs) data, version 2016-04-25) |
 |
| - nsSNVs sorted by frequency. |
| AAchange | Cancer type | # samples |
| p.K229Q | UCEC | 1 |
| p.C196S | UCEC | 1 |
| p.E1099K | CHOL | 1 |
| p.D200H | ESCA | 1 |
| p.T319K | COAD | 1 |
| p.A818T | ESCA | 1 |
| p.P383S | SARC | 1 |
| p.E68D | THYM | 1 |
| p.L186I | SARC | 1 |
| p.Y159C | COAD | 1 |
| p.Y128C | LIHC | 1 |
| p.R141* | UCEC | 1 |
| p.Y43* | BRCA | 1 |
| Top |
| TissGeneCNV for TDRD12 |
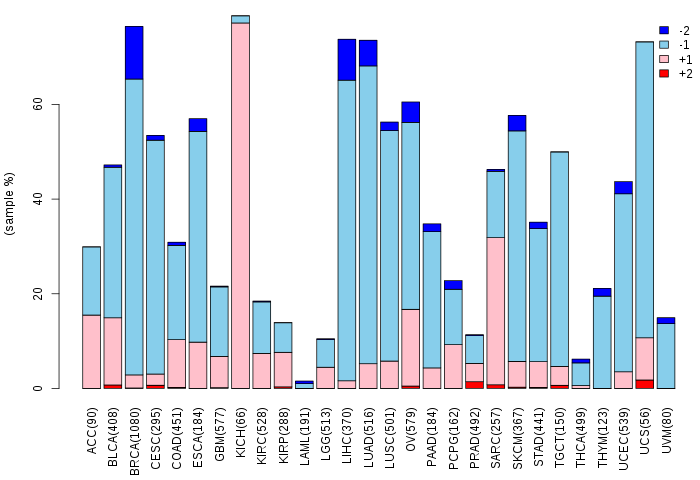
| Copy number variations of TissGene across 28 cancer types (X-axis: cancer type and Y-axis: % of CNV samples) (TCGA Gistic2_CopyNumber_Gistic2_all_data_by_genes, Gistic2 copy number data, version 2016-08-16) |
 |
| Top |
| TissGeneFusions for TDRD12 |
| Fusion genes including TissGene (ChimerDB 3.0, 2016-12-01 and TCGA fusion Portal 2015-12-01) |
| Database | Src | Cancer type | Sample | Fusion gene | ORF | 5'-gene BP | 3'-gene BP |
| Chimerdb3.0 | FusionScan | UCS | TCGA-N8-A4PP-01A | DPY19L3-TDRD12 | In-Frame | chr19:32902278 | chr19:33222630 |
| Chimerdb3.0 | FusionScan | PRAD | TCGA-V1-A9O5-06A | LSM14A-TDRD12 | In-Frame | chr19:34706566 | chr19:33263658 |
| Chimerdb3.0 | FusionScan | PRAD | TCGA-V1-A9O5-06A | TDRD12-TEAD2 | In-Frame | chr19:33268135 | chr19:49854622 |
| Chimerdb3.0 | TopHat-Fusion | BRCA | TCGA-A2-A0T3-01A | TDRD12-CEP89 | In-Frame | chr19:33262030 | chr19:33414344 |
| TCGAfusionPortal | PRADA | BLCA | TCGA-DK-A1A3-01A | CEBPG-TDRD12 | 5UTR-CDS | Chr19:33864801 | Chr19:33239382 |
| Top |
| TissGeneNet for TDRD12 |
| Co-expressed gene networks based on protein-protein interaction data (CePIN) (TCGA IlluminaHiSeq_RNASeqV2, pan-cancer normalized log2(norm_counts+1) data, version 2016-08-16) (PINA2 ppi data) |
| Top |
| TissGeneProg for TDRD12 |
| Kaplan-Meier plots with logrank tests of overall survival (OS) using 28 cancer types (TCGA IlluminaHiSeq_RNASeqV2, pan-cancer normalized log2(norm_counts+1) data, version 2016-08-16) (TCGA clinicalMatrix, phenotype data, version 2016-04-27) * Click on the image to enlarge it in a new window. |
 |
| Kaplan-Meier plots with logrank test of relapse free survival (RFS) using 28 cancer types (TCGA IlluminaHiSeq_RNASeqV2, pan-cancer normalized log2(norm_counts+1) data, version 2016-08-16) (TCGA clinicalMatrix, phenotype data, version 2016-04-27) * Click on the image enlarge it in a new window. |
 |
| Forest plot of Cox proportional hazard ratio (HR) and 95% CI of overall survival (OS) using 28 cancer types (TCGA IlluminaHiSeq_RNASeqV2, pan-cancer normalized log2(norm_counts+1) data, version 2016-08-16) (TCGA clinicalMatrix, phenotype data, version 2016-04-27) * Click on the image enlarge it in a new window. |
 |
| Forest plot of Cox proportional hazard ratio (HR) and 95% CI of relapse free survival (RFS) using 28 cancer types (TCGA IlluminaHiSeq_RNASeqV2, pan-cancer normalized log2(norm_counts+1) data, version 2016-08-16) (TCGA clinicalMatrix, phenotype data, version 2016-04-27) * Click on the image enlarge it in a new window. |
 |
| Top |
| TissGeneClin for TDRD12 |
| TissGeneDrug for TDRD12 |
| Drug information targeting TissGene (DrugBank Version 5.0.6, 2017-04-01) |
| DrugBank ID | Drug name | Drug activity | Drug type | Drug status |
| Top |
| TissGeneDisease for TDRD12 |
| Disease information associated with TissGene (DisGeNet, 2016-06-01) |
| Disease ID | Disease name | # pubmeds | Source |
|
Copyright 2016-Present - The University of Texas Health Science Center at Houston (UTHealth) Web File Viewing | How to Report, Fraud, Waste and Abuse | State of Texas | Statewide Search | Texas Homeland Security | Site Policies |