 |
| |
| |
| |
| |
| |
| |
|

| TissGeneSummary for GABBR2 |
 Gene summary Gene summary |
| Basic gene information | Gene symbol | GABBR2 |
| Gene name | gamma-aminobutyric acid (GABA) B receptor, 2 | |
| Synonyms | GABABR2|GPR51|GPRC3B|HG20|HRIHFB2099 | |
| Cytomap | UCSC genome browser: 9q22.1-q22.3 | |
| Type of gene | protein-coding | |
| RefGenes | NM_005458.7, | |
| Description | G protein-coupled receptor 51G-protein coupled receptor 51GABA-B receptor 2GABA-B receptor, R2 subunitGABA-B-R2GABA-BR2gamma-aminobutyric acid B receptor 2gamma-aminobutyric acid type B receptor subunit 2gb2 | |
| Modification date | 20141207 | |
| dbXrefs | MIM : 607340 | |
| HGNC : HGNC | ||
| Ensembl : ENSG00000136928 | ||
| HPRD : 09552 | ||
| Vega : OTTHUMG00000020345 | ||
| Protein | UniProt: go to UniProt's Cross Reference DB Table | |
| Expression | CleanEX: HS_GABBR2 | |
| BioGPS: 9568 | ||
| Pathway | NCI Pathway Interaction Database: GABBR2 | |
| KEGG: GABBR2 | ||
| REACTOME: GABBR2 | ||
| Pathway Commons: GABBR2 | ||
| Context | iHOP: GABBR2 | |
| ligand binding site mutation search in PubMed: GABBR2 | ||
| UCL Cancer Institute: GABBR2 | ||
| Assigned class in TissGDB* | C | |
| Included tissue-specific gene expression resources | HPA,TiGER | |
| Specific-tissues in normal samples (assigned by TissGDB using HPA, TiGER, and GTEx) | Brain | |
| Cancer types related to the specific-tissues in cancer samples (assigned by TissGDB using TCGA) | GBM,LGG | |
| Reference showing the relevant tissue of GABBR2 | ||
| Description by TissGene annotations | Protective TissGene in OS Cancer gene Have significant anti-correlated miRNA | |
| * Class A consists of genes with literature evidence and is part of the cTissGenes. Class B consists of only cTissGenes without additional evidence. The remaining genes belong to Class C. |
| Gene ontology having evidence of Inferred from Direct Assay (IDA) from Entrez |
| GO ID | GO term | PubMed ID | GO:0007214 | gamma-aminobutyric acid signaling pathway | 9872316 | GO:0007214 | gamma-aminobutyric acid signaling pathway | 9872316 |
| Top |
| TissGeneExp for GABBR2 |
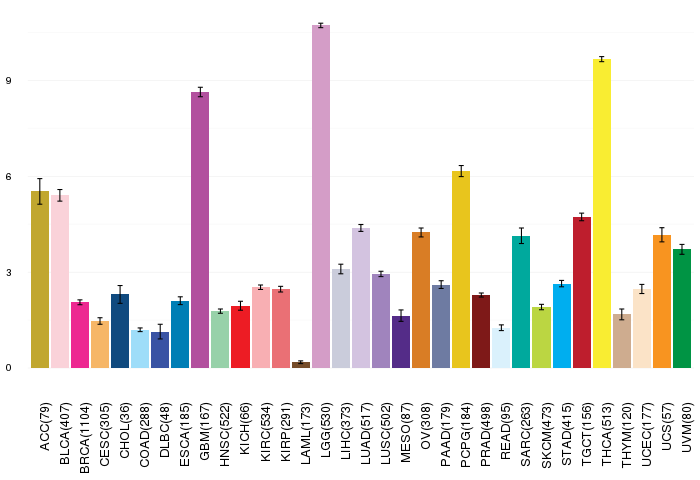
| Gene expressions across 28 cancer types (X-axis: cancer type and Y-axis: log2(norm_counts+1)) (TCGA IlluminaHiSeq_RNASeqV2, pan-cancer normalized log2(norm_counts+1) data, version 2016-08-16) |
 |
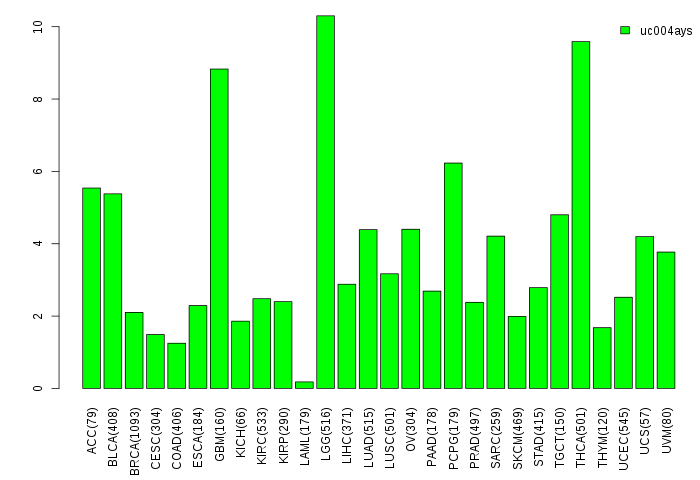
| Gene isoform expressions across 28 cancer types (X-axis: cancer type and Y-axis: log2(norm_counts+1)) (TCGA pan-cancer tcga_rsem_isoform_tpm, version 2016-09-01) |
 |
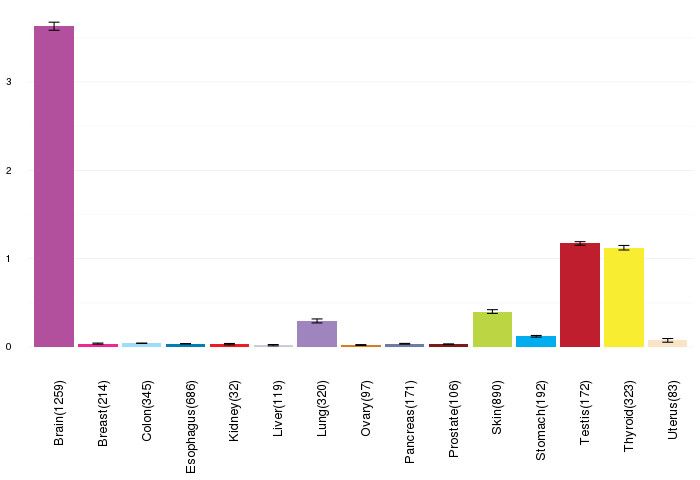
| Gene expressions across normal tissues of GTEx data (GTEx GTEx_Analysis_v6_RNA-seq_RNA-SeQCv1.1.8_gene_rpkm.gct) - Here, we shows the matched tissue types only among our 28 cancer types. |
 |
| Different expressions across 14 cancer types with more than 10 samples between matched tumors and normals (X-axis: cancer type and Y-axis: log2(norm_counts+1)) (TCGA IlluminaHiSeq_RNASeqV2, pan-cancer normalized log2(norm_counts+1) data, version 2016-08-16) |
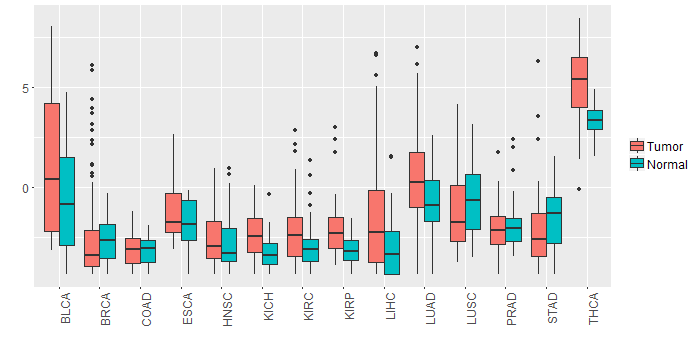 |
| - Significantly differentially expressed cancer types and information. (|Fold change|>1 and FDR<0.05) |
| Cancer type | Mean(exp) in tumor | Mean(exp) in matched normal | Log2FC | P-val. | FDR |
| THCA | 5.201894606 | 3.330942064 | 1.870952542 | 3.24E-10 | 2.01E-09 |
| LIHC | -1.340577699 | -3.032381699 | 1.691804 | 0.000819 | 0.002287965 |
| KIRP | -1.949038074 | -3.171453699 | 1.222415625 | 0.000507 | 0.001485875 |
| LUAD | 0.594753198 | -0.778281285 | 1.373034483 | 0.000609 | 0.001374232 |
| Top |
| TissGene-miRNA for GABBR2 |
| Significantly anti-correlated miRNAs of TissGene across 28 cancer types (Gene-miRNA relations from TargetScanHuman Relsease 7.1, Conserved_Site_Context_Scores.txt.zip, 06.01.2016) (TCGA IlluminaHiSeq_miRNASeq, log2(RPM+1) data, version 2016-11-21) (TCGA IlluminaHiSeq_RNASeqV2, log2(normalized_count+1) data, version 2016-08-16) (Spearman’s Rank Correlation (p-value<0.05 and coefficient<-0.25)) |
| Cancer type | miRNA id | miRNA accession | P-val. | Coeff. | # samples |
| LUAD | hsa-miR-145-5p | MIMAT0000437 | 0.047 | -0.26 | 60 |
| LUAD | hsa-miR-144-3p | MIMAT0000436 | 0.035 | -0.27 | 60 |
| ACC | hsa-miR-129-2-3p | MIMAT0004605 | 0.012 | -0.29 | 78 |
| ACC | hsa-miR-129-2-3p | MIMAT0004605 | 0.012 | -0.29 | 78 |
| LUAD | hsa-miR-34a-5p | MIMAT0000255 | 0.026 | -0.29 | 60 |
| ACC | hsa-miR-129-5p | MIMAT0000242 | 0.0056 | -0.31 | 78 |
| ACC | hsa-miR-129-5p | MIMAT0000242 | 0.0056 | -0.31 | 78 |
| LUAD | hsa-miR-429 | MIMAT0001536 | 0.017 | -0.31 | 60 |
| UCS | hsa-miR-449a | MIMAT0001541 | 0.046 | -0.31 | 56 |
| ACC | hsa-miR-204-5p | MIMAT0000265 | 0.0082 | -0.33 | 78 |
| ACC | hsa-miR-204-5p | MIMAT0000265 | 0.0082 | -0.33 | 78 |
| LUAD | hsa-let-7g-5p | MIMAT0000414 | 0.011 | -0.33 | 60 |
| Top |
| TissGeneMut for GABBR2 |
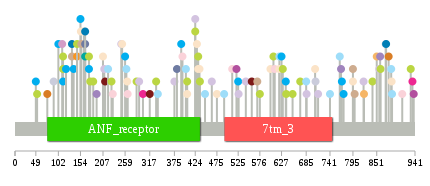
| TissGeneSNV for GABBR2 |
| nsSNV counts per each loci. Different colors of circles represent different cancer types. Circle size denotes number of samples. (TCGA somatic mutation (SNPs and small INDELs) data, version 2016-04-25) * Click on the image to enlarge it in a new window. |
 |
 |
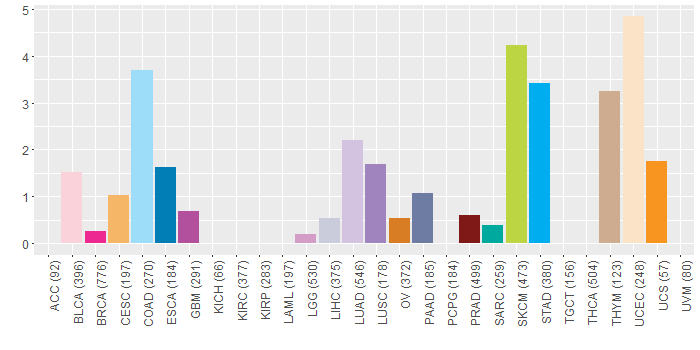
| Somatic nucleotide variants of TissGene across 28 cancer types (X-axis: cancer type and Y-axis: % of mutated samples) The numbers in parentheses are numbers of samples with mutation (nsSNVs). (TCGA somatic mutation (SNPs and small INDELs) data, version 2016-04-25) |
 |
| - nsSNVs sorted by frequency. |
| AAchange | Cancer type | # samples |
| p.W149* | HNSC | 2 |
| p.L219M | COAD | 1 |
| p.L252R | UCEC | 1 |
| p.R207M | UCEC | 1 |
| p.V176I | READ | 1 |
| p.R301C | BRCA | 1 |
| p.E286K | SKCM | 1 |
| p.K767N | LUSC | 1 |
| p.V741M | COAD | 1 |
| p.R174W | SKCM | 1 |
| p.R799X | THYM | 1 |
| p.G424R | LUAD | 1 |
| p.S52N | SKCM | 1 |
| p.S434I | UCEC | 1 |
| p.Q292H | LUAD | 1 |
| p.N795S | UCEC | 1 |
| p.E769Q | STAD | 1 |
| p.R174W | READ | 1 |
| p.L146F | SKCM | 1 |
| p.A685T | COAD | 1 |
| p.Q860L | SKCM | 1 |
| p.V162G | UCEC | 1 |
| p.T202M | HNSC | 1 |
| p.G132X | READ | 1 |
| p.E405D | UCEC | 1 |
| p.K627T | STAD | 1 |
| p.D911E | BLCA | 1 |
| p.A707V | LIHC | 1 |
| p.F431C | UCEC | 1 |
| p.E405Q | HNSC | 1 |
| p.T375K | LUAD | 1 |
| p.L686F | LUAD | 1 |
| p.G76R | OV | 1 |
| p.T773M | STAD | 1 |
| p.M259V | STAD | 1 |
| p.R891W | READ | 1 |
| p.G706R | UCEC | 1 |
| p.I879T | OV | 1 |
| p.Q764R | COAD | 1 |
| p.W576* | SKCM | 1 |
| p.T557I | PRAD | 1 |
| p.G526E | LUAD | 1 |
| p.S884Y | READ | 1 |
| p.A570V | THYM | 1 |
| p.E821Q | CESC | 1 |
| p.A635P | READ | 1 |
| p.R475Q | UCEC | 1 |
| p.R622* | UCEC | 1 |
| p.V938L | GBM | 1 |
| p.P177S | SKCM | 1 |
| p.F264L | UCEC | 1 |
| p.S155Y | UCEC | 1 |
| p.G113R | SKCM | 1 |
| p.Q336X | COAD | 1 |
| p.P820T | LUAD | 1 |
| p.V134A | THYM | 1 |
| p.A120V | STAD | 1 |
| p.L154R | STAD | 1 |
| p.G113W | STAD | 1 |
| p.C265R | BLCA | 1 |
| p.P184L | SKCM | 1 |
| p.G356R | READ | 1 |
| p.D165N | ESCA | 1 |
| p.D608N | SKCM | 1 |
| p.R873Q | ESCA | 1 |
| p.V134I | ESCA | 1 |
| p.P885S | COAD | 1 |
| p.G424R | SKCM | 1 |
| p.P931L | SKCM | 1 |
| p.L511F | BLCA | 1 |
| p.A402V | COAD | 1 |
| p.H857D | LUAD | 1 |
| p.R381W | PAAD | 1 |
| p.R435K | SKCM | 1 |
| p.G492W | COAD | 1 |
| p.R212W | PRAD | 1 |
| p.N795T | THYM | 1 |
| p.G113E | SKCM | 1 |
| p.I477M | DLBC | 1 |
| p.F543I | LUAD | 1 |
| p.M653I | SKCM | 1 |
| p.D447N | COAD | 1 |
| p.R174W | STAD | 1 |
| p.R95C | READ | 1 |
| p.V138A | STAD | 1 |
| p.P49S | STAD | 1 |
| p.E405K | SKCM | 1 |
| p.L525R | STAD | 1 |
| p.H887D | COAD | 1 |
| p.F156Y | THYM | 1 |
| p.V601M | UCEC | 1 |
| p.L146I | UCS | 1 |
| p.F409L | HNSC | 1 |
| p.N521K | GBM | 1 |
| p.P463T | LUAD | 1 |
| p.A111V | LGG | 1 |
| p.A444T | READ | 1 |
| p.I250M | LUAD | 1 |
| p.D638N | SKCM | 1 |
| p.G332R | SKCM | 1 |
| p.E230K | BLCA | 1 |
| p.R622Q | COAD | 1 |
| p.R102W | STAD | 1 |
| p.F431L | SKCM | 1 |
| p.G671R | SKCM | 1 |
| p.I611M | BLCA | 1 |
| p.K262N | COAD | 1 |
| p.V317M | PRAD | 1 |
| p.M630I | SKCM | 1 |
| p.L536I | READ | 1 |
| p.K851N | CESC | 1 |
| p.E886A | UCEC | 1 |
| p.T394M | BLCA | 1 |
| p.S872Y | LIHC | 1 |
| p.S227L | SKCM | 1 |
| p.H192Y | LUSC | 1 |
| p.Q336K | HNSC | 1 |
| p.R637W | STAD | 1 |
| p.T713I | LUAD | 1 |
| p.G841E | SKCM | 1 |
| p.D165N | PAAD | 1 |
| p.T391M | STAD | 1 |
| p.R935P | BRCA | 1 |
| p.E210K | LUAD | 1 |
| p.F428V | UCEC | 1 |
| p.D165N | SARC | 1 |
| p.E91K | LIHC | 1 |
| p.D859N | LUSC | 1 |
| Top |
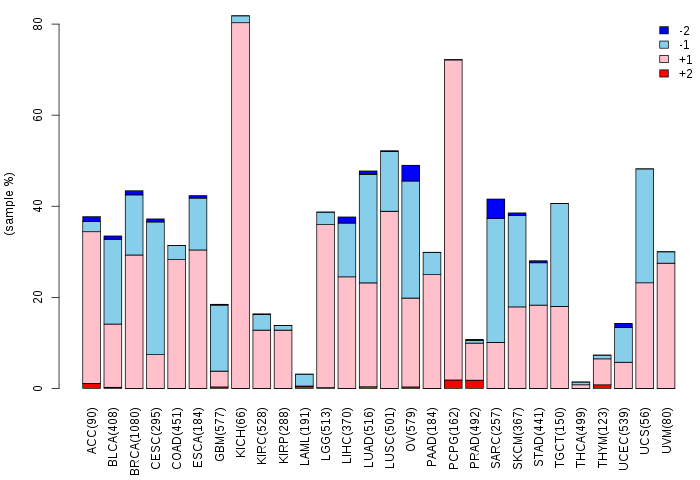
| TissGeneCNV for GABBR2 |
| Copy number variations of TissGene across 28 cancer types (X-axis: cancer type and Y-axis: % of CNV samples) (TCGA Gistic2_CopyNumber_Gistic2_all_data_by_genes, Gistic2 copy number data, version 2016-08-16) |
 |
| Top |
| TissGeneFusions for GABBR2 |
| Fusion genes including TissGene (ChimerDB 3.0, 2016-12-01 and TCGA fusion Portal 2015-12-01) |
| Database | Src | Cancer type | Sample | Fusion gene | ORF | 5'-gene BP | 3'-gene BP |
| Chimerdb3.0 | ChiTaRs | NA | DA142897 | GABBR2-AGT | chr9:101051878 | chr1:230846160 | |
| Chimerdb3.0 | ChiTaRs | NA | BE766562 | GABBR2-UBE2H | chr9:101056116 | chr7:129569478 | |
| Chimerdb3.0 | ChiTaRs | NA | BP311968 | GABBR2-GABBR2 | chr9:101056168 | chr9:101151197 |
| Top |
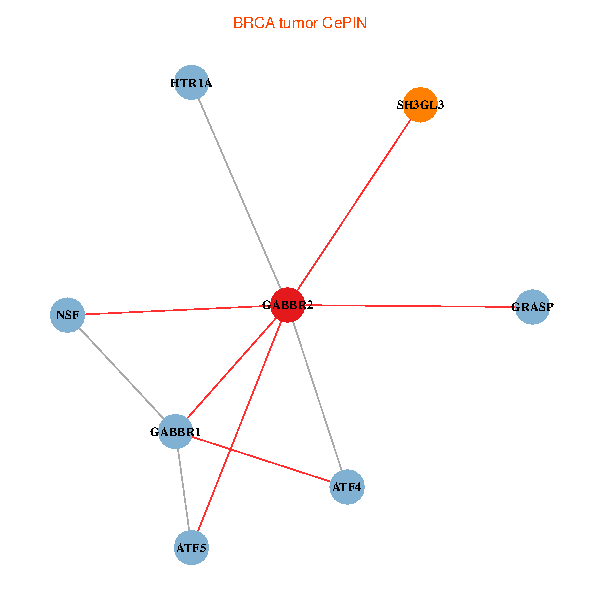
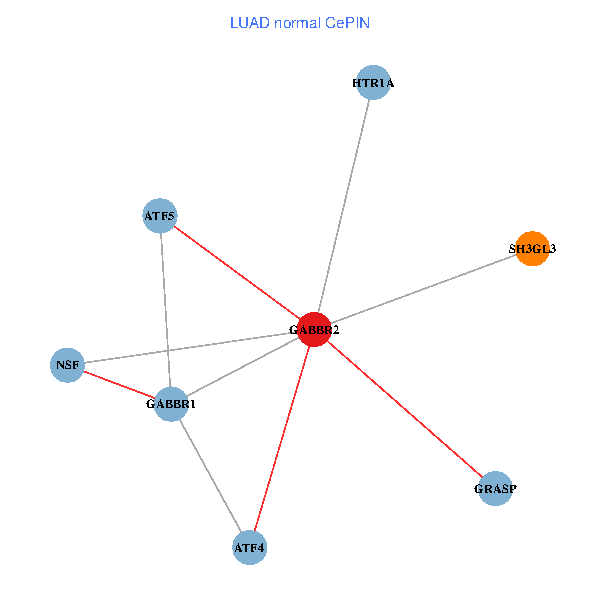
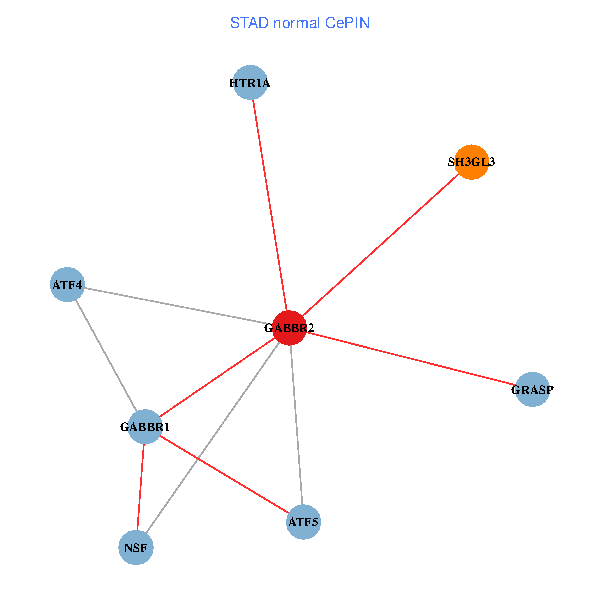
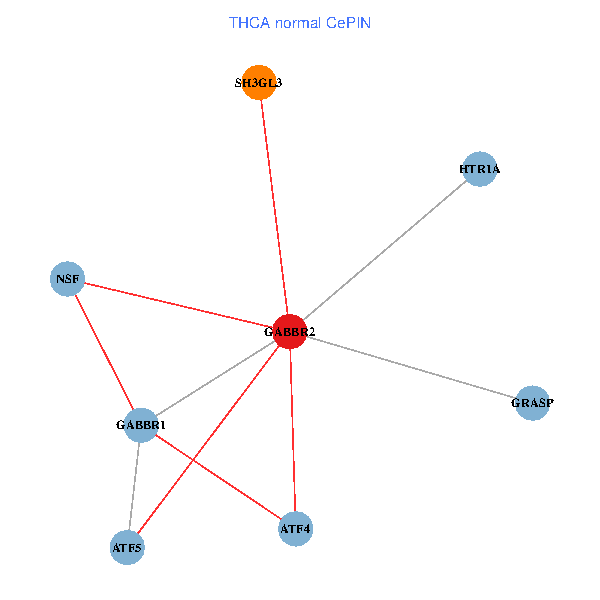
| TissGeneNet for GABBR2 |
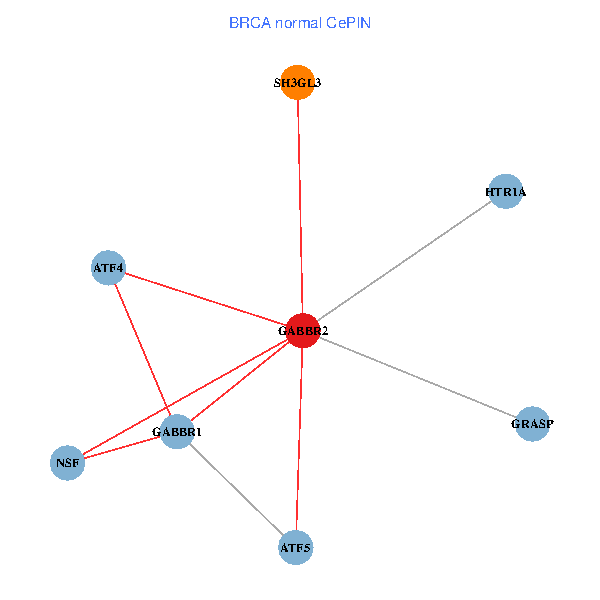
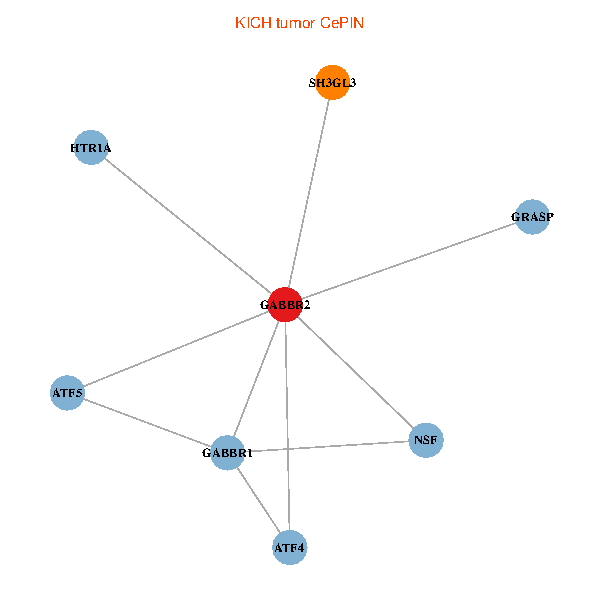
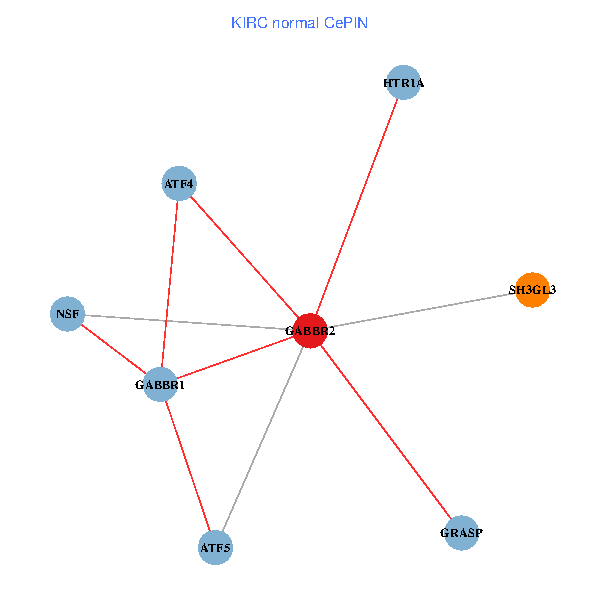
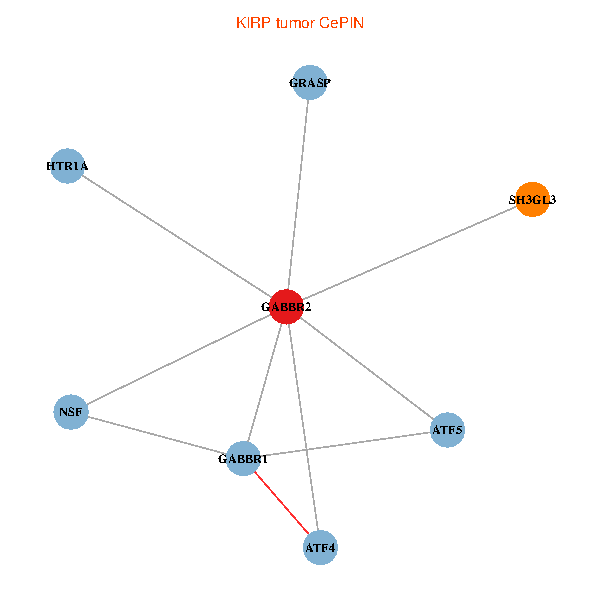
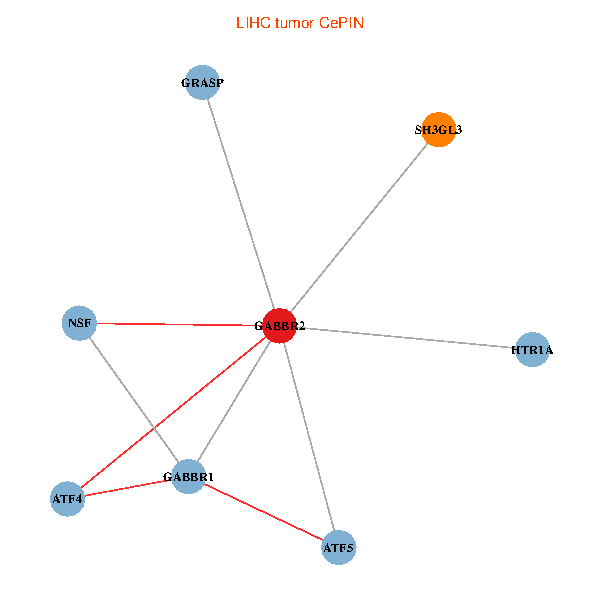
| Co-expressed gene networks based on protein-protein interaction data (CePIN) (TCGA IlluminaHiSeq_RNASeqV2, pan-cancer normalized log2(norm_counts+1) data, version 2016-08-16) (PINA2 ppi data) |
| BRCA (tumor) | BRCA (normal) |
| GABBR2, SH3GL3, ATF5, NSF, GABBR1, ATF4, GRASP, HTR1A (tumor) | GABBR2, SH3GL3, ATF5, NSF, GABBR1, ATF4, GRASP, HTR1A (normal) |
 |  |
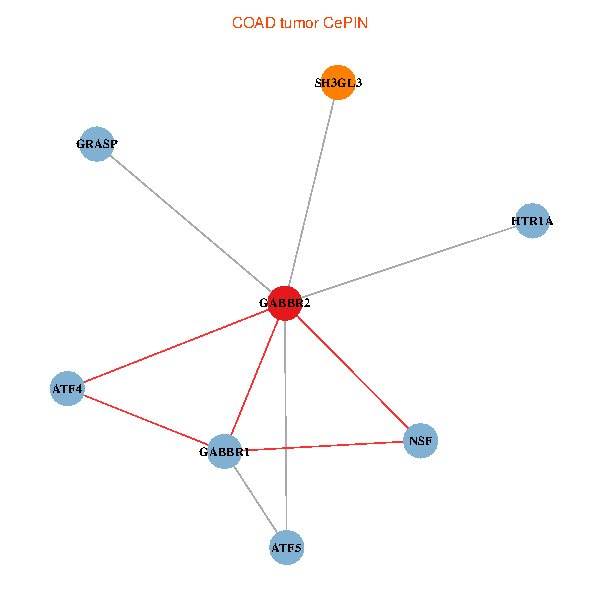
| COAD (tumor) | COAD (normal) |
| GABBR2, SH3GL3, ATF5, NSF, GABBR1, ATF4, GRASP, HTR1A (tumor) | GABBR2, SH3GL3, ATF5, NSF, GABBR1, ATF4, GRASP, HTR1A (normal) |
 |  |
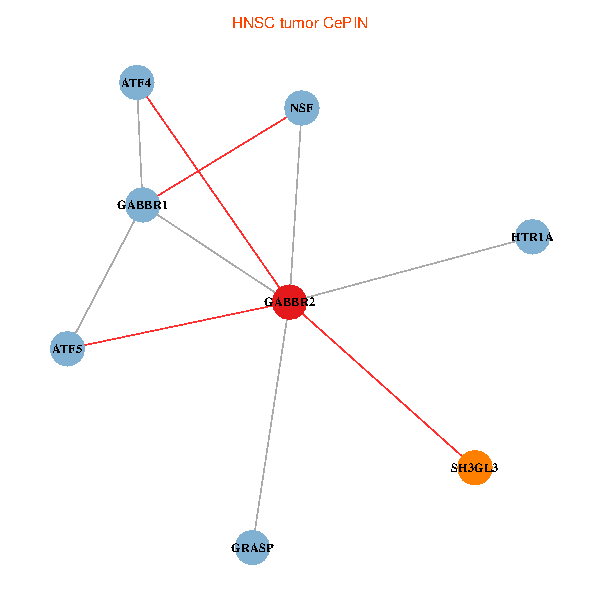
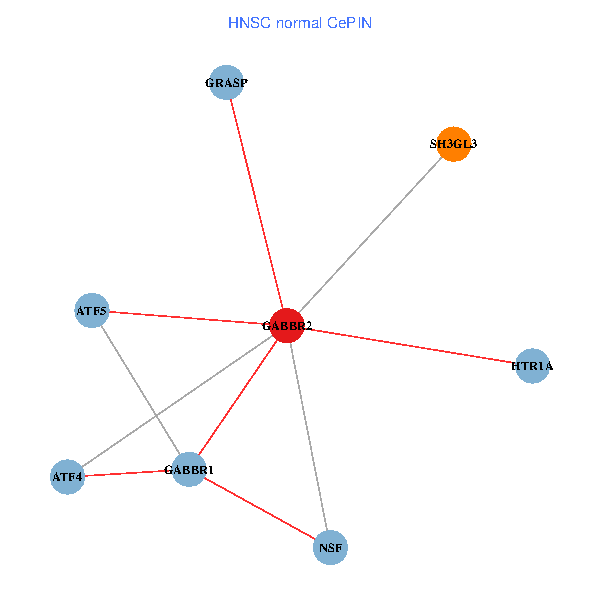
| HNSC (tumor) | HNSC (normal) |
| GABBR2, SH3GL3, ATF5, NSF, GABBR1, ATF4, GRASP, HTR1A (tumor) | GABBR2, SH3GL3, ATF5, NSF, GABBR1, ATF4, GRASP, HTR1A (normal) |
 |  |
| KICH (tumor) | KICH (normal) |
| GABBR2, SH3GL3, ATF5, NSF, GABBR1, ATF4, GRASP, HTR1A (tumor) | GABBR2, SH3GL3, ATF5, NSF, GABBR1, ATF4, GRASP, HTR1A (normal) |
 |  |
| KIRC (tumor) | KIRC (normal) |
| GABBR2, SH3GL3, ATF5, NSF, GABBR1, ATF4, GRASP, HTR1A (tumor) | GABBR2, SH3GL3, ATF5, NSF, GABBR1, ATF4, GRASP, HTR1A (normal) |
 |  |
| KIRP (tumor) | KIRP (normal) |
| GABBR2, SH3GL3, ATF5, NSF, GABBR1, ATF4, GRASP, HTR1A (tumor) | GABBR2, SH3GL3, ATF5, NSF, GABBR1, ATF4, GRASP, HTR1A (normal) |
 |  |
| LIHC (tumor) | LIHC (normal) |
| GABBR2, SH3GL3, ATF5, NSF, GABBR1, ATF4, GRASP, HTR1A (tumor) | GABBR2, SH3GL3, ATF5, NSF, GABBR1, ATF4, GRASP, HTR1A (normal) |
 |  |
| LUAD (tumor) | LUAD (normal) |
| GABBR2, SH3GL3, ATF5, NSF, GABBR1, ATF4, GRASP, HTR1A (tumor) | GABBR2, SH3GL3, ATF5, NSF, GABBR1, ATF4, GRASP, HTR1A (normal) |
 |  |
| LUSC (tumor) | LUSC (normal) |
| GABBR2, SH3GL3, ATF5, NSF, GABBR1, ATF4, GRASP, HTR1A (tumor) | GABBR2, SH3GL3, ATF5, NSF, GABBR1, ATF4, GRASP, HTR1A (normal) |
 |  |
| PRAD (tumor) | PRAD (normal) |
| GABBR2, SH3GL3, ATF5, NSF, GABBR1, ATF4, GRASP, HTR1A (tumor) | GABBR2, SH3GL3, ATF5, NSF, GABBR1, ATF4, GRASP, HTR1A (normal) |
 |  |
| STAD (tumor) | STAD (normal) |
| GABBR2, SH3GL3, ATF5, NSF, GABBR1, ATF4, GRASP, HTR1A (tumor) | GABBR2, SH3GL3, ATF5, NSF, GABBR1, ATF4, GRASP, HTR1A (normal) |
 |  |
| THCA (tumor) | THCA (normal) |
| GABBR2, SH3GL3, ATF5, NSF, GABBR1, ATF4, GRASP, HTR1A (tumor) | GABBR2, SH3GL3, ATF5, NSF, GABBR1, ATF4, GRASP, HTR1A (normal) |
 |  |
| Top |
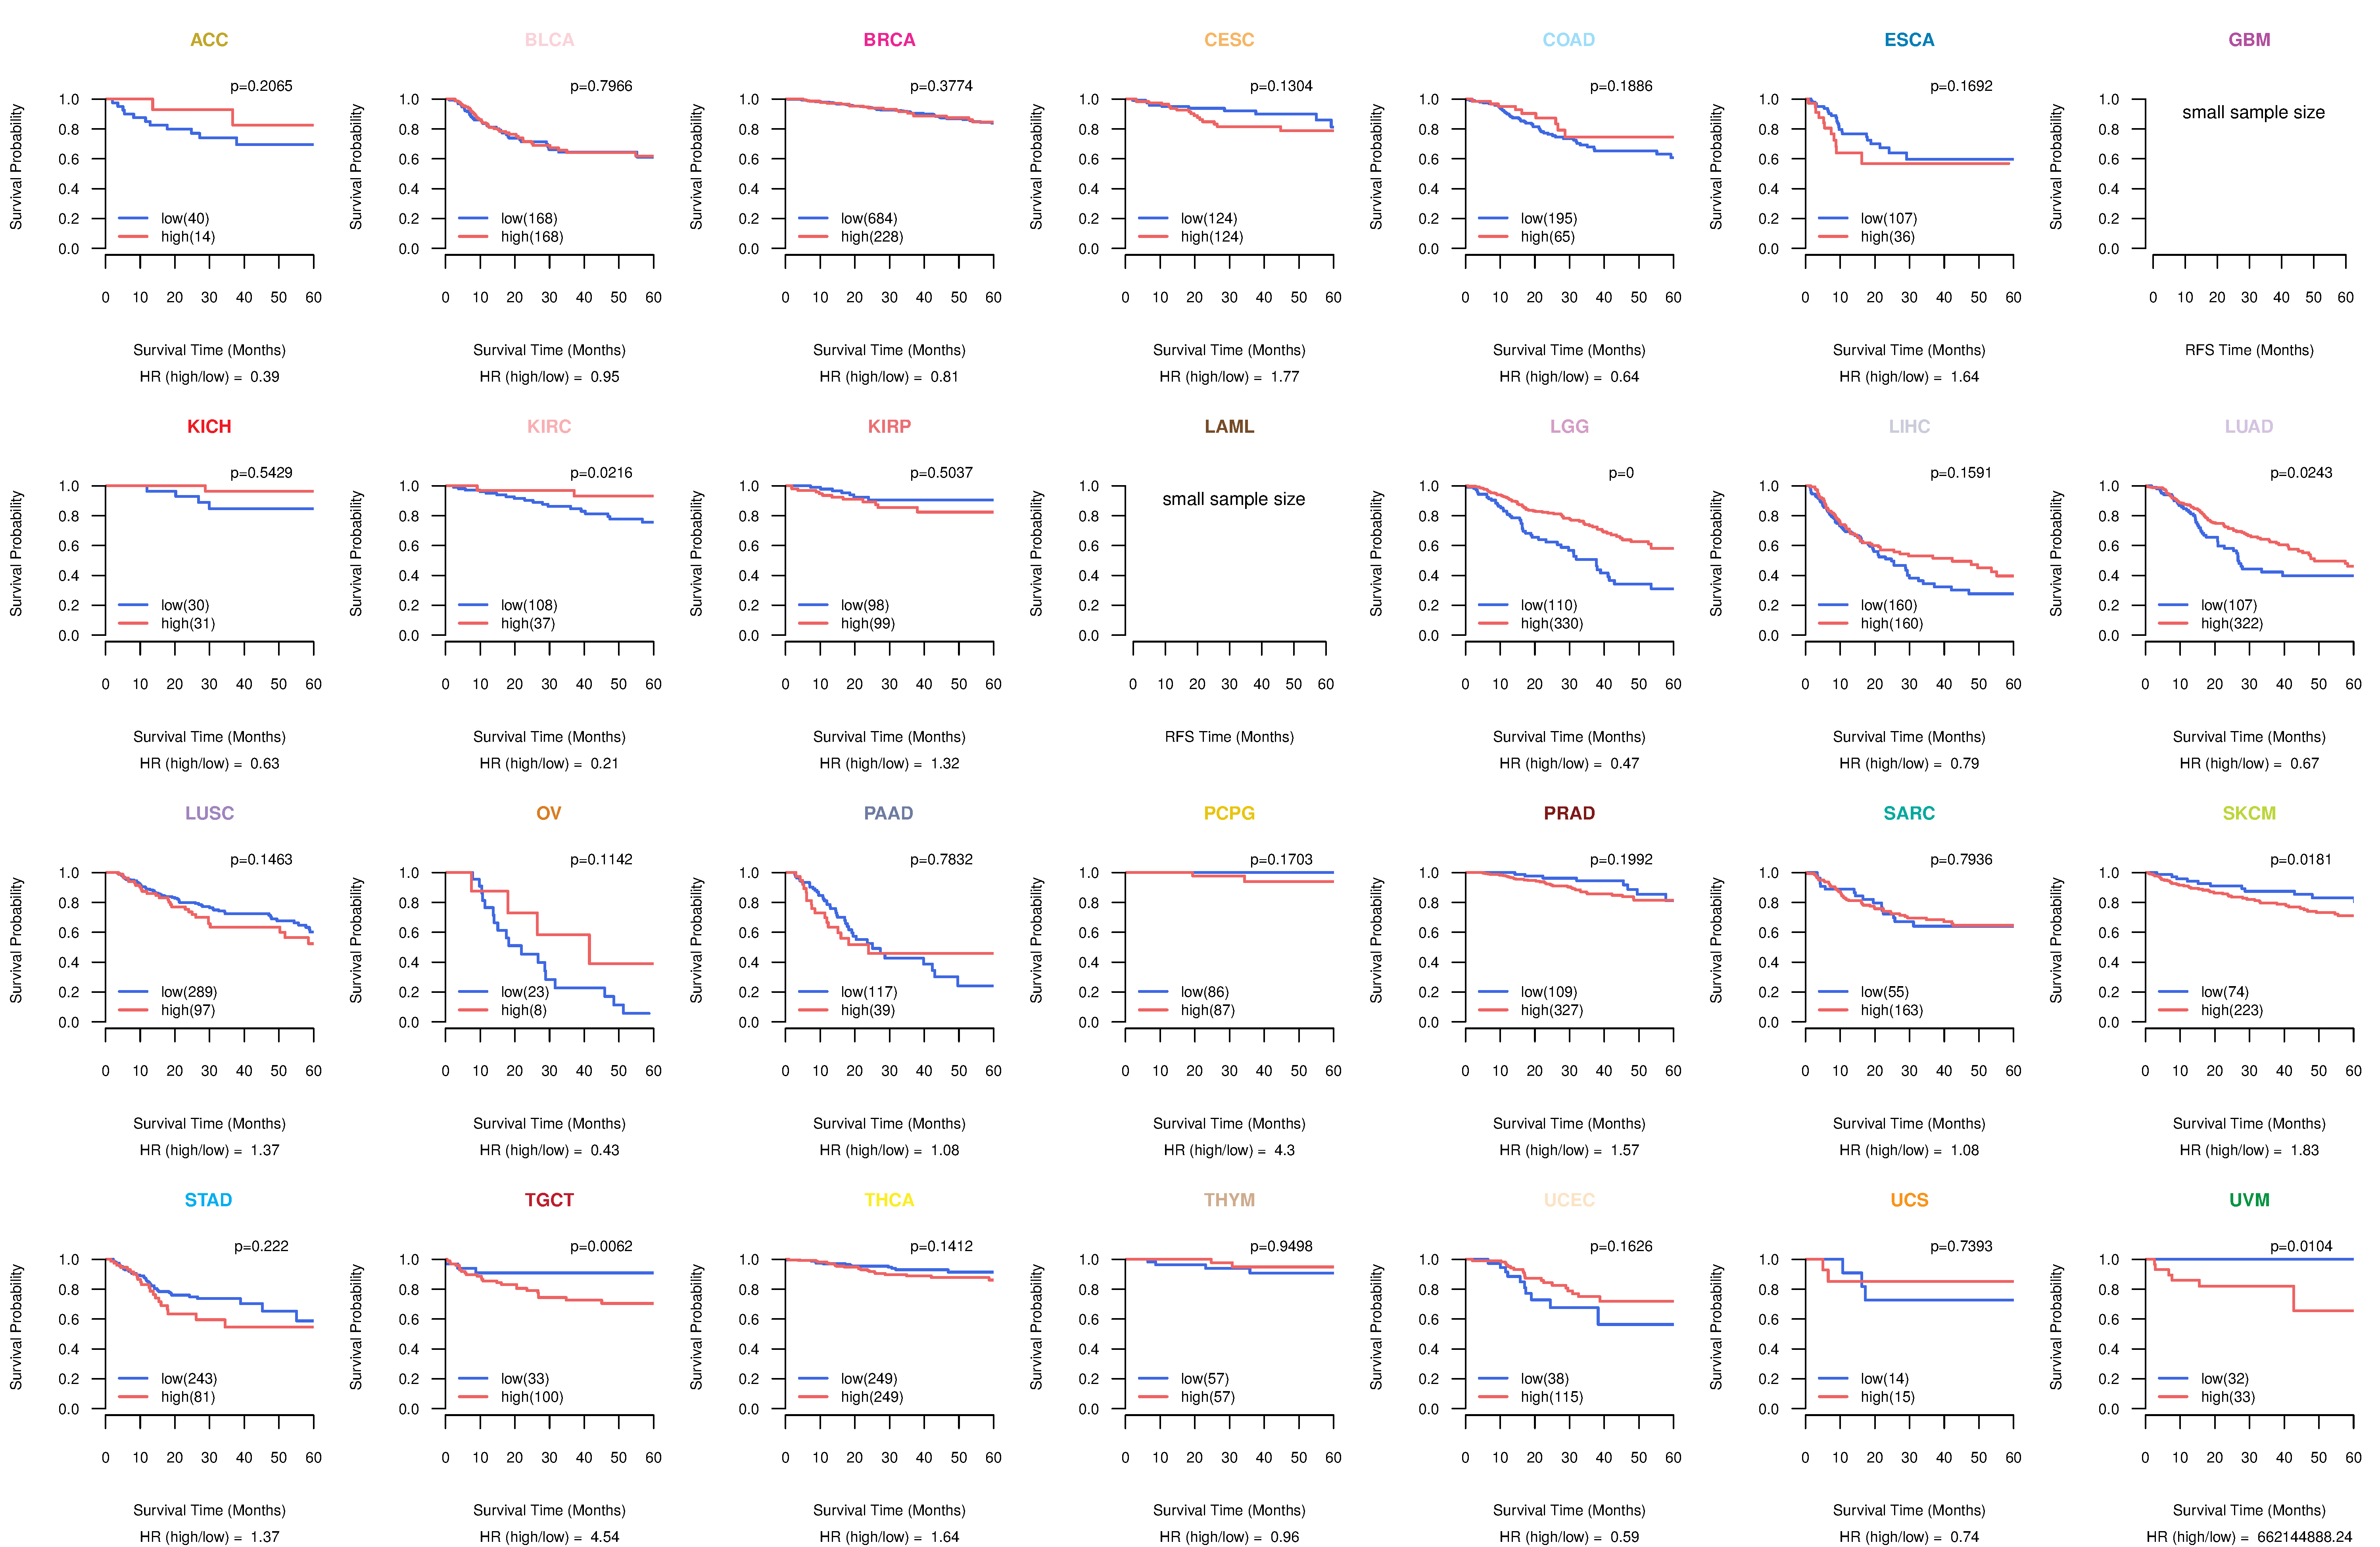
| TissGeneProg for GABBR2 |
| Kaplan-Meier plots with logrank tests of overall survival (OS) using 28 cancer types (TCGA IlluminaHiSeq_RNASeqV2, pan-cancer normalized log2(norm_counts+1) data, version 2016-08-16) (TCGA clinicalMatrix, phenotype data, version 2016-04-27) * Click on the image to enlarge it in a new window. |
 |
| Kaplan-Meier plots with logrank test of relapse free survival (RFS) using 28 cancer types (TCGA IlluminaHiSeq_RNASeqV2, pan-cancer normalized log2(norm_counts+1) data, version 2016-08-16) (TCGA clinicalMatrix, phenotype data, version 2016-04-27) * Click on the image enlarge it in a new window. |
 |
| Forest plot of Cox proportional hazard ratio (HR) and 95% CI of overall survival (OS) using 28 cancer types (TCGA IlluminaHiSeq_RNASeqV2, pan-cancer normalized log2(norm_counts+1) data, version 2016-08-16) (TCGA clinicalMatrix, phenotype data, version 2016-04-27) * Click on the image enlarge it in a new window. |
 |
| Forest plot of Cox proportional hazard ratio (HR) and 95% CI of relapse free survival (RFS) using 28 cancer types (TCGA IlluminaHiSeq_RNASeqV2, pan-cancer normalized log2(norm_counts+1) data, version 2016-08-16) (TCGA clinicalMatrix, phenotype data, version 2016-04-27) * Click on the image enlarge it in a new window. |
 |
| Top |
| TissGeneClin for GABBR2 |
| TissGeneDrug for GABBR2 |
| Drug information targeting TissGene (DrugBank Version 5.0.6, 2017-04-01) |
| DrugBank ID | Drug name | Drug activity | Drug type | Drug status |
| DB00181 | Baclofen | Agonist | Small molecule | Approved |
| Top |
| TissGeneDisease for GABBR2 |
| Disease information associated with TissGene (DisGeNet, 2016-06-01) |
| Disease ID | Disease name | # pubmeds | Source |
| umls:C0028043 | Nicotine Dependence | 3 | BeFree |
| umls:C0040336 | Tobacco Use Disorder | 3 | GAD |
| umls:C0014556 | Epilepsy, Temporal Lobe | 2 | BeFree,GAD,LHGDN |
| umls:C0004096 | Asthma | 1 | GAD |
| umls:C0004352 | Autistic Disorder | 1 | BeFree,CTD_human |
| umls:C0005586 | Bipolar Disorder | 1 | GAD |
| umls:C0008924 | Cleft Lip | 1 | GAD |
| umls:C0008925 | Cleft Palate | 1 | GAD |
| umls:C0020071 | Hereditary Sensory Autonomic Neuropathy, Type 1 | 1 | BeFree |
| umls:C0020503 | Hyperparathyroidism, Secondary | 1 | GAD |
| umls:C0030567 | Parkinson Disease | 1 | GAD |
| umls:C0036341 | Schizophrenia | 1 | BeFree |
| umls:C0041696 | Unipolar Depression | 1 | BeFree |
| umls:C0242383 | Age related macular degeneration | 1 | BeFree |
| umls:C1269683 | Major Depressive Disorder | 1 | BeFree |
| umls:C1536085 | Geographic Atrophy | 1 | BeFree |
| umls:C1861063 | TOBACCO ADDICTION, SUSCEPTIBILITY TO (finding) | 0 | CLINVAR,CTD_human |
|
Copyright 2016-Present - The University of Texas Health Science Center at Houston (UTHealth) Web File Viewing | How to Report, Fraud, Waste and Abuse | State of Texas | Statewide Search | Texas Homeland Security | Site Policies |