|
||||||||||||||||||||||||||||||||||||||||||||||||||||||||||||||||||||||||||||||||||||||||||||||||||||||||||||||||||||||||||||||||||||||||||||||||||||||||||||||||||||||||||||||||||||||||||||||||||||||||||||||||||||||||||||||||||||||||||||||||||||||||||||||||||||||||||||||||||||||||||||||||||||||||||||||||||||||||||
| |
| Phenotypic Information (metabolism pathway, cancer, disease, phenome) |
| |
| |
| Gene-Gene Network Information: Co-Expression Network, Interacting Genes & KEGG |
| |
|


| Gene Summary for UGT2A1 |
| Top |
| Phenotypic Information for UGT2A1(metabolism pathway, cancer, disease, phenome) |
| Cancer | CGAP: UGT2A1 |
| Familial Cancer Database: UGT2A1 | |
| * This gene is included in those cancer gene databases. |
|
|
|
|
|
| . | ||||||||||||||||||||||||||||||||||||||||||||||||||||||||||||||||||||||||||||||||||||||||||||||||||||||||||||||||||||||||||||||||||||||||||||||||||||||||||||||||||||||||||||||||||||||||||||||||||||||||||||||||||||||||||||||||||||||||||||||||||||||||||||||||||||||||||||||||||||||||||||||||||||||||||||||||||||
Oncogene 1 | Significant driver gene in | |||||||||||||||||||||||||||||||||||||||||||||||||||||||||||||||||||||||||||||||||||||||||||||||||||||||||||||||||||||||||||||||||||||||||||||||||||||||||||||||||||||||||||||||||||||||||||||||||||||||||||||||||||||||||||||||||||||||||||||||||||||||||||||||||||||||||||||||||||||||||||||||||||||||||||||||||||||||||
| cf) number; DB name 1 Oncogene; http://nar.oxfordjournals.org/content/35/suppl_1/D721.long, 2 Tumor Suppressor gene; https://bioinfo.uth.edu/TSGene/, 3 Cancer Gene Census; http://www.nature.com/nrc/journal/v4/n3/abs/nrc1299.html, 4 CancerGenes; http://nar.oxfordjournals.org/content/35/suppl_1/D721.long, 5 Network of Cancer Gene; http://ncg.kcl.ac.uk/index.php, 1Therapeutic Vulnerabilities in Cancer; http://cbio.mskcc.org/cancergenomics/statius/ |
| KEGG_ASCORBATE_AND_ALDARATE_METABOLISM KEGG_STARCH_AND_SUCROSE_METABOLISM KEGG_RETINOL_METABOLISM KEGG_PORPHYRIN_AND_CHLOROPHYLL_METABOLISM KEGG_METABOLISM_OF_XENOBIOTICS_BY_CYTOCHROME_P450 KEGG_DRUG_METABOLISM_CYTOCHROME_P450 KEGG_DRUG_METABOLISM_OTHER_ENZYMES | |
| OMIM | |
| Orphanet | |
| Disease | KEGG Disease: UGT2A1 |
| MedGen: UGT2A1 (Human Medical Genetics with Condition) | |
| ClinVar: UGT2A1 | |
| Phenotype | MGI: UGT2A1 (International Mouse Phenotyping Consortium) |
| PhenomicDB: UGT2A1 | |
| Mutations for UGT2A1 |
| * Under tables are showing count per each tissue to give us broad intuition about tissue specific mutation patterns.You can go to the detailed page for each mutation database's web site. |
| - Statistics for Tissue and Mutation type | Top |
 |
| - For Inter-chromosomal Variations |
| There's no inter-chromosomal structural variation. |
| - For Intra-chromosomal Variations |
| * Intra-chromosomal variantions includes 'intrachromosomal amplicon to amplicon', 'intrachromosomal amplicon to non-amplified dna', 'intrachromosomal deletion', 'intrachromosomal fold-back inversion', 'intrachromosomal inversion', 'intrachromosomal tandem duplication', 'Intrachromosomal unknown type', 'intrachromosomal with inverted orientation', 'intrachromosomal with non-inverted orientation'. |
 |
| Sample | Symbol_a | Chr_a | Start_a | End_a | Symbol_b | Chr_b | Start_b | End_b |
| ovary | UGT2A1 | chr4 | 70467363 | 70467563 | UGT2A1 | chr4 | 70472750 | 70472950 |
| ovary | UGT2A1 | chr4 | 70467448 | 70467468 | UGT2A1 | chr4 | 70472793 | 70472813 |
| ovary | UGT2A1 | chr4 | 70493450 | 70493470 | UGT2A1 | chr4 | 70493695 | 70493715 |
| ovary | UGT2A1 | chr4 | 70509236 | 70509256 | UGT2A1 | chr4 | 70505863 | 70505883 |
| pancreas | UGT2A1 | chr4 | 70491911 | 70491931 | UGT2A1 | chr4 | 70495126 | 70495146 |
| cf) Tissue number; Tissue name (1;Breast, 2;Central_nervous_system, 3;Haematopoietic_and_lymphoid_tissue, 4;Large_intestine, 5;Liver, 6;Lung, 7;Ovary, 8;Pancreas, 9;Prostate, 10;Skin, 11;Soft_tissue, 12;Upper_aerodigestive_tract) |
| * From mRNA Sanger sequences, Chitars2.0 arranged chimeric transcripts. This table shows UGT2A1 related fusion information. |
| ID | Head Gene | Tail Gene | Accession | Gene_a | qStart_a | qEnd_a | Chromosome_a | tStart_a | tEnd_a | Gene_a | qStart_a | qEnd_a | Chromosome_a | tStart_a | tEnd_a |
| Top |
| Mutation type/ Tissue ID | brca | cns | cerv | endome | haematopo | kidn | Lintest | liver | lung | ns | ovary | pancre | prost | skin | stoma | thyro | urina | |||
| Total # sample | 1 | 1 | 1 | |||||||||||||||||
| GAIN (# sample) | 1 | 1 | ||||||||||||||||||
| LOSS (# sample) | 1 |
| cf) Tissue ID; Tissue type (1; Breast, 2; Central_nervous_system, 3; Cervix, 4; Endometrium, 5; Haematopoietic_and_lymphoid_tissue, 6; Kidney, 7; Large_intestine, 8; Liver, 9; Lung, 10; NS, 11; Ovary, 12; Pancreas, 13; Prostate, 14; Skin, 15; Stomach, 16; Thyroid, 17; Urinary_tract) |
| Top |
|
 |
| Top |
| Stat. for Non-Synonymous SNVs (# total SNVs=59) | (# total SNVs=15) |
 |  |
(# total SNVs=4) | (# total SNVs=1) |
 |  |
| Top |
| * When you move the cursor on each content, you can see more deailed mutation information on the Tooltip. Those are primary_site,primary_histology,mutation(aa),pubmedID. |
| GRCh37 position | Mutation(aa) | Unique sampleID count |
| chr4:70455340-70455340 | p.R445I | 3 |
| chr4:70455304-70455304 | p.R457Q | 3 |
| chr4:70455305-70455305 | p.R457* | 3 |
| chr4:70465074-70465074 | p.E252K | 3 |
| chr4:70513122-70513122 | p.E81* | 3 |
| chr4:70460341-70460341 | p.V386V | 2 |
| chr4:70455274-70455274 | p.R467H | 2 |
| chr4:70465030-70465030 | p.R266R | 2 |
| chr4:70465032-70465032 | p.R266C | 2 |
| chr4:70512854-70512854 | p.S170Y | 2 |
| Top |
|
 |
| Point Mutation/ Tissue ID | 1 | 2 | 3 | 4 | 5 | 6 | 7 | 8 | 9 | 10 | 11 | 12 | 13 | 14 | 15 | 16 | 17 | 18 | 19 | 20 |
| # sample | 1 | 2 | 1 | 5 | 1 | 2 | 3 | 3 | 8 | 2 | 4 | |||||||||
| # mutation | 1 | 2 | 1 | 5 | 1 | 2 | 3 | 3 | 8 | 2 | 5 | |||||||||
| nonsynonymous SNV | 1 | 1 | 1 | 3 | 1 | 2 | 2 | 3 | 5 | 2 | 4 | |||||||||
| synonymous SNV | 1 | 2 | 1 | 3 | 1 |
| cf) Tissue ID; Tissue type (1; BLCA[Bladder Urothelial Carcinoma], 2; BRCA[Breast invasive carcinoma], 3; CESC[Cervical squamous cell carcinoma and endocervical adenocarcinoma], 4; COAD[Colon adenocarcinoma], 5; GBM[Glioblastoma multiforme], 6; Glioma Low Grade, 7; HNSC[Head and Neck squamous cell carcinoma], 8; KICH[Kidney Chromophobe], 9; KIRC[Kidney renal clear cell carcinoma], 10; KIRP[Kidney renal papillary cell carcinoma], 11; LAML[Acute Myeloid Leukemia], 12; LUAD[Lung adenocarcinoma], 13; LUSC[Lung squamous cell carcinoma], 14; OV[Ovarian serous cystadenocarcinoma ], 15; PAAD[Pancreatic adenocarcinoma], 16; PRAD[Prostate adenocarcinoma], 17; SKCM[Skin Cutaneous Melanoma], 18:STAD[Stomach adenocarcinoma], 19:THCA[Thyroid carcinoma], 20:UCEC[Uterine Corpus Endometrial Carcinoma]) |
| Top |
| * We represented just top 10 SNVs. When you move the cursor on each content, you can see more deailed mutation information on the Tooltip. Those are primary_site, primary_histology, mutation(aa), pubmedID. |
| Genomic Position | Mutation(aa) | Unique sampleID count |
| chr4:70513300 | p.G21G,UGT2A1 | 2 |
| chr4:70512731 | p.R209I,UGT2A1 | 1 |
| chr4:70513331 | p.T103A,UGT2A1 | 1 |
| chr4:70512912 | p.S205Y,UGT2A1 | 1 |
| chr4:70513145 | p.S102L,UGT2A1 | 1 |
| chr4:70512732 | p.Q203L,UGT2A1 | 1 |
| chr4:70512938 | p.V86L,UGT2A1 | 1 |
| chr4:70513183 | p.V193A,UGT2A1 | 1 |
| chr4:70512737 | p.P77P,UGT2A1 | 1 |
| chr4:70512978 | p.S191F,UGT2A1 | 1 |
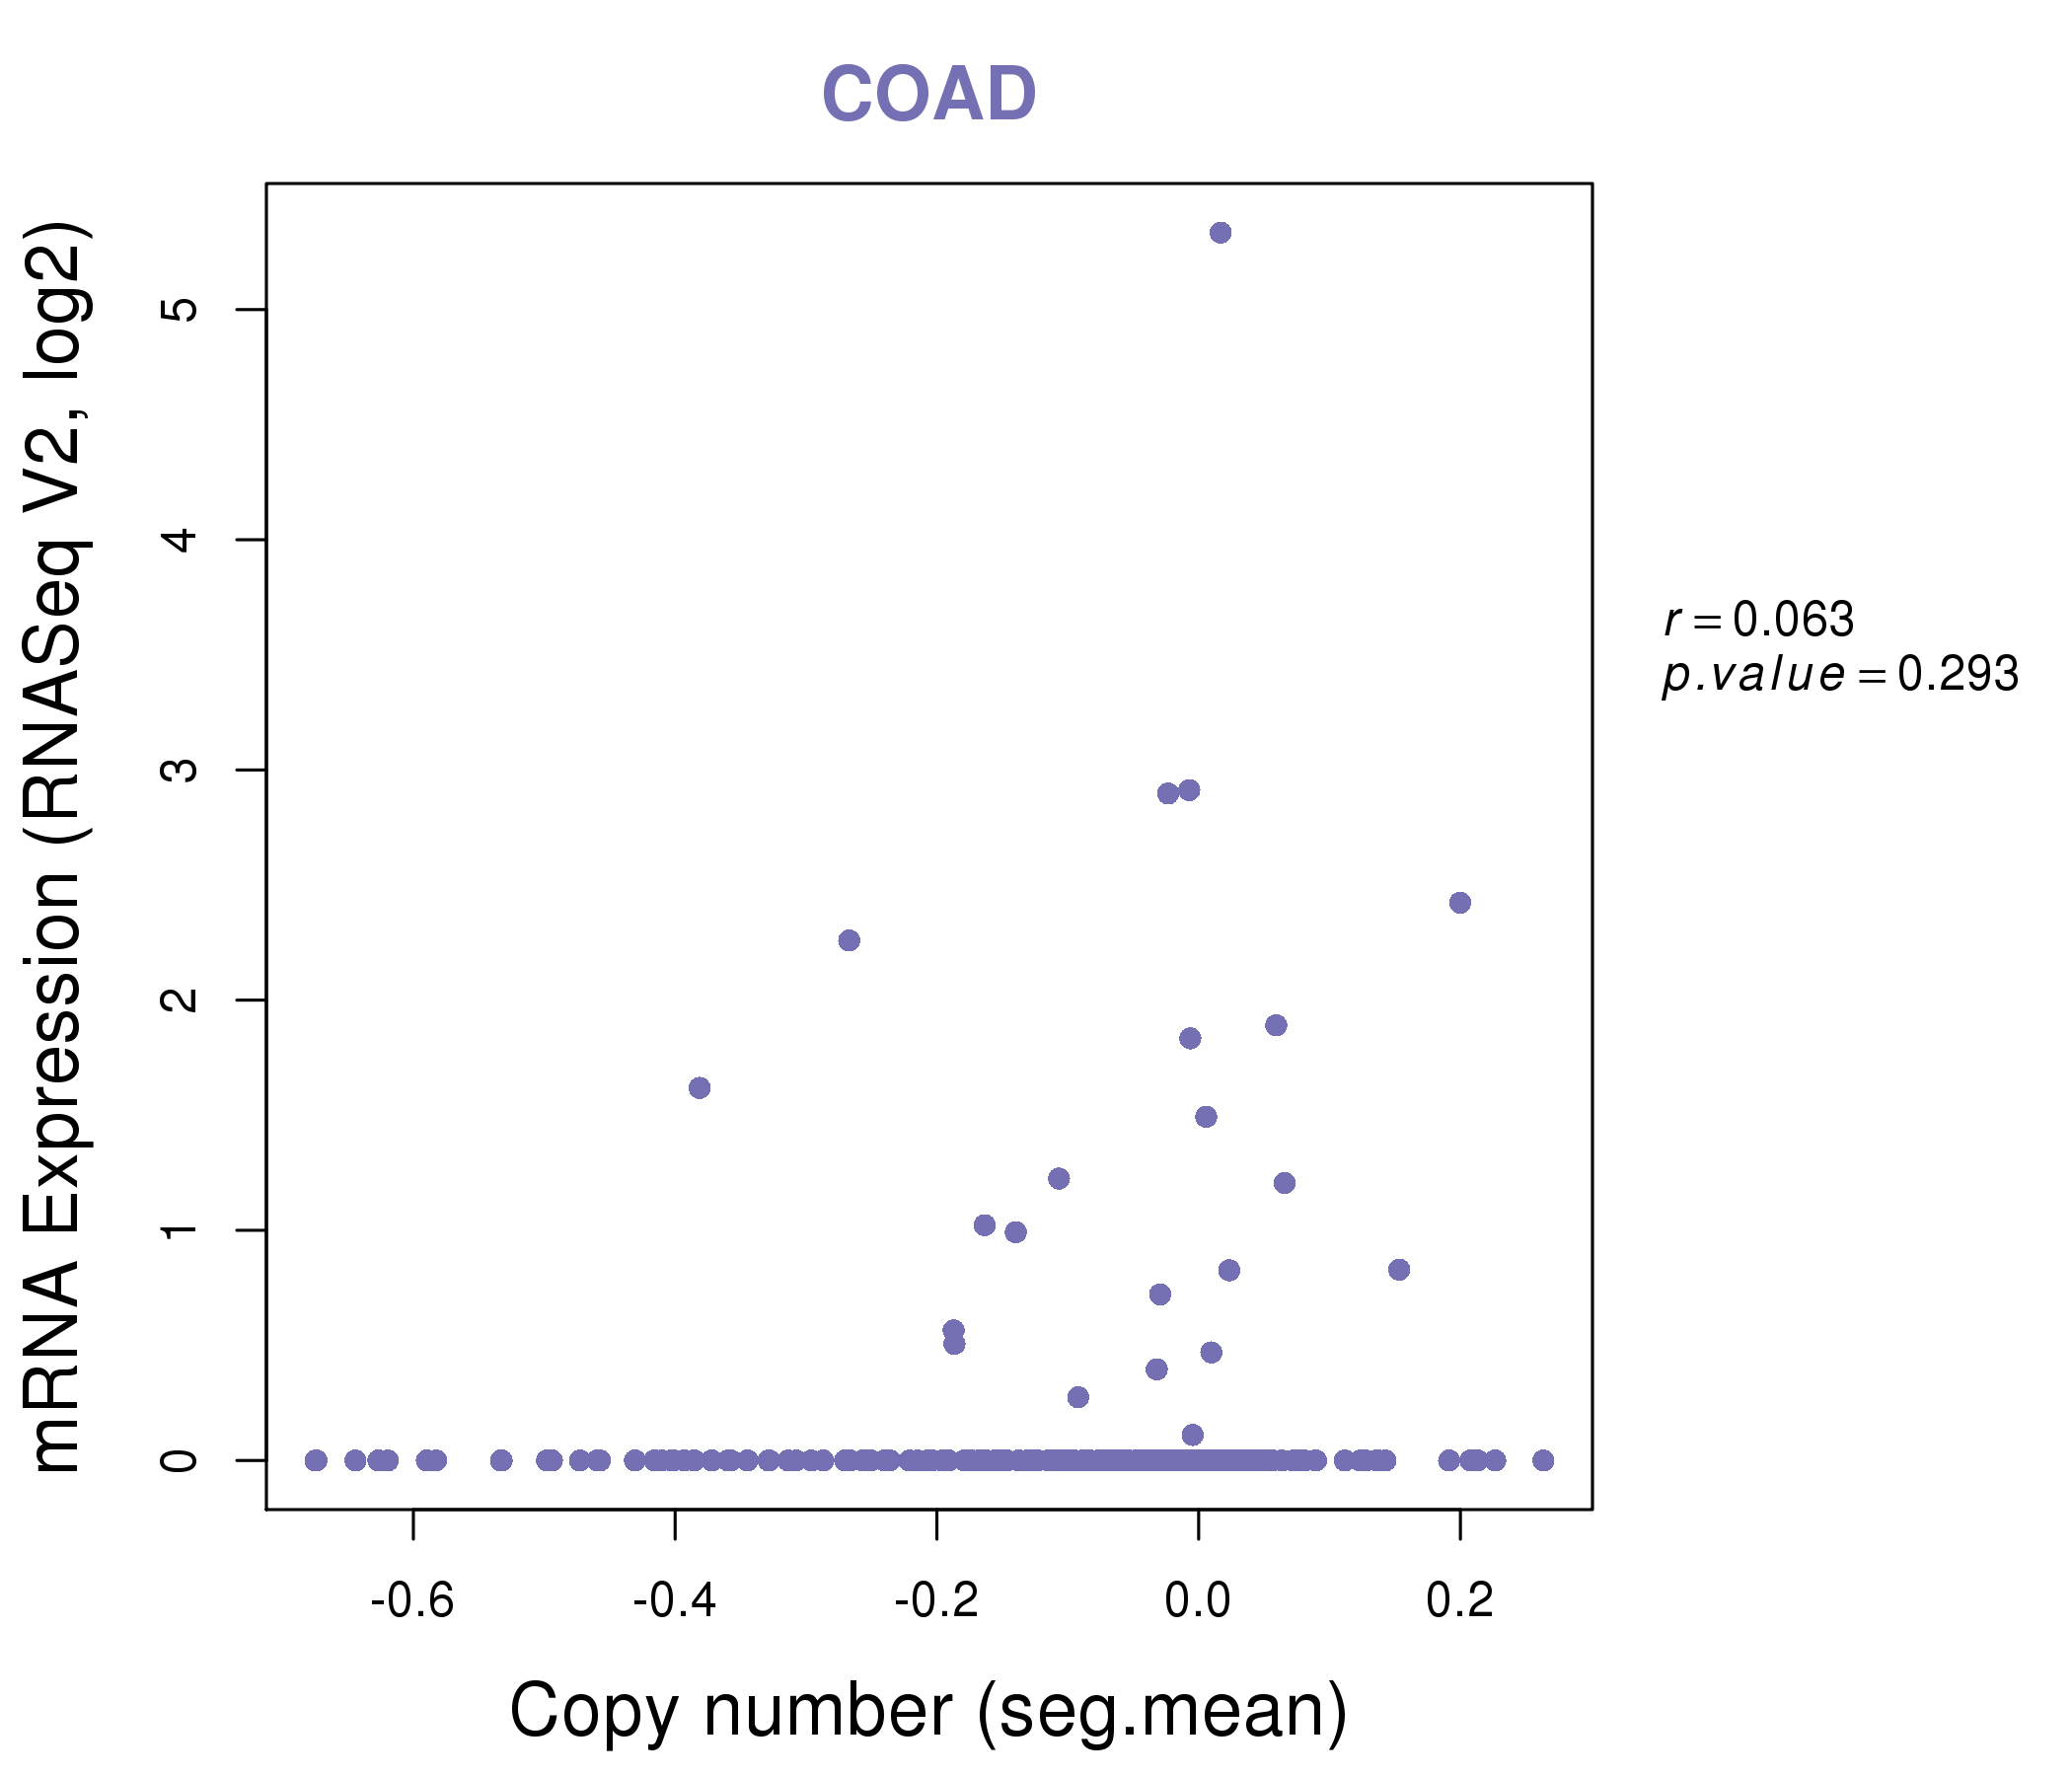
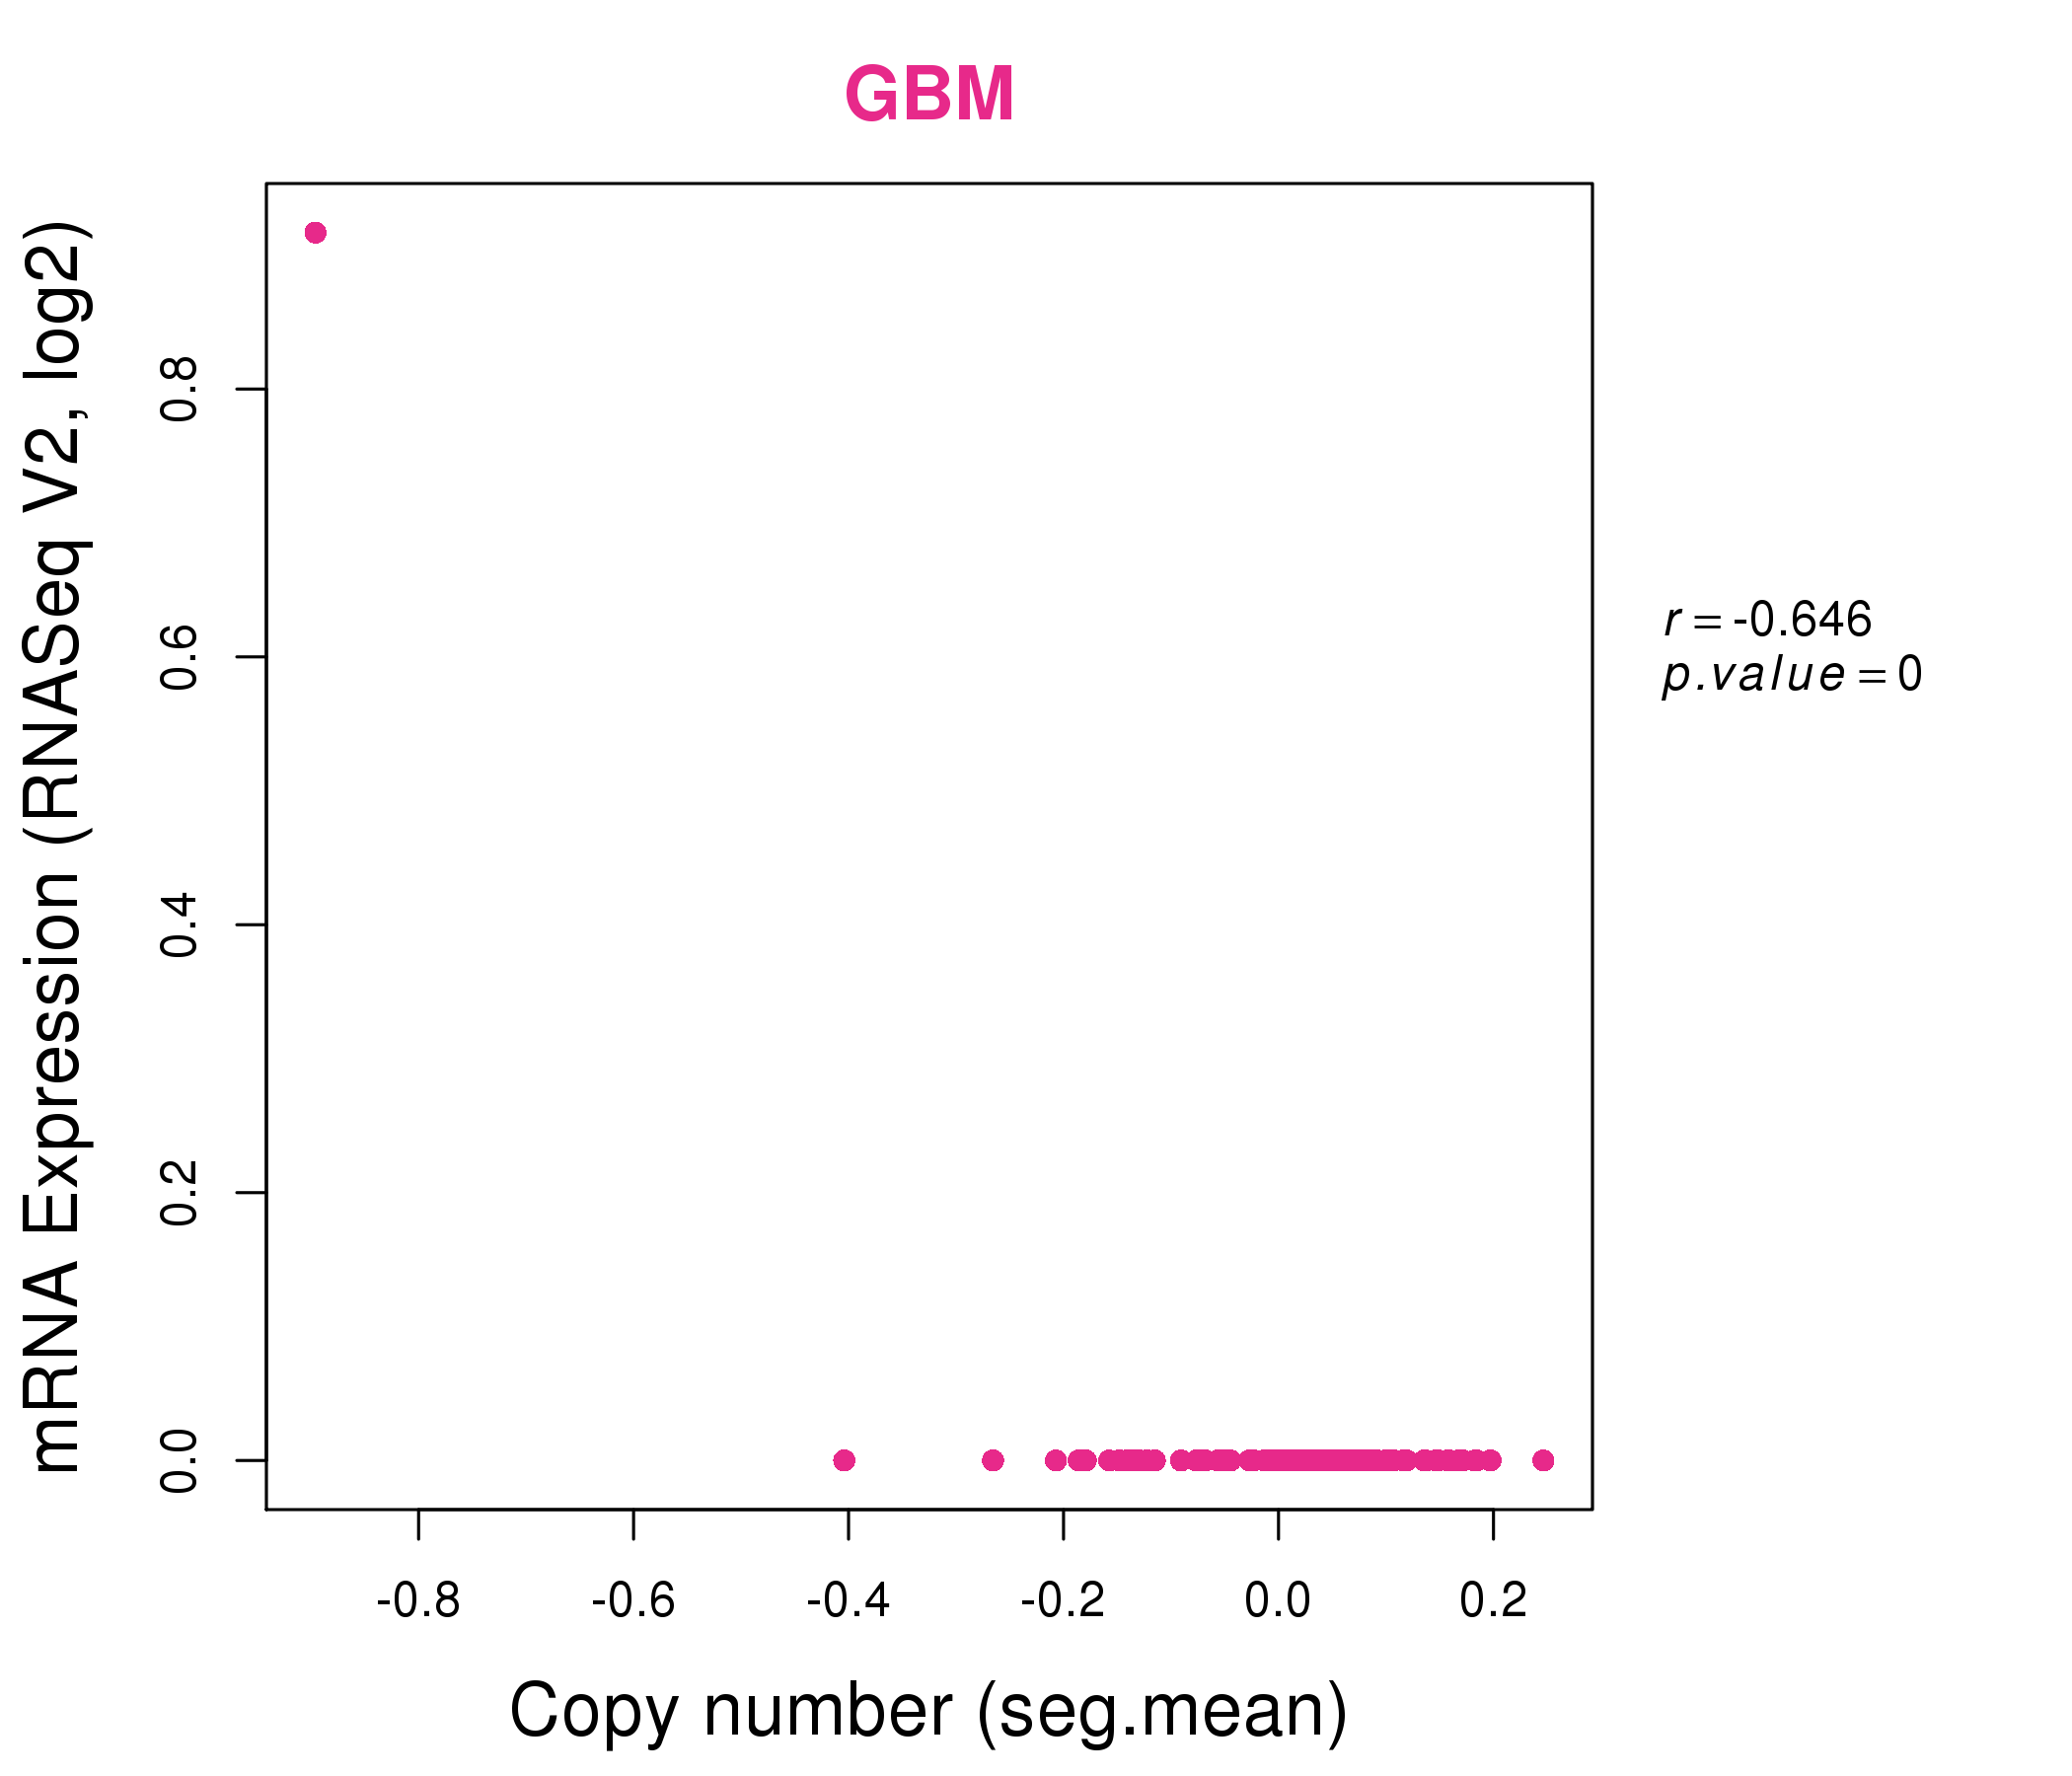
| * Copy number data were extracted from TCGA using R package TCGA-Assembler. The URLs of all public data files on TCGA DCC data server were gathered on Jan-05-2015. Function ProcessCNAData in TCGA-Assembler package was used to obtain gene-level copy number value which is calculated as the average copy number of the genomic region of a gene. |
 |
| cf) Tissue ID[Tissue type]: BLCA[Bladder Urothelial Carcinoma], BRCA[Breast invasive carcinoma], CESC[Cervical squamous cell carcinoma and endocervical adenocarcinoma], COAD[Colon adenocarcinoma], GBM[Glioblastoma multiforme], Glioma Low Grade, HNSC[Head and Neck squamous cell carcinoma], KICH[Kidney Chromophobe], KIRC[Kidney renal clear cell carcinoma], KIRP[Kidney renal papillary cell carcinoma], LAML[Acute Myeloid Leukemia], LUAD[Lung adenocarcinoma], LUSC[Lung squamous cell carcinoma], OV[Ovarian serous cystadenocarcinoma ], PAAD[Pancreatic adenocarcinoma], PRAD[Prostate adenocarcinoma], SKCM[Skin Cutaneous Melanoma], STAD[Stomach adenocarcinoma], THCA[Thyroid carcinoma], UCEC[Uterine Corpus Endometrial Carcinoma] |
| Top |
| Gene Expression for UGT2A1 |
| * CCLE gene expression data were extracted from CCLE_Expression_Entrez_2012-10-18.res: Gene-centric RMA-normalized mRNA expression data. |
 |
| * Normalized gene expression data of RNASeqV2 was extracted from TCGA using R package TCGA-Assembler. The URLs of all public data files on TCGA DCC data server were gathered at Jan-05-2015. Only eight cancer types have enough normal control samples for differential expression analysis. (t test, adjusted p<0.05 (using Benjamini-Hochberg FDR)) |
 |
| Top |
| * This plots show the correlation between CNV and gene expression. |
: Open all plots for all cancer types
 |
|
 |
|

| Top |
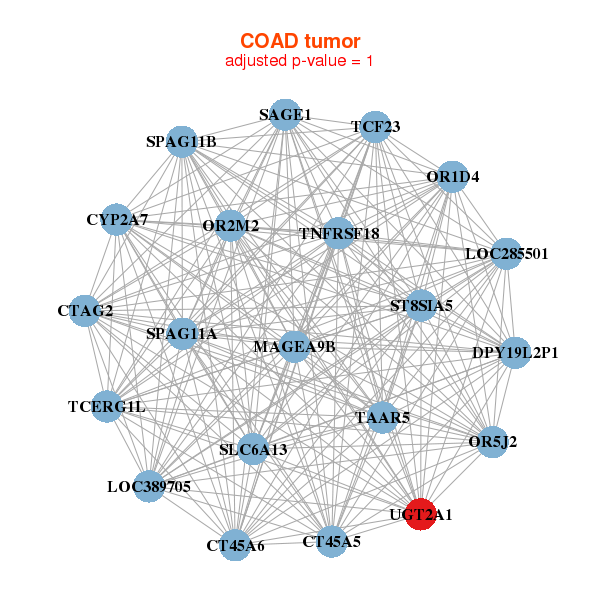
| Gene-Gene Network Information |
| * Co-Expression network figures were drawn using R package igraph. Only the top 20 genes with the highest correlations were shown. Red circle: input gene, orange circle: cell metabolism gene, sky circle: other gene |
: Open all plots for all cancer types
 |
|
| BRF2,C9orf72,CAAP1,EIF4EBP1,FGF13,FGFR1,HOXB4, IFT74,IL19,KLRC2,LOC158696,LOC728024,PLAA,PLAC1, PPAPDC1B,PROSC,RRAGA,SCGB1D4,SPAG16,TUSC3,UGT2A1 | C9orf84,CCL27,CRYAA,DEFB109P1B,IL36A,IRGC,KRT3, KRT84,LOC285740,LINC00159,OR1F1,OR1L1,OTOP3,PPY, RPTN,SCARNA27,SNORA22,SNORA71D,TSHB,UGT2A1,ZNRF4 |
 |
|
| CT45A5,CT45A6,CTAG2,CYP2A7,DPY19L2P1,LOC285501,LOC389705, MAGEA9B,OR1D4,OR2M2,OR5J2,SAGE1,SLC6A13,SPAG11A, SPAG11B,ST8SIA5,TAAR5,TCERG1L,TCF23,TNFRSF18,UGT2A1 | ADH7,AMTN,C6orf15,CT83,PRR32,DUSP13,FOXE1, GAGE12J,KRT13,KRT34,KRT4,KRT6A,KRTAP4-7,LCE1F, LCE4A,SERPINB13,SERPINB4,SSX1,SSX2,TMPRSS11A,UGT2A1 |

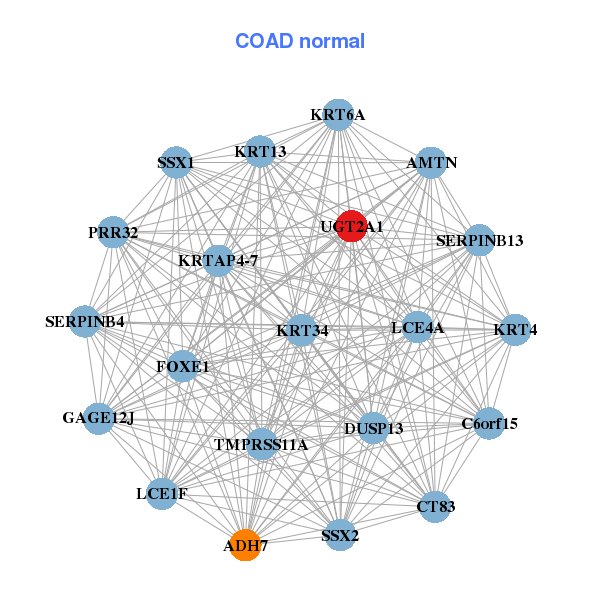
| * Co-Expression network figures were drawn using R package igraph. Only the top 20 genes with the highest correlations were shown. Red circle: input gene, orange circle: cell metabolism gene, sky circle: other gene |
: Open all plots for all cancer types
| Top |
: Open all interacting genes' information including KEGG pathway for all interacting genes from DAVID
| Top |
| Pharmacological Information for UGT2A1 |
| There's no related Drug. |
| Top |
| Cross referenced IDs for UGT2A1 |
| * We obtained these cross-references from Uniprot database. It covers 150 different DBs, 18 categories. http://www.uniprot.org/help/cross_references_section |
: Open all cross reference information
|
Copyright © 2016-Present - The Univsersity of Texas Health Science Center at Houston @ |