|
||||||||||||||||||||
| |
| Phenotypic Information (metabolism pathway, cancer, disease, phenome) |
| |
| |
| Gene-Gene Network Information: Co-Expression Network, Interacting Genes & KEGG |
| |
|


| Gene Summary for POLR1A |
| Basic gene info. | Gene symbol | POLR1A |
| Gene name | polymerase (RNA) I polypeptide A, 194kDa | |
| Synonyms | A190|RPA1|RPA194|RPO1-4|RPO14 | |
| Cytomap | UCSC genome browser: 2p11.2 | |
| Genomic location | chr2 :86253450-86333278 | |
| Type of gene | protein-coding | |
| RefGenes | NM_015425.3, | |
| Ensembl id | ENSG00000068654 | |
| Description | DNA-directed RNA polymerase I largest subunitDNA-directed RNA polymerase I subunit ADNA-directed RNA polymerase I subunit A1DNA-directed RNA polymerase I subunit RPA1RNA polymerase I 194 kDa subunitRNA polymerase I subunit A1 | |
| Modification date | 20141207 | |
| dbXrefs | HGNC : HGNC | |
| Ensembl : ENSG00000068654 | ||
| HPRD : 10161 | ||
| Vega : OTTHUMG00000153165 | ||
| Protein | UniProt: O95602 go to UniProt's Cross Reference DB Table | |
| Expression | CleanEX: HS_POLR1A | |
| BioGPS: 25885 | ||
| Gene Expression Atlas: ENSG00000068654 | ||
| The Human Protein Atlas: ENSG00000068654 | ||
| Pathway | NCI Pathway Interaction Database: POLR1A | |
| KEGG: POLR1A | ||
| REACTOME: POLR1A | ||
| ConsensusPathDB | ||
| Pathway Commons: POLR1A | ||
| Metabolism | MetaCyc: POLR1A | |
| HUMANCyc: POLR1A | ||
| Regulation | Ensembl's Regulation: ENSG00000068654 | |
| miRBase: chr2 :86,253,450-86,333,278 | ||
| TargetScan: NM_015425 | ||
| cisRED: ENSG00000068654 | ||
| Context | iHOP: POLR1A | |
| cancer metabolism search in PubMed: POLR1A | ||
| UCL Cancer Institute: POLR1A | ||
| Assigned class in ccmGDB | B - This gene belongs to cancer gene. | |
| Top |
| Phenotypic Information for POLR1A(metabolism pathway, cancer, disease, phenome) |
| Cancer | CGAP: POLR1A |
| Familial Cancer Database: POLR1A | |
| * This gene is included in those cancer gene databases. |
|
|
|
|
|
| . | ||||||||||||||
Oncogene 1 | Significant driver gene in | |||||||||||||||||||
| cf) number; DB name 1 Oncogene; http://nar.oxfordjournals.org/content/35/suppl_1/D721.long, 2 Tumor Suppressor gene; https://bioinfo.uth.edu/TSGene/, 3 Cancer Gene Census; http://www.nature.com/nrc/journal/v4/n3/abs/nrc1299.html, 4 CancerGenes; http://nar.oxfordjournals.org/content/35/suppl_1/D721.long, 5 Network of Cancer Gene; http://ncg.kcl.ac.uk/index.php, 1Therapeutic Vulnerabilities in Cancer; http://cbio.mskcc.org/cancergenomics/statius/ |
| KEGG_PURINE_METABOLISM KEGG_PYRIMIDINE_METABOLISM | |
| OMIM | |
| Orphanet | |
| Disease | KEGG Disease: POLR1A |
| MedGen: POLR1A (Human Medical Genetics with Condition) | |
| ClinVar: POLR1A | |
| Phenotype | MGI: POLR1A (International Mouse Phenotyping Consortium) |
| PhenomicDB: POLR1A | |
| Mutations for POLR1A |
| * Under tables are showing count per each tissue to give us broad intuition about tissue specific mutation patterns.You can go to the detailed page for each mutation database's web site. |
| - Statistics for Tissue and Mutation type | Top |
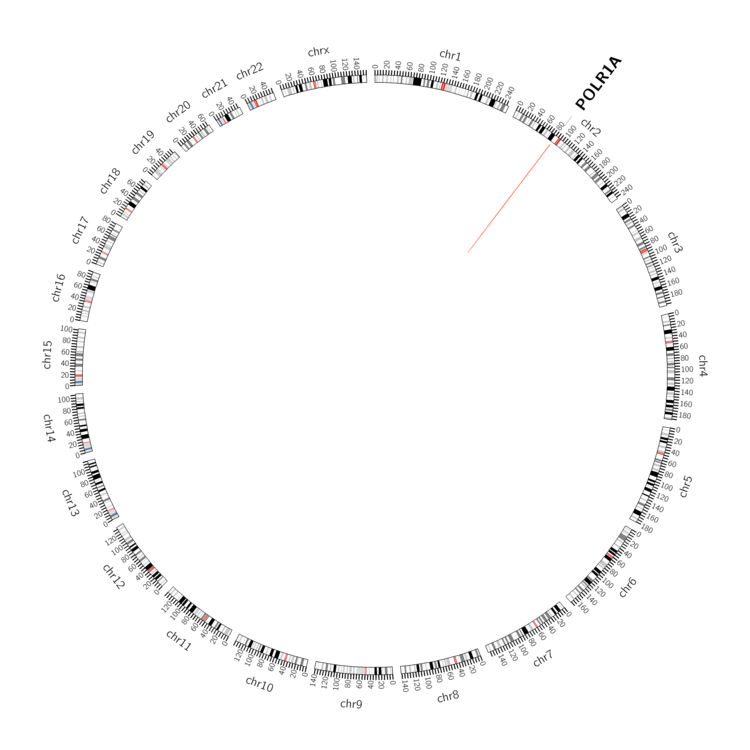 |
| - For Inter-chromosomal Variations |
| There's no inter-chromosomal structural variation. |
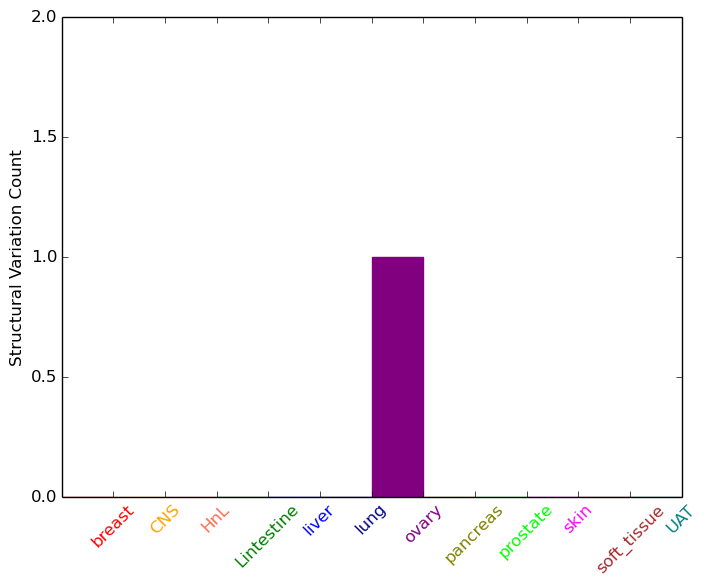
| - For Intra-chromosomal Variations |
| * Intra-chromosomal variantions includes 'intrachromosomal amplicon to amplicon', 'intrachromosomal amplicon to non-amplified dna', 'intrachromosomal deletion', 'intrachromosomal fold-back inversion', 'intrachromosomal inversion', 'intrachromosomal tandem duplication', 'Intrachromosomal unknown type', 'intrachromosomal with inverted orientation', 'intrachromosomal with non-inverted orientation'. |
 |
| Sample | Symbol_a | Chr_a | Start_a | End_a | Symbol_b | Chr_b | Start_b | End_b |
| ovary | POLR1A | chr2 | 86287231 | 86287251 | chr2 | 85110942 | 85110962 |
| cf) Tissue number; Tissue name (1;Breast, 2;Central_nervous_system, 3;Haematopoietic_and_lymphoid_tissue, 4;Large_intestine, 5;Liver, 6;Lung, 7;Ovary, 8;Pancreas, 9;Prostate, 10;Skin, 11;Soft_tissue, 12;Upper_aerodigestive_tract) |
| * From mRNA Sanger sequences, Chitars2.0 arranged chimeric transcripts. This table shows POLR1A related fusion information. |
| ID | Head Gene | Tail Gene | Accession | Gene_a | qStart_a | qEnd_a | Chromosome_a | tStart_a | tEnd_a | Gene_a | qStart_a | qEnd_a | Chromosome_a | tStart_a | tEnd_a |
| AI742345 | METTL17 | 11 | 341 | 14 | 21464791 | 21465194 | POLR1A | 334 | 485 | 2 | 86253966 | 86254117 | |
| BE550643 | POLR1A | 1 | 126 | 2 | 86268989 | 86269114 | PILRA | 122 | 342 | 7 | 99973792 | 99974012 | |
| Top |
| There's no copy number variation information in COSMIC data for this gene. |
| Top |
|
 |
| Top |
| Stat. for Non-Synonymous SNVs (# total SNVs=103) | (# total SNVs=37) |
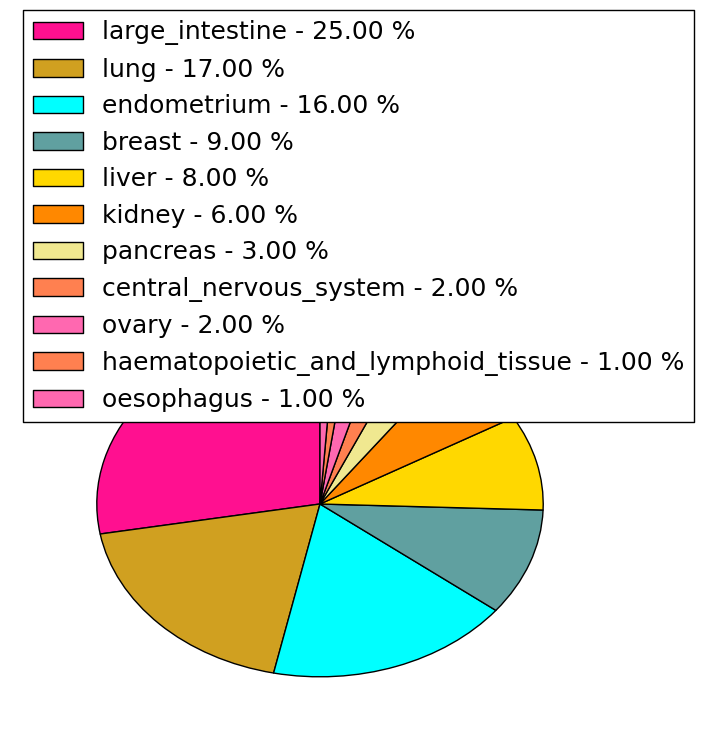 | 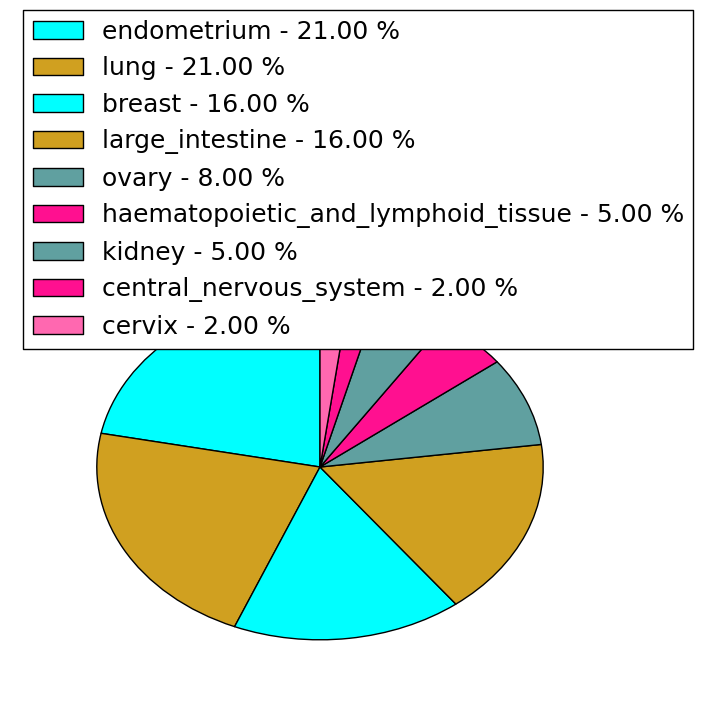 |
(# total SNVs=2) | (# total SNVs=0) |
 |
| Top |
| * When you move the cursor on each content, you can see more deailed mutation information on the Tooltip. Those are primary_site,primary_histology,mutation(aa),pubmedID. |
| GRCh37 position | Mutation(aa) | Unique sampleID count |
| chr2:86259443-86259443 | p.G1408G | 5 |
| chr2:86271264-86271264 | p.E1045K | 3 |
| chr2:86269132-86269132 | p.R1151H | 2 |
| chr2:86327173-86327173 | p.C67F | 2 |
| chr2:86292415-86292415 | p.P680P | 2 |
| chr2:86327194-86327194 | p.S60F | 2 |
| chr2:86255054-86255054 | p.M1672I | 2 |
| chr2:86276363-86276363 | p.V799M | 2 |
| chr2:86274364-86274364 | p.H886L | 2 |
| chr2:86270302-86270302 | p.Q1051P | 2 |
| Top |
|
 |
| Point Mutation/ Tissue ID | 1 | 2 | 3 | 4 | 5 | 6 | 7 | 8 | 9 | 10 | 11 | 12 | 13 | 14 | 15 | 16 | 17 | 18 | 19 | 20 |
| # sample | 7 | 8 | 3 | 14 | 2 | 7 | 1 | 6 | 1 | 12 | 6 | 5 | 13 | 18 | 1 | 17 | ||||
| # mutation | 8 | 9 | 3 | 16 | 2 | 7 | 1 | 6 | 1 | 16 | 7 | 5 | 15 | 19 | 1 | 22 | ||||
| nonsynonymous SNV | 5 | 5 | 2 | 12 | 2 | 4 | 1 | 4 | 1 | 11 | 3 | 2 | 11 | 13 | 1 | 15 | ||||
| synonymous SNV | 3 | 4 | 1 | 4 | 3 | 2 | 5 | 4 | 3 | 4 | 6 | 7 |
| cf) Tissue ID; Tissue type (1; BLCA[Bladder Urothelial Carcinoma], 2; BRCA[Breast invasive carcinoma], 3; CESC[Cervical squamous cell carcinoma and endocervical adenocarcinoma], 4; COAD[Colon adenocarcinoma], 5; GBM[Glioblastoma multiforme], 6; Glioma Low Grade, 7; HNSC[Head and Neck squamous cell carcinoma], 8; KICH[Kidney Chromophobe], 9; KIRC[Kidney renal clear cell carcinoma], 10; KIRP[Kidney renal papillary cell carcinoma], 11; LAML[Acute Myeloid Leukemia], 12; LUAD[Lung adenocarcinoma], 13; LUSC[Lung squamous cell carcinoma], 14; OV[Ovarian serous cystadenocarcinoma ], 15; PAAD[Pancreatic adenocarcinoma], 16; PRAD[Prostate adenocarcinoma], 17; SKCM[Skin Cutaneous Melanoma], 18:STAD[Stomach adenocarcinoma], 19:THCA[Thyroid carcinoma], 20:UCEC[Uterine Corpus Endometrial Carcinoma]) |
| Top |
| * We represented just top 10 SNVs. When you move the cursor on each content, you can see more deailed mutation information on the Tooltip. Those are primary_site, primary_histology, mutation(aa), pubmedID. |
| Genomic Position | Mutation(aa) | Unique sampleID count |
| chr2:86269132 | p.C67F | 2 |
| chr2:86327173 | p.S60F | 2 |
| chr2:86327194 | p.R1249L | 2 |
| chr2:86266580 | p.G1703R | 2 |
| chr2:86254602 | p.R1151H | 2 |
| chr2:86302279 | p.P927L | 1 |
| chr2:86254644 | p.L681L | 1 |
| chr2:86325778 | p.S1677S | 1 |
| chr2:86259429 | p.P488L | 1 |
| chr2:86272844 | p.D1513G | 1 |
| * Copy number data were extracted from TCGA using R package TCGA-Assembler. The URLs of all public data files on TCGA DCC data server were gathered on Jan-05-2015. Function ProcessCNAData in TCGA-Assembler package was used to obtain gene-level copy number value which is calculated as the average copy number of the genomic region of a gene. |
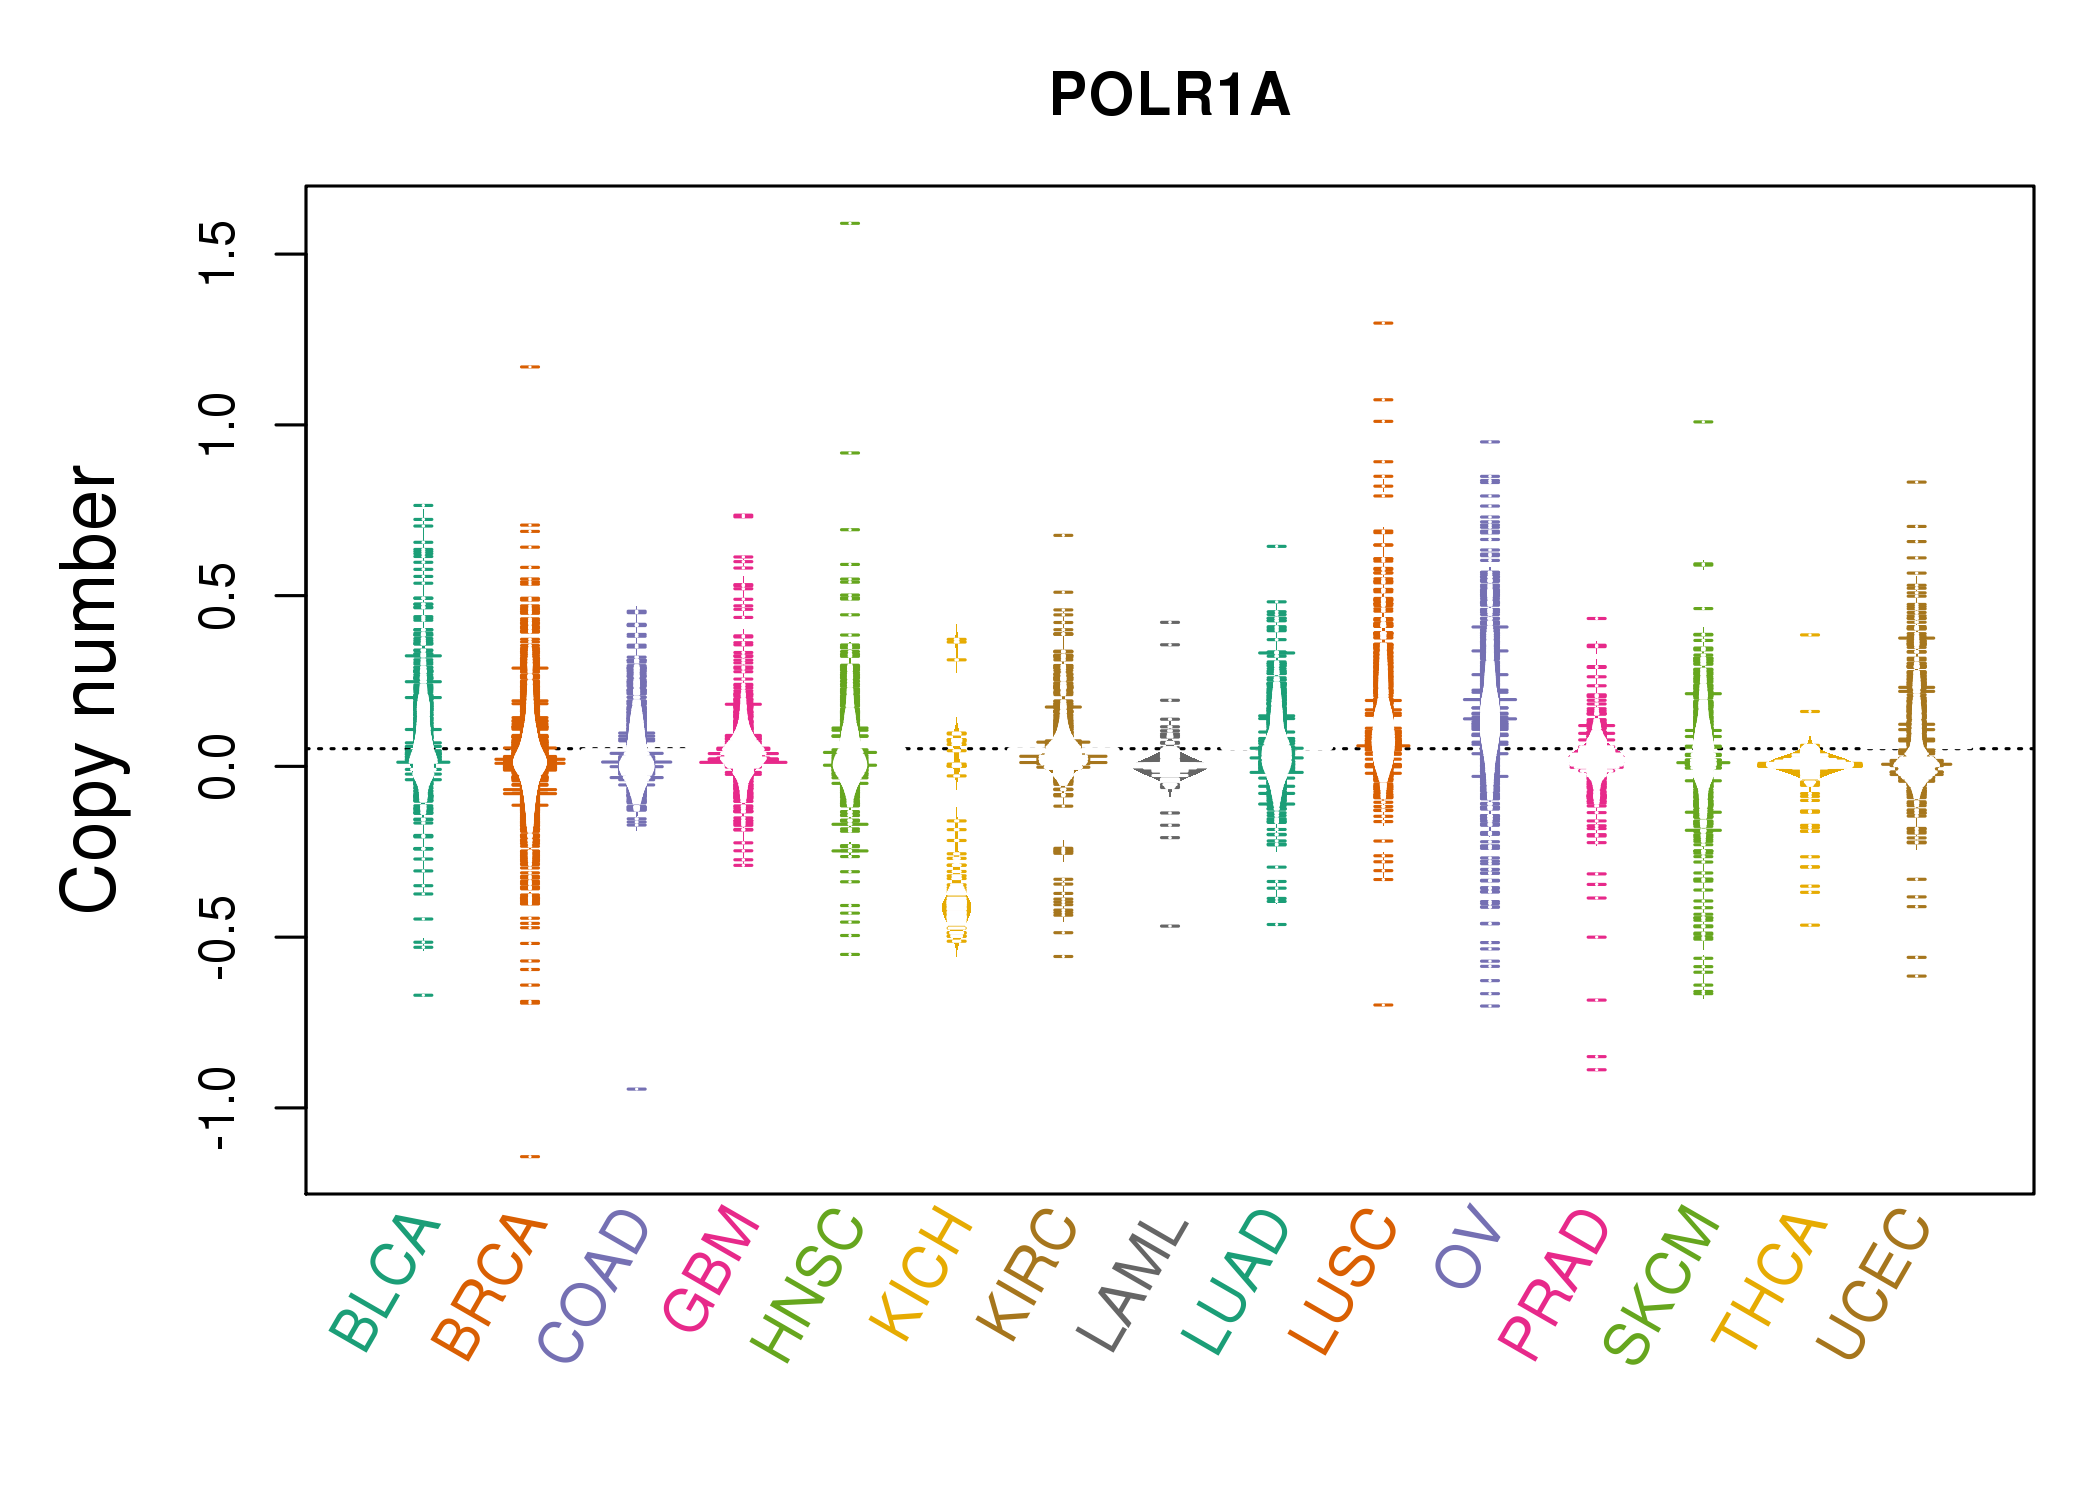 |
| cf) Tissue ID[Tissue type]: BLCA[Bladder Urothelial Carcinoma], BRCA[Breast invasive carcinoma], CESC[Cervical squamous cell carcinoma and endocervical adenocarcinoma], COAD[Colon adenocarcinoma], GBM[Glioblastoma multiforme], Glioma Low Grade, HNSC[Head and Neck squamous cell carcinoma], KICH[Kidney Chromophobe], KIRC[Kidney renal clear cell carcinoma], KIRP[Kidney renal papillary cell carcinoma], LAML[Acute Myeloid Leukemia], LUAD[Lung adenocarcinoma], LUSC[Lung squamous cell carcinoma], OV[Ovarian serous cystadenocarcinoma ], PAAD[Pancreatic adenocarcinoma], PRAD[Prostate adenocarcinoma], SKCM[Skin Cutaneous Melanoma], STAD[Stomach adenocarcinoma], THCA[Thyroid carcinoma], UCEC[Uterine Corpus Endometrial Carcinoma] |
| Top |
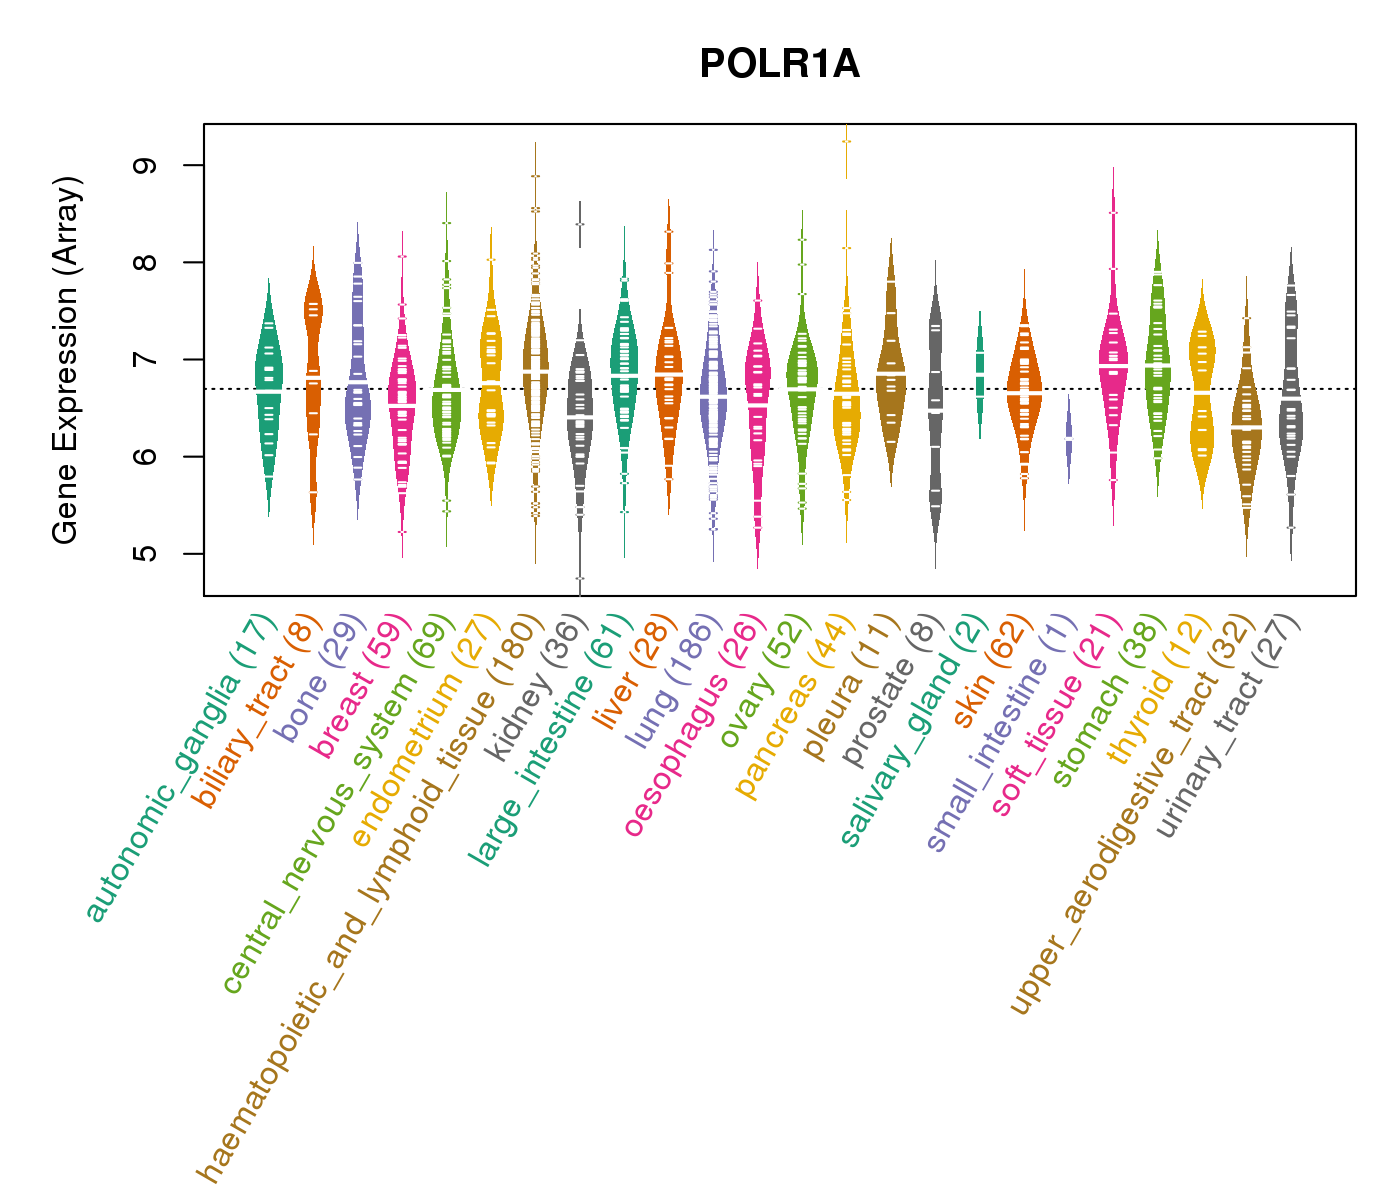
| Gene Expression for POLR1A |
| * CCLE gene expression data were extracted from CCLE_Expression_Entrez_2012-10-18.res: Gene-centric RMA-normalized mRNA expression data. |
 |
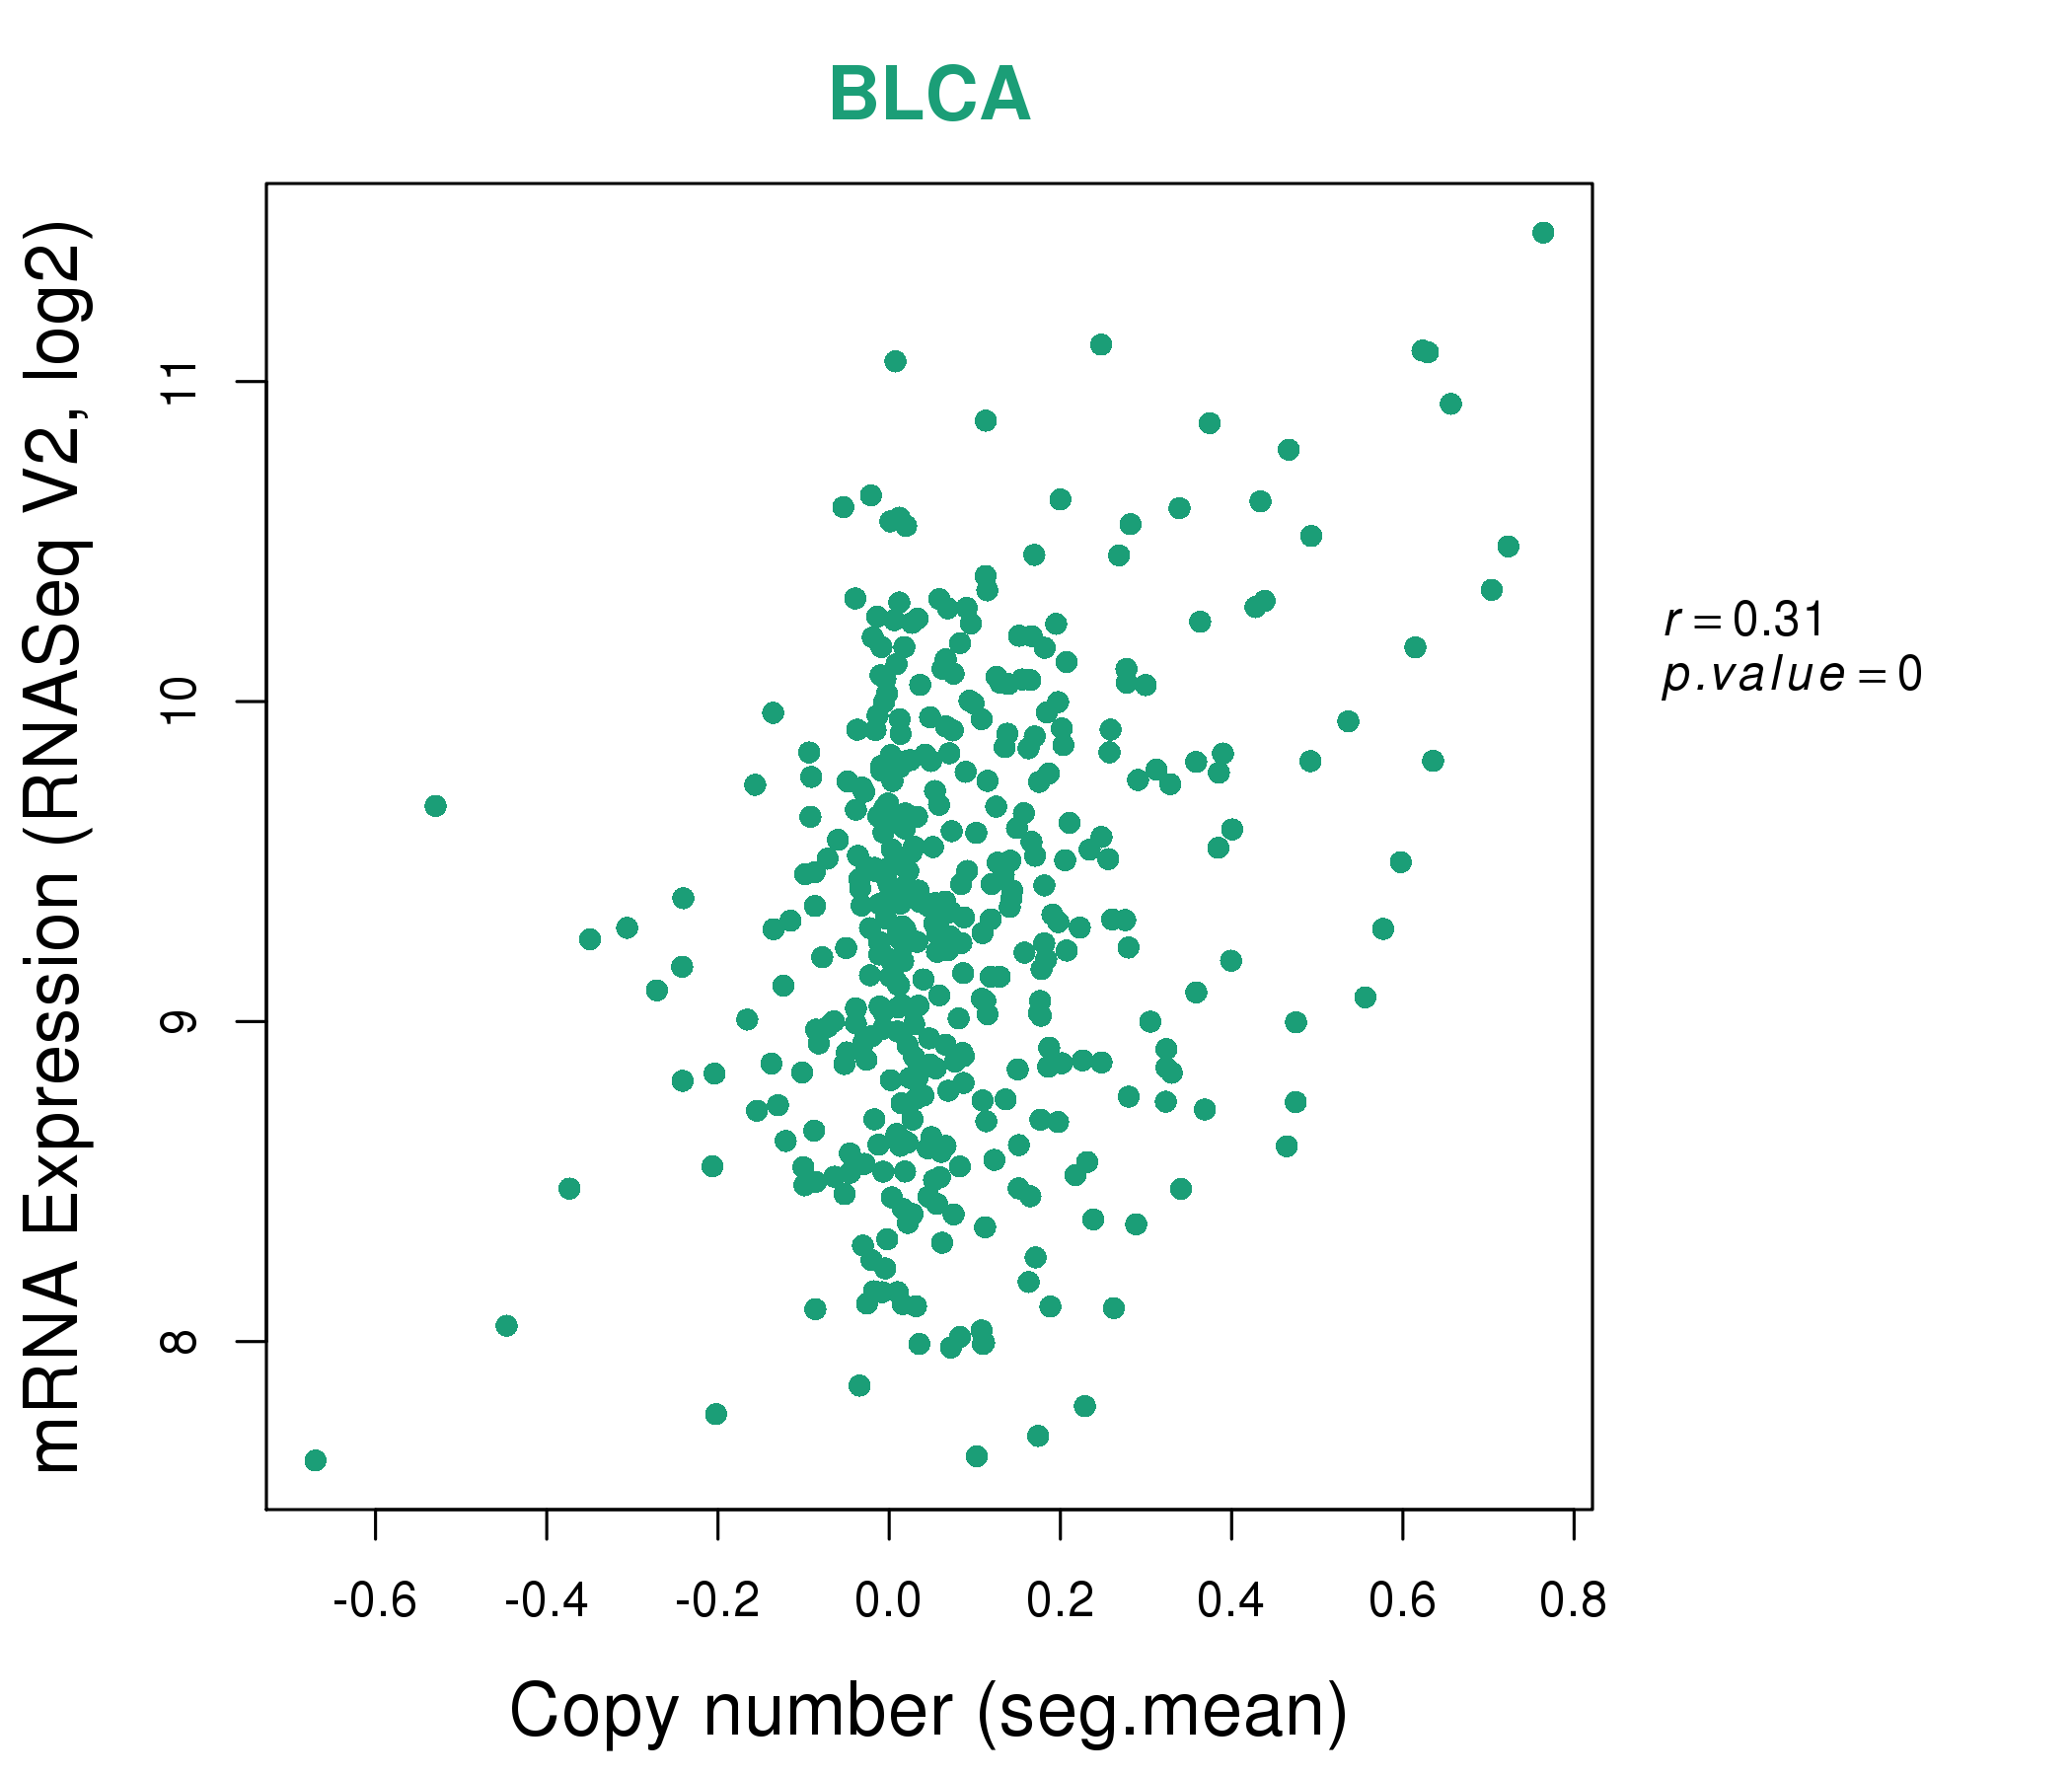
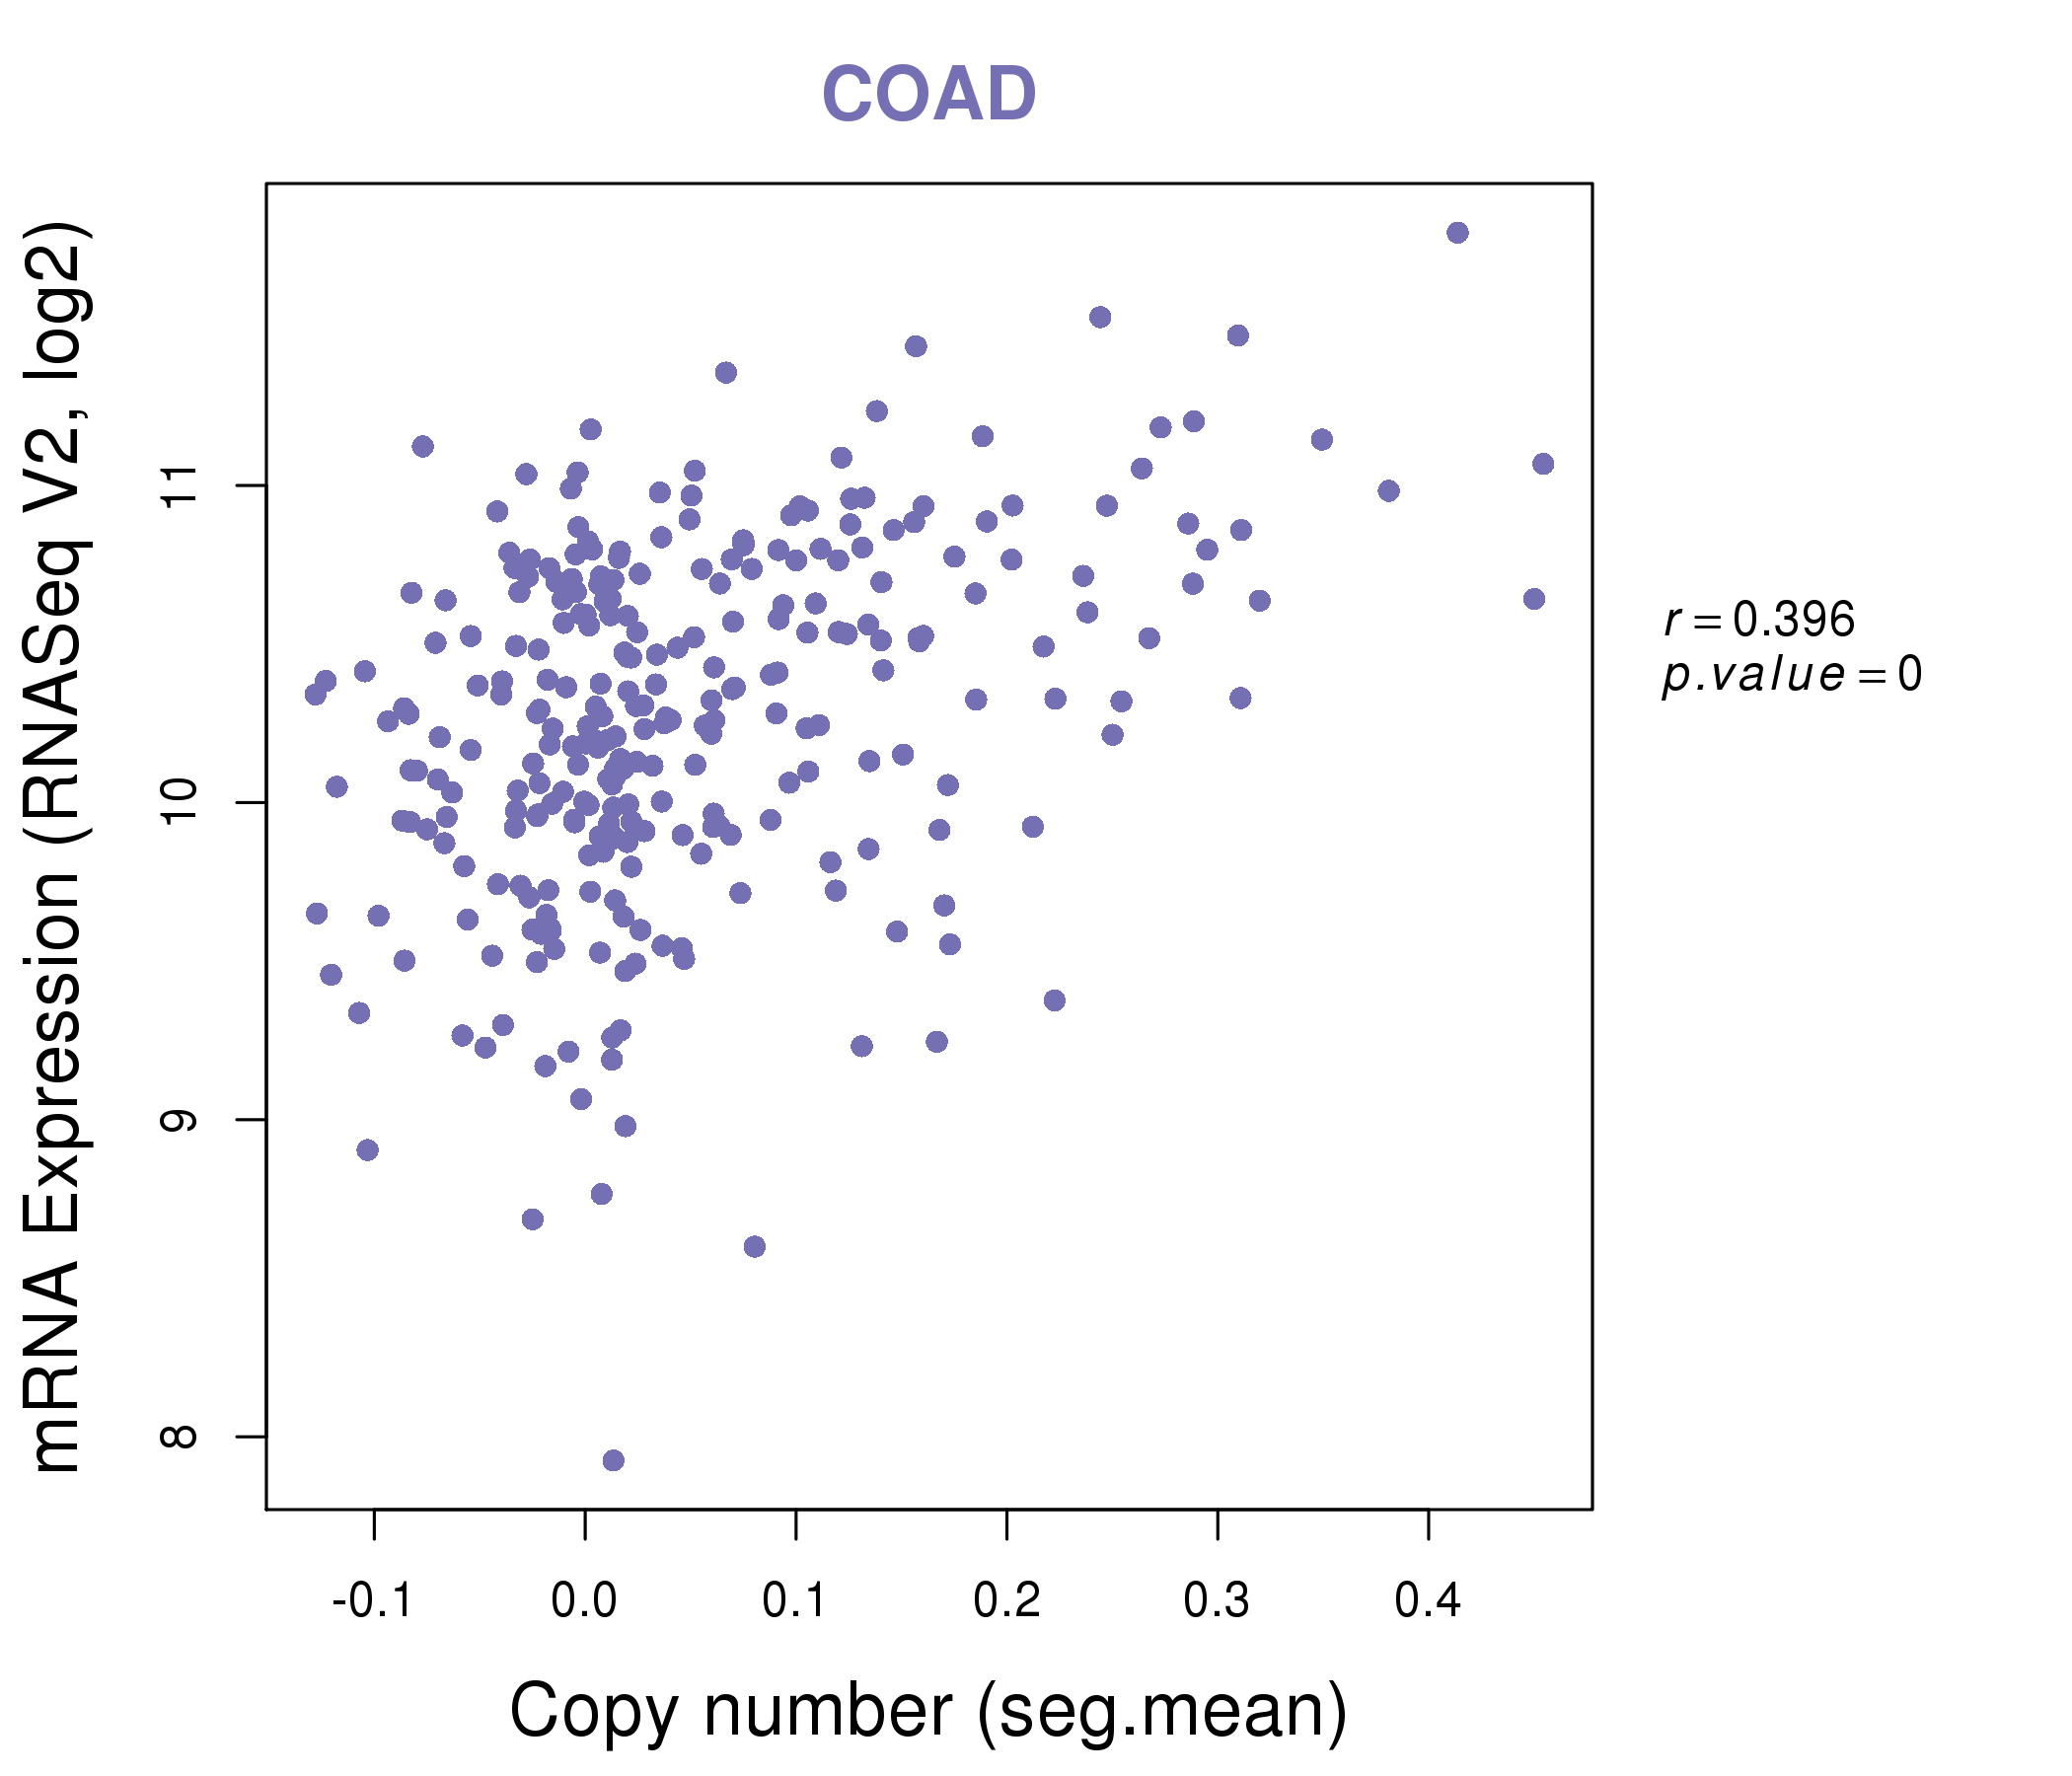
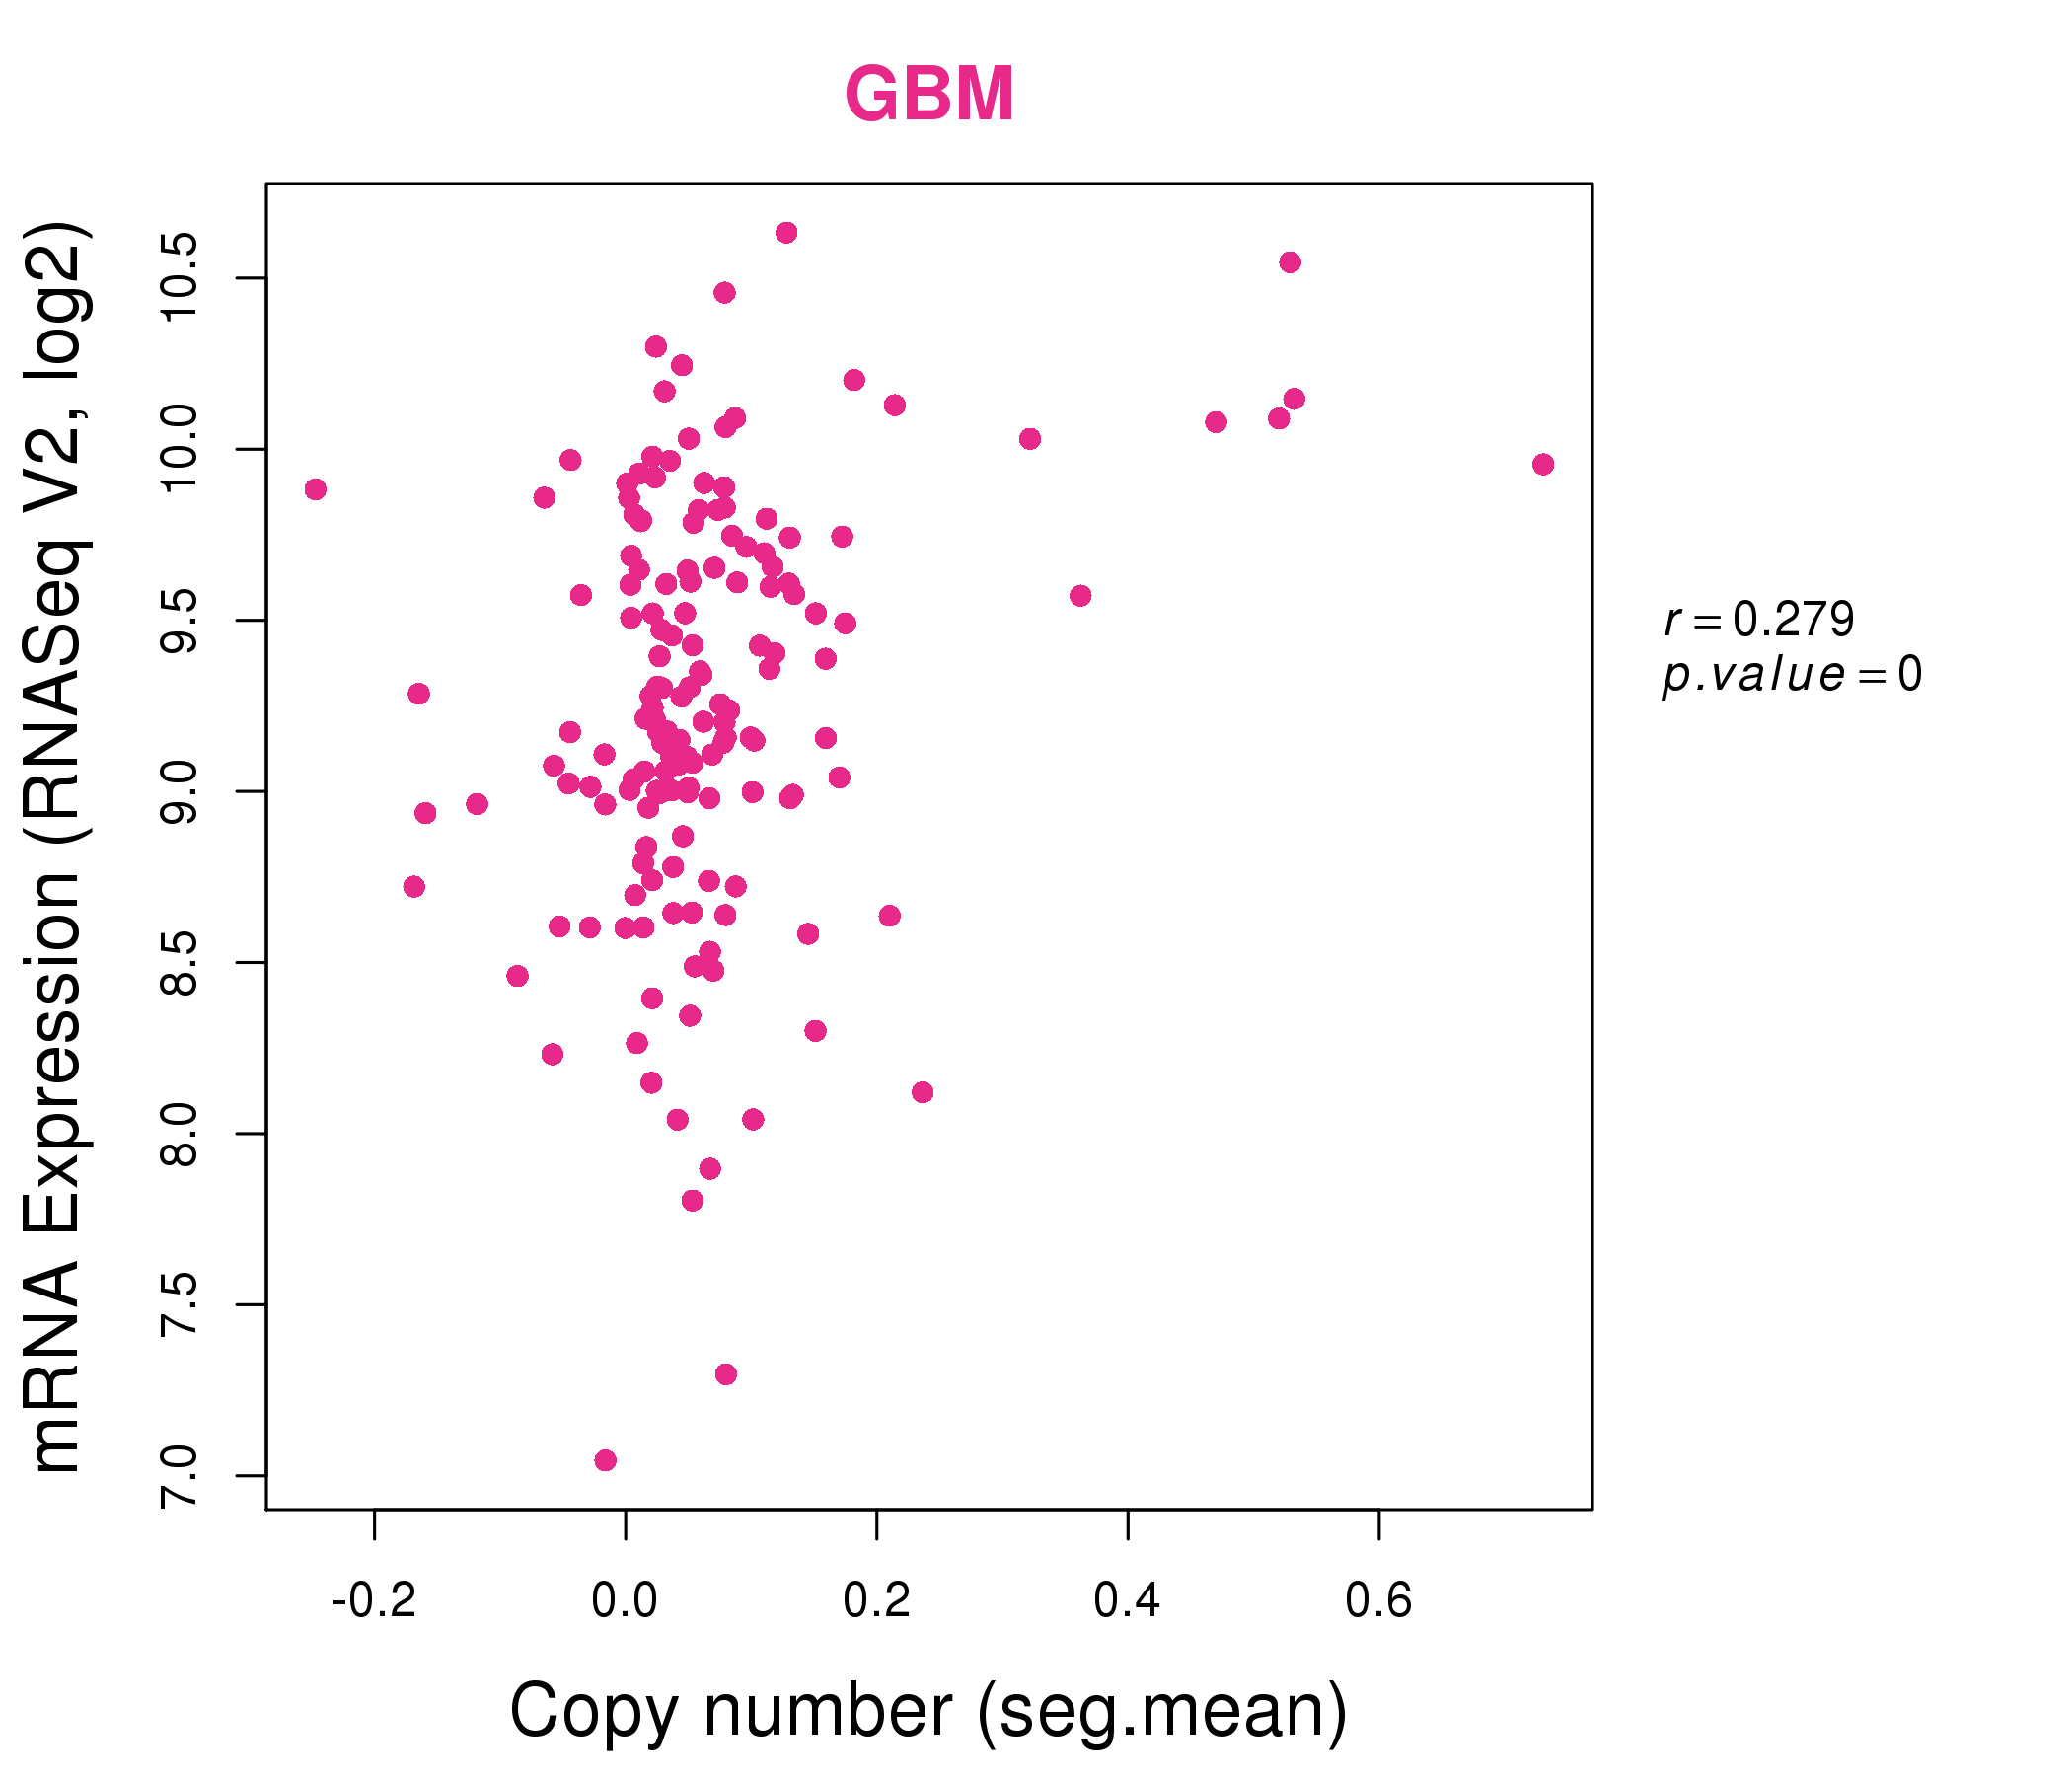
| * Normalized gene expression data of RNASeqV2 was extracted from TCGA using R package TCGA-Assembler. The URLs of all public data files on TCGA DCC data server were gathered at Jan-05-2015. Only eight cancer types have enough normal control samples for differential expression analysis. (t test, adjusted p<0.05 (using Benjamini-Hochberg FDR)) |
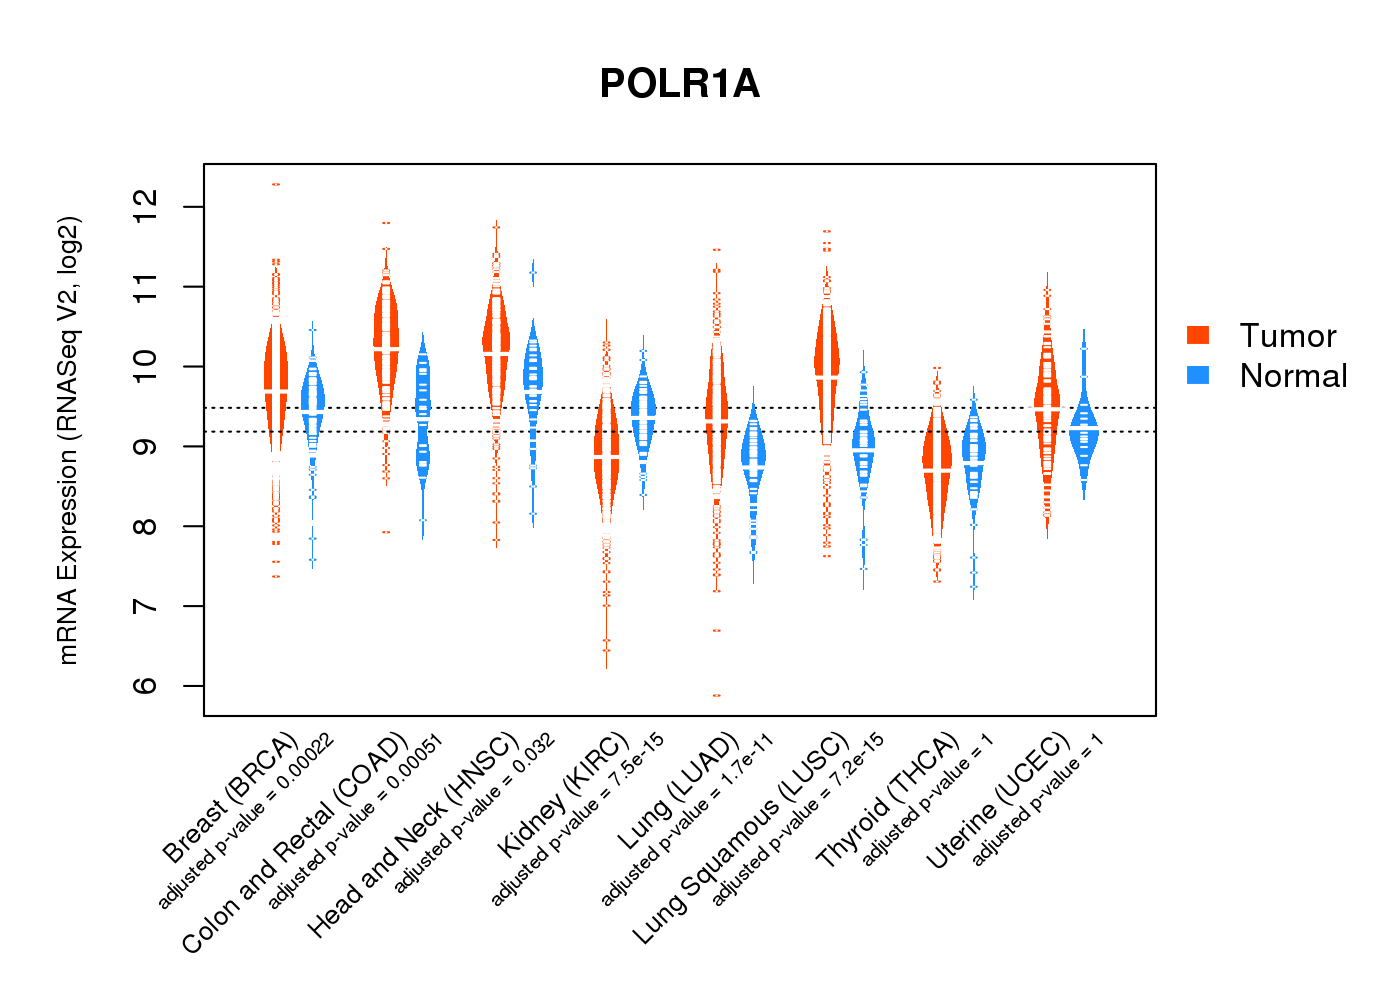 |
| Top |
| * This plots show the correlation between CNV and gene expression. |
: Open all plots for all cancer types
 |
|
 |
|

| Top |
| Gene-Gene Network Information |
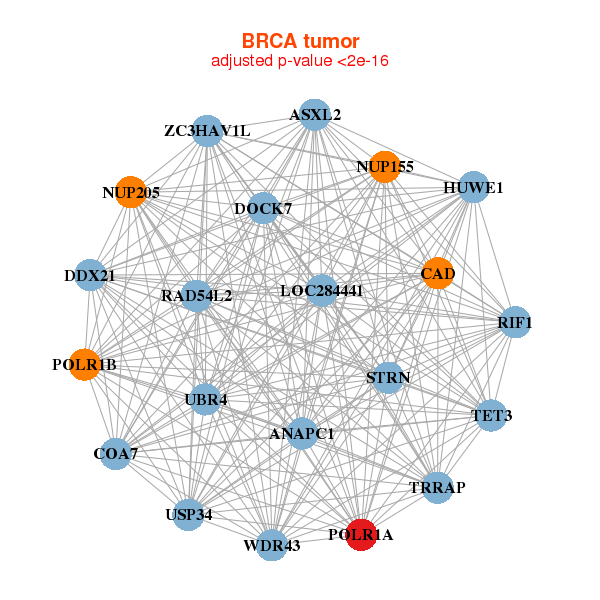
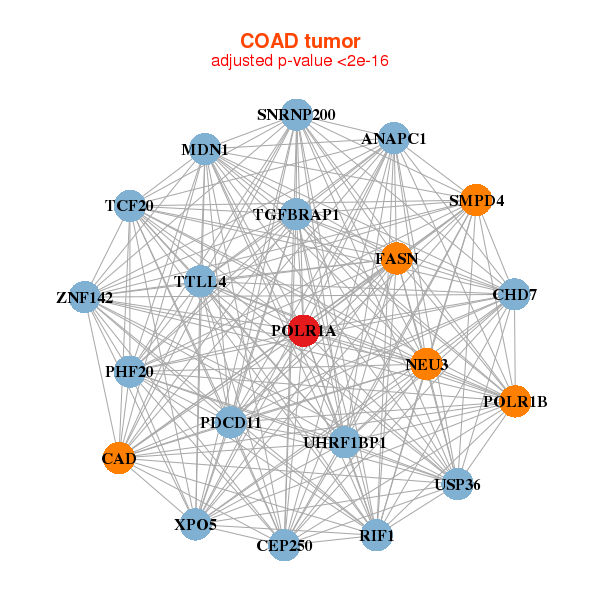
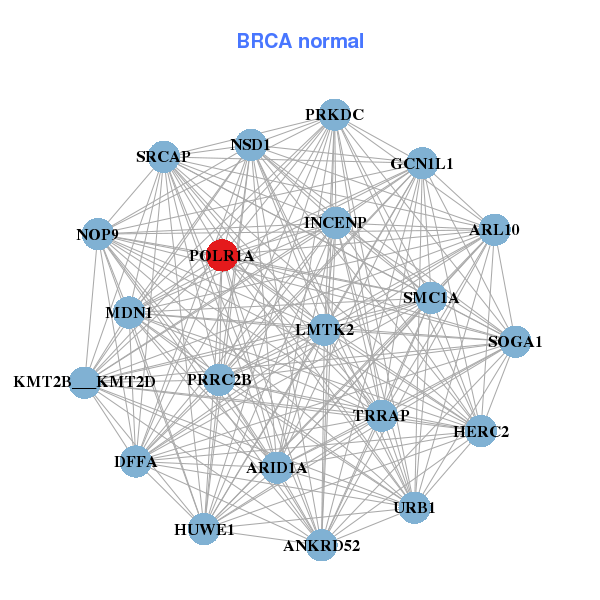
| * Co-Expression network figures were drawn using R package igraph. Only the top 20 genes with the highest correlations were shown. Red circle: input gene, orange circle: cell metabolism gene, sky circle: other gene |
: Open all plots for all cancer types
 |
|
| ANAPC1,ASXL2,COA7,CAD,DDX21,DOCK7,HUWE1, LOC284441,NUP155,NUP205,POLR1A,POLR1B,RAD54L2,RIF1, STRN,TET3,TRRAP,UBR4,USP34,WDR43,ZC3HAV1L | ANKRD52,ARID1A,ARL10,PRRC2B,NOP9,SOGA1,DFFA, GCN1L1,HERC2,HUWE1,INCENP,LMTK2,MDN1,KMT2B___KMT2D, NSD1,POLR1A,PRKDC,SMC1A,SRCAP,TRRAP,URB1 |
 |
|
| ANAPC1,CAD,CEP250,CHD7,FASN,MDN1,NEU3, PDCD11,PHF20,POLR1A,POLR1B,RIF1,SMPD4,SNRNP200, TCF20,TGFBRAP1,TTLL4,UHRF1BP1,USP36,XPO5,ZNF142 | ACACA,BMS1,NOP9,CAD,CKAP5,GCN1L1,HEATR1, ILF3,EMC1,LARP1,MDN1,NAT10,NUP188,NUP214, PDCD11,PFAS,POLR1A,PRKDC,URB1,XPO5,ZC3H18 |
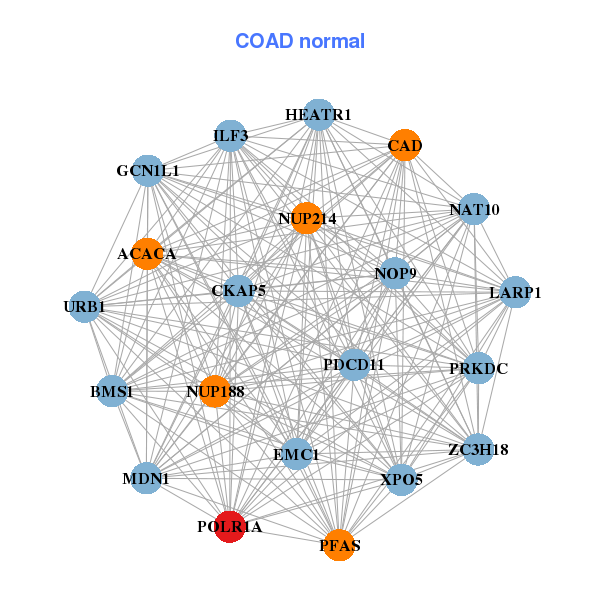
| * Co-Expression network figures were drawn using R package igraph. Only the top 20 genes with the highest correlations were shown. Red circle: input gene, orange circle: cell metabolism gene, sky circle: other gene |
: Open all plots for all cancer types
| Top |
: Open all interacting genes' information including KEGG pathway for all interacting genes from DAVID
| Top |
| Pharmacological Information for POLR1A |
| There's no related Drug. |
| Top |
| Cross referenced IDs for POLR1A |
| * We obtained these cross-references from Uniprot database. It covers 150 different DBs, 18 categories. http://www.uniprot.org/help/cross_references_section |
: Open all cross reference information
|
Copyright © 2016-Present - The Univsersity of Texas Health Science Center at Houston @ |