|
||||||||||||||||||||
| |
| Phenotypic Information (metabolism pathway, cancer, disease, phenome) |
| |
| |
| Gene-Gene Network Information: Co-Expression Network, Interacting Genes & KEGG |
| |
|


| Gene Summary for GPX3 |
| Basic gene info. | Gene symbol | GPX3 |
| Gene name | glutathione peroxidase 3 (plasma) | |
| Synonyms | GPx-P|GSHPx-3|GSHPx-P | |
| Cytomap | UCSC genome browser: 5q23 | |
| Genomic location | chr5 :150399998-150408554 | |
| Type of gene | protein-coding | |
| RefGenes | NM_002084.3, | |
| Ensembl id | ENSG00000211445 | |
| Description | GPx-3extracellular glutathione peroxidaseglutathione peroxidase 3plasma glutathione peroxidase | |
| Modification date | 20141222 | |
| dbXrefs | MIM : 138321 | |
| HGNC : HGNC | ||
| Ensembl : ENSG00000211445 | ||
| HPRD : 11750 | ||
| Vega : OTTHUMG00000163693 | ||
| Protein | UniProt: P22352 go to UniProt's Cross Reference DB Table | |
| Expression | CleanEX: HS_GPX3 | |
| BioGPS: 2878 | ||
| Gene Expression Atlas: ENSG00000211445 | ||
| The Human Protein Atlas: ENSG00000211445 | ||
| Pathway | NCI Pathway Interaction Database: GPX3 | |
| KEGG: GPX3 | ||
| REACTOME: GPX3 | ||
| ConsensusPathDB | ||
| Pathway Commons: GPX3 | ||
| Metabolism | MetaCyc: GPX3 | |
| HUMANCyc: GPX3 | ||
| Regulation | Ensembl's Regulation: ENSG00000211445 | |
| miRBase: chr5 :150,399,998-150,408,554 | ||
| TargetScan: NM_002084 | ||
| cisRED: ENSG00000211445 | ||
| Context | iHOP: GPX3 | |
| cancer metabolism search in PubMed: GPX3 | ||
| UCL Cancer Institute: GPX3 | ||
| Assigned class in ccmGDB | A - This gene has a literature evidence and it belongs to cancer gene. | |
| References showing role of GPX3 in cancer cell metabolism | 1. Lin HY, Kuo YC, Weng YI, Lai IL, Huang TH, et al. (2012) Activation of silenced tumor suppressor genes in prostate cancer cells by a novel energy restriction-mimetic agent. Prostate 72: 1767-1778. doi: 10.1002/pros.22530. pmid: 3867924. go to article 2. Morvan D, Demidem A (2014) Metabolomics and transcriptomics demonstrate severe oxidative stress in both localized chemotherapy-treated and bystander tumors. Biochim Biophys Acta 1840: 1092-1104. doi: 10.1016/j.bbagen.2013.11.022. go to article | |
| Top |
| Phenotypic Information for GPX3(metabolism pathway, cancer, disease, phenome) |
| Cancer | CGAP: GPX3 |
| Familial Cancer Database: GPX3 | |
| * This gene is included in those cancer gene databases. |
|
|
|
|
|
| . | ||||||||||||||
Oncogene 1 | Significant driver gene in | |||||||||||||||||||
| cf) number; DB name 1 Oncogene; http://nar.oxfordjournals.org/content/35/suppl_1/D721.long, 2 Tumor Suppressor gene; https://bioinfo.uth.edu/TSGene/, 3 Cancer Gene Census; http://www.nature.com/nrc/journal/v4/n3/abs/nrc1299.html, 4 CancerGenes; http://nar.oxfordjournals.org/content/35/suppl_1/D721.long, 5 Network of Cancer Gene; http://ncg.kcl.ac.uk/index.php, 1Therapeutic Vulnerabilities in Cancer; http://cbio.mskcc.org/cancergenomics/statius/ |
| KEGG_GLUTATHIONE_METABOLISM KEGG_ARACHIDONIC_ACID_METABOLISM | |
| OMIM | 138321; gene. |
| Orphanet | |
| Disease | KEGG Disease: GPX3 |
| MedGen: GPX3 (Human Medical Genetics with Condition) | |
| ClinVar: GPX3 | |
| Phenotype | MGI: GPX3 (International Mouse Phenotyping Consortium) |
| PhenomicDB: GPX3 | |
| Mutations for GPX3 |
| * Under tables are showing count per each tissue to give us broad intuition about tissue specific mutation patterns.You can go to the detailed page for each mutation database's web site. |
| There's no structural variation information in COSMIC data for this gene. |
| * From mRNA Sanger sequences, Chitars2.0 arranged chimeric transcripts. This table shows GPX3 related fusion information. |
| ID | Head Gene | Tail Gene | Accession | Gene_a | qStart_a | qEnd_a | Chromosome_a | tStart_a | tEnd_a | Gene_a | qStart_a | qEnd_a | Chromosome_a | tStart_a | tEnd_a |
| CV421185 | GPX3 | 19 | 86 | 5 | 150408223 | 150408290 | NSMCE1 | 86 | 174 | 16 | 27238452 | 27238540 | |
| AA740310 | GPX3 | 1 | 227 | 5 | 150408293 | 150408522 | RPN2 | 219 | 437 | 20 | 35812585 | 35826827 | |
| BG430541 | GPX3 | 1 | 216 | 5 | 150407618 | 150407832 | GPX3 | 212 | 482 | 5 | 150406467 | 150407527 | |
| BF848871 | AARS | 26 | 183 | 16 | 70287657 | 70287931 | GPX3 | 178 | 404 | 5 | 150407985 | 150408211 | |
| BG896291 | GPX3 | 88 | 231 | 5 | 150407947 | 150408090 | GPX3 | 229 | 386 | 5 | 150408072 | 150408229 | |
| BG927502 | GPX3 | 85 | 300 | 5 | 150407777 | 150407992 | GPX3 | 296 | 571 | 5 | 150407030 | 150407682 | |
| BF878552 | GPX3 | 1 | 248 | 5 | 150404982 | 150407052 | GPX3 | 239 | 321 | 5 | 150404898 | 150404980 | |
| BF954117 | AARS | 26 | 183 | 16 | 70287657 | 70287931 | GPX3 | 178 | 404 | 5 | 150407985 | 150408211 | |
| AW794509 | GPX3 | 1 | 253 | 5 | 150407731 | 150407982 | S100A8 | 243 | 416 | 1 | 153362669 | 153362993 | |
| CB044109 | INPP4B | 189 | 243 | 4 | 142963302 | 142963356 | GPX3 | 242 | 672 | 5 | 150406475 | 150407696 | |
| BG990596 | AFAP1L2 | 1 | 180 | 10 | 116056714 | 116057013 | GPX3 | 174 | 281 | 5 | 150406494 | 150407015 | |
| W25873 | GPX3 | 19 | 119 | 5 | 150407479 | 150407578 | GPX3 | 114 | 463 | 5 | 150407726 | 150408075 | |
| Top |
| There's no copy number variation information in COSMIC data for this gene. |
| Top |
|
 |
| Top |
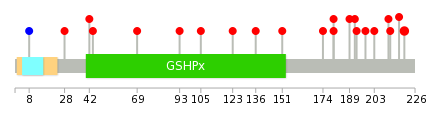
| Stat. for Non-Synonymous SNVs (# total SNVs=14) | (# total SNVs=1) |
 |  |
(# total SNVs=0) | (# total SNVs=0) |
| Top |
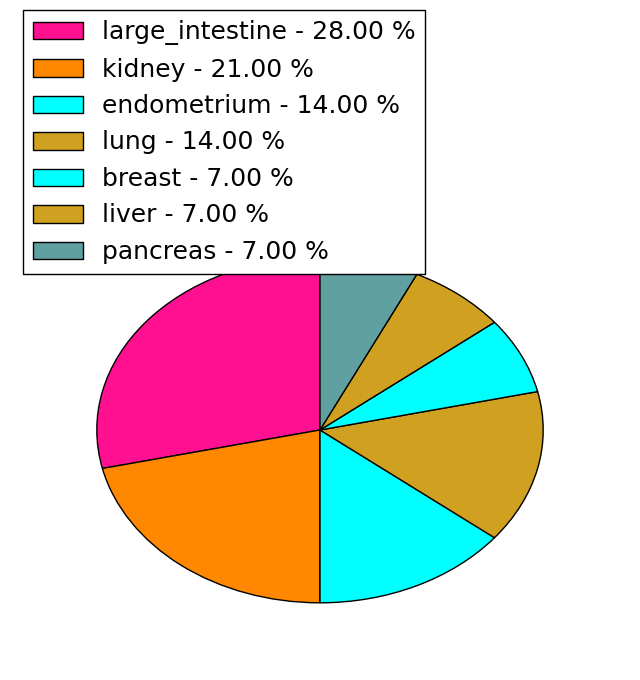
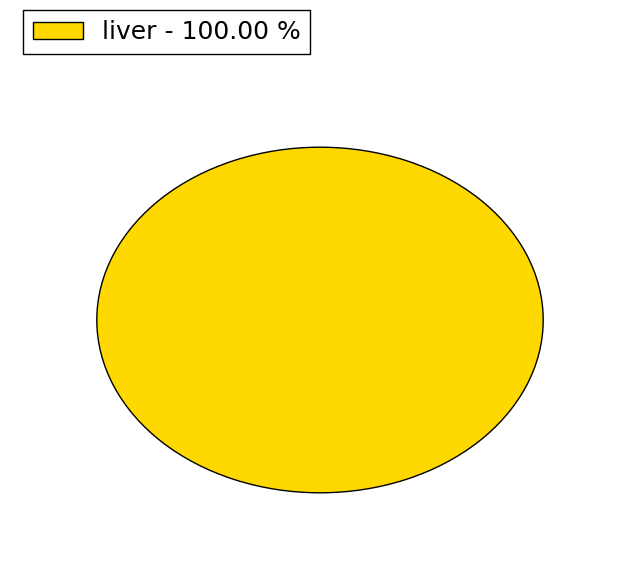
| * When you move the cursor on each content, you can see more deailed mutation information on the Tooltip. Those are primary_site,primary_histology,mutation(aa),pubmedID. |
| GRCh37 position | Mutation(aa) | Unique sampleID count |
| chr5:150407000-150407000 | p.R123G | 2 |
| chr5:150407669-150407669 | p.A220V | 2 |
| chr5:150407585-150407585 | p.G192D | 1 |
| chr5:150405018-150405018 | p.V69M | 1 |
| chr5:150407589-150407589 | p.I193M | 1 |
| chr5:150406496-150406496 | p.G93S | 1 |
| chr5:150407602-150407602 | p.W198G | 1 |
| chr5:150406533-150406533 | p.G105E | 1 |
| chr5:150407618-150407618 | p.T203M | 1 |
| chr5:150407641-150407641 | p.I211V | 1 |
| Top |
|
 |
| Point Mutation/ Tissue ID | 1 | 2 | 3 | 4 | 5 | 6 | 7 | 8 | 9 | 10 | 11 | 12 | 13 | 14 | 15 | 16 | 17 | 18 | 19 | 20 |
| # sample | ||||||||||||||||||||
| # mutation | ||||||||||||||||||||
| nonsynonymous SNV | ||||||||||||||||||||
| synonymous SNV |
| cf) Tissue ID; Tissue type (1; BLCA[Bladder Urothelial Carcinoma], 2; BRCA[Breast invasive carcinoma], 3; CESC[Cervical squamous cell carcinoma and endocervical adenocarcinoma], 4; COAD[Colon adenocarcinoma], 5; GBM[Glioblastoma multiforme], 6; Glioma Low Grade, 7; HNSC[Head and Neck squamous cell carcinoma], 8; KICH[Kidney Chromophobe], 9; KIRC[Kidney renal clear cell carcinoma], 10; KIRP[Kidney renal papillary cell carcinoma], 11; LAML[Acute Myeloid Leukemia], 12; LUAD[Lung adenocarcinoma], 13; LUSC[Lung squamous cell carcinoma], 14; OV[Ovarian serous cystadenocarcinoma ], 15; PAAD[Pancreatic adenocarcinoma], 16; PRAD[Prostate adenocarcinoma], 17; SKCM[Skin Cutaneous Melanoma], 18:STAD[Stomach adenocarcinoma], 19:THCA[Thyroid carcinoma], 20:UCEC[Uterine Corpus Endometrial Carcinoma]) |
| Top |
| * We represented just top 10 SNVs. When you move the cursor on each content, you can see more deailed mutation information on the Tooltip. Those are primary_site, primary_histology, mutation(aa), pubmedID. |
| Genomic Position | Mutation(aa) | Unique sampleID count |
| * Copy number data were extracted from TCGA using R package TCGA-Assembler. The URLs of all public data files on TCGA DCC data server were gathered on Jan-05-2015. Function ProcessCNAData in TCGA-Assembler package was used to obtain gene-level copy number value which is calculated as the average copy number of the genomic region of a gene. |
 |
| cf) Tissue ID[Tissue type]: BLCA[Bladder Urothelial Carcinoma], BRCA[Breast invasive carcinoma], CESC[Cervical squamous cell carcinoma and endocervical adenocarcinoma], COAD[Colon adenocarcinoma], GBM[Glioblastoma multiforme], Glioma Low Grade, HNSC[Head and Neck squamous cell carcinoma], KICH[Kidney Chromophobe], KIRC[Kidney renal clear cell carcinoma], KIRP[Kidney renal papillary cell carcinoma], LAML[Acute Myeloid Leukemia], LUAD[Lung adenocarcinoma], LUSC[Lung squamous cell carcinoma], OV[Ovarian serous cystadenocarcinoma ], PAAD[Pancreatic adenocarcinoma], PRAD[Prostate adenocarcinoma], SKCM[Skin Cutaneous Melanoma], STAD[Stomach adenocarcinoma], THCA[Thyroid carcinoma], UCEC[Uterine Corpus Endometrial Carcinoma] |
| Top |
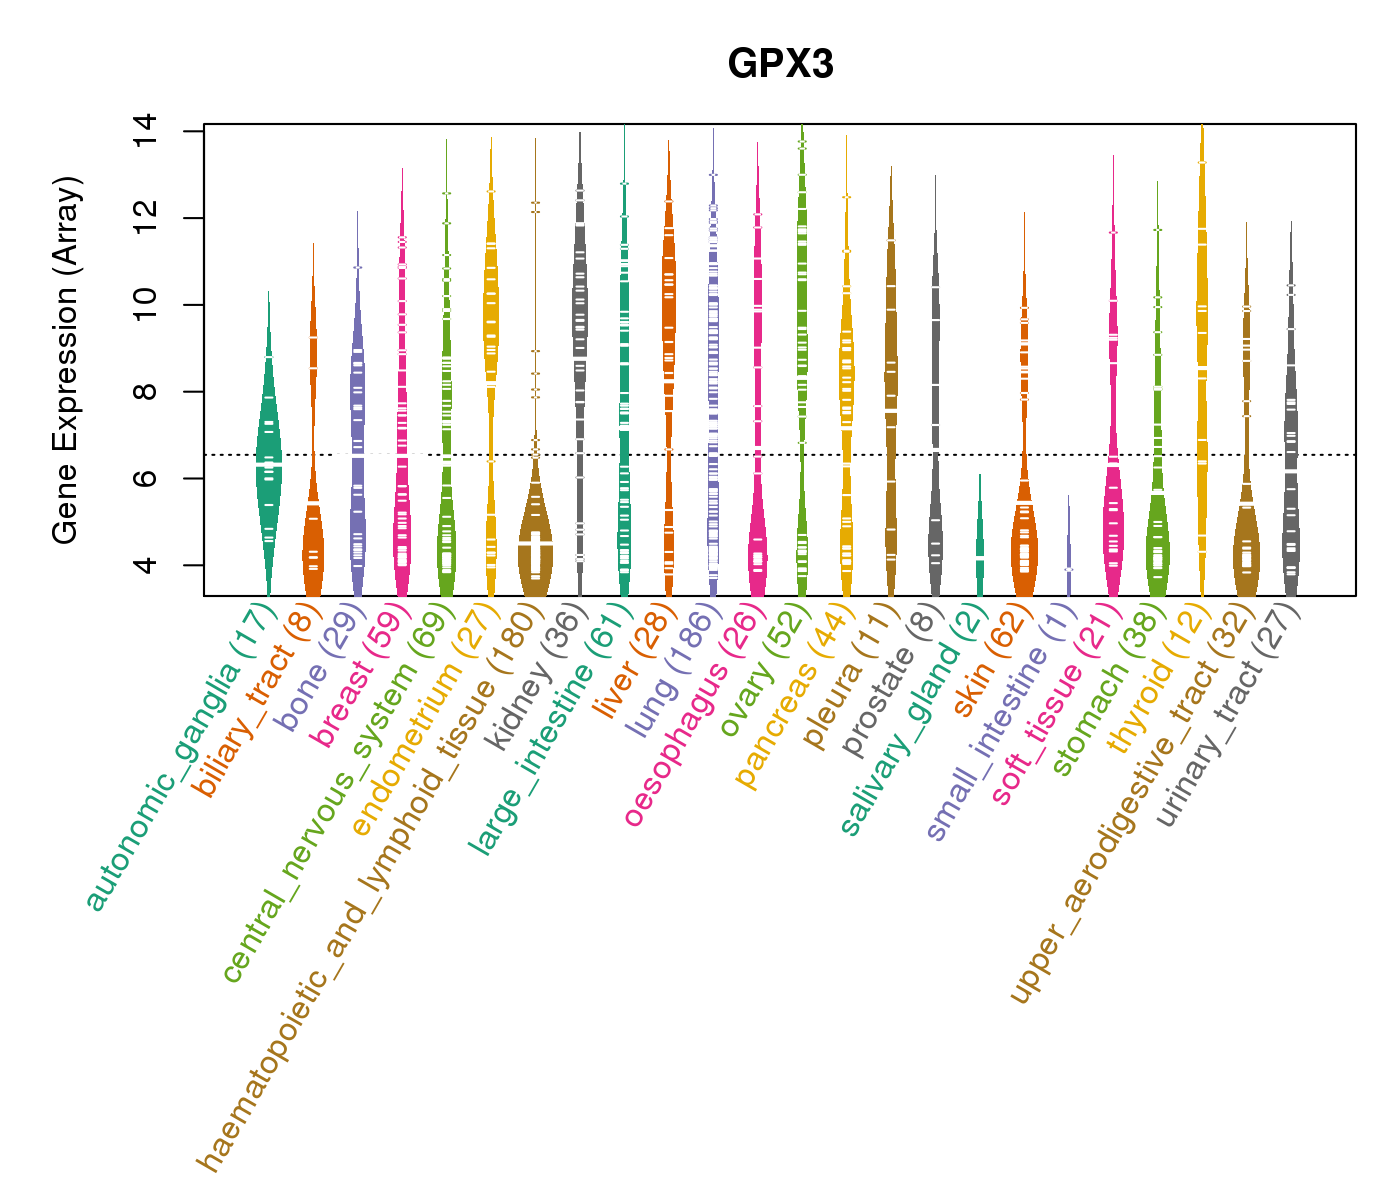
| Gene Expression for GPX3 |
| * CCLE gene expression data were extracted from CCLE_Expression_Entrez_2012-10-18.res: Gene-centric RMA-normalized mRNA expression data. |
 |
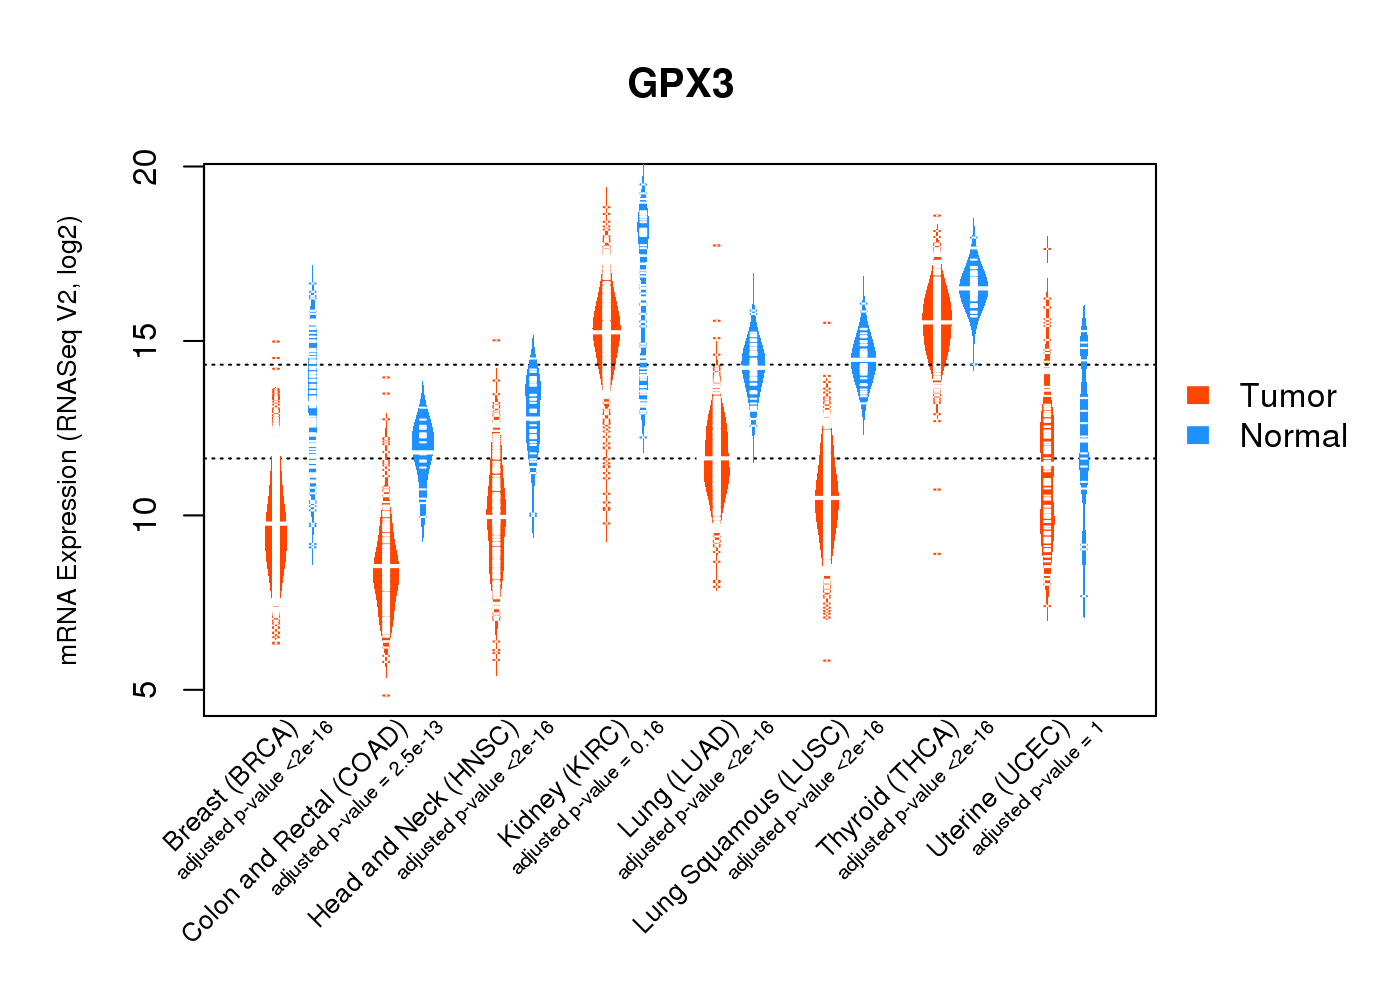
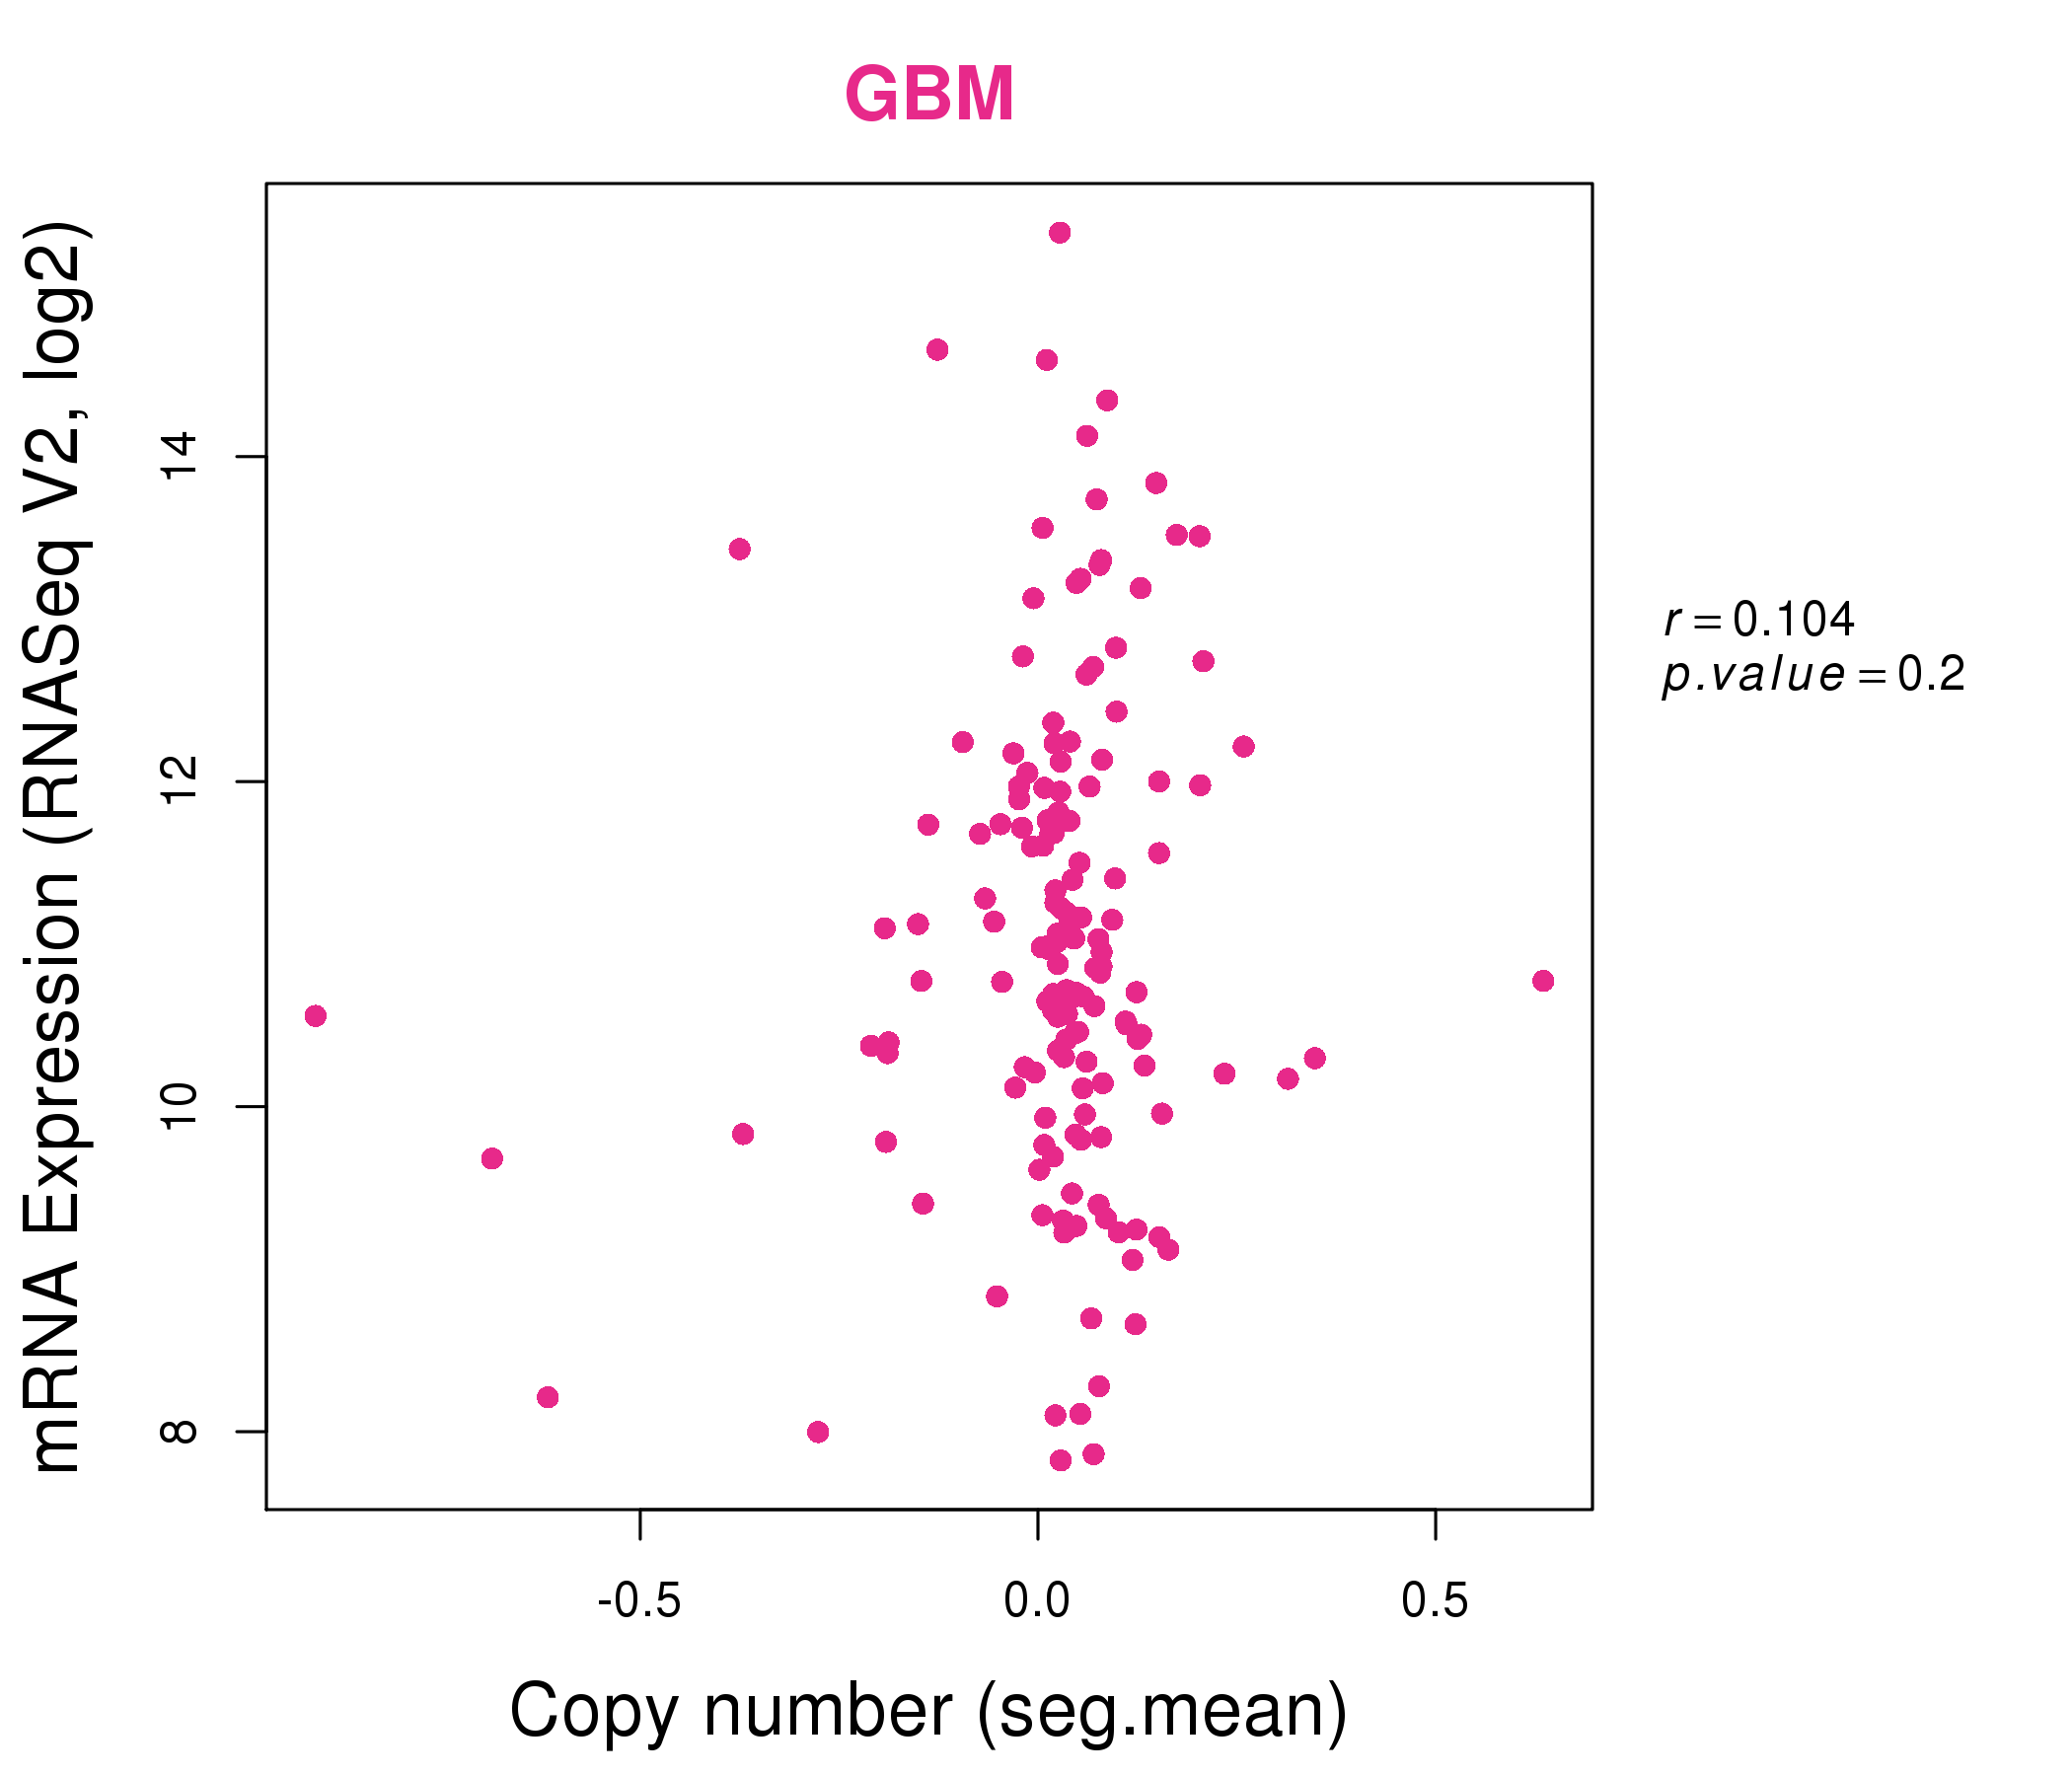
| * Normalized gene expression data of RNASeqV2 was extracted from TCGA using R package TCGA-Assembler. The URLs of all public data files on TCGA DCC data server were gathered at Jan-05-2015. Only eight cancer types have enough normal control samples for differential expression analysis. (t test, adjusted p<0.05 (using Benjamini-Hochberg FDR)) |
 |
| Top |
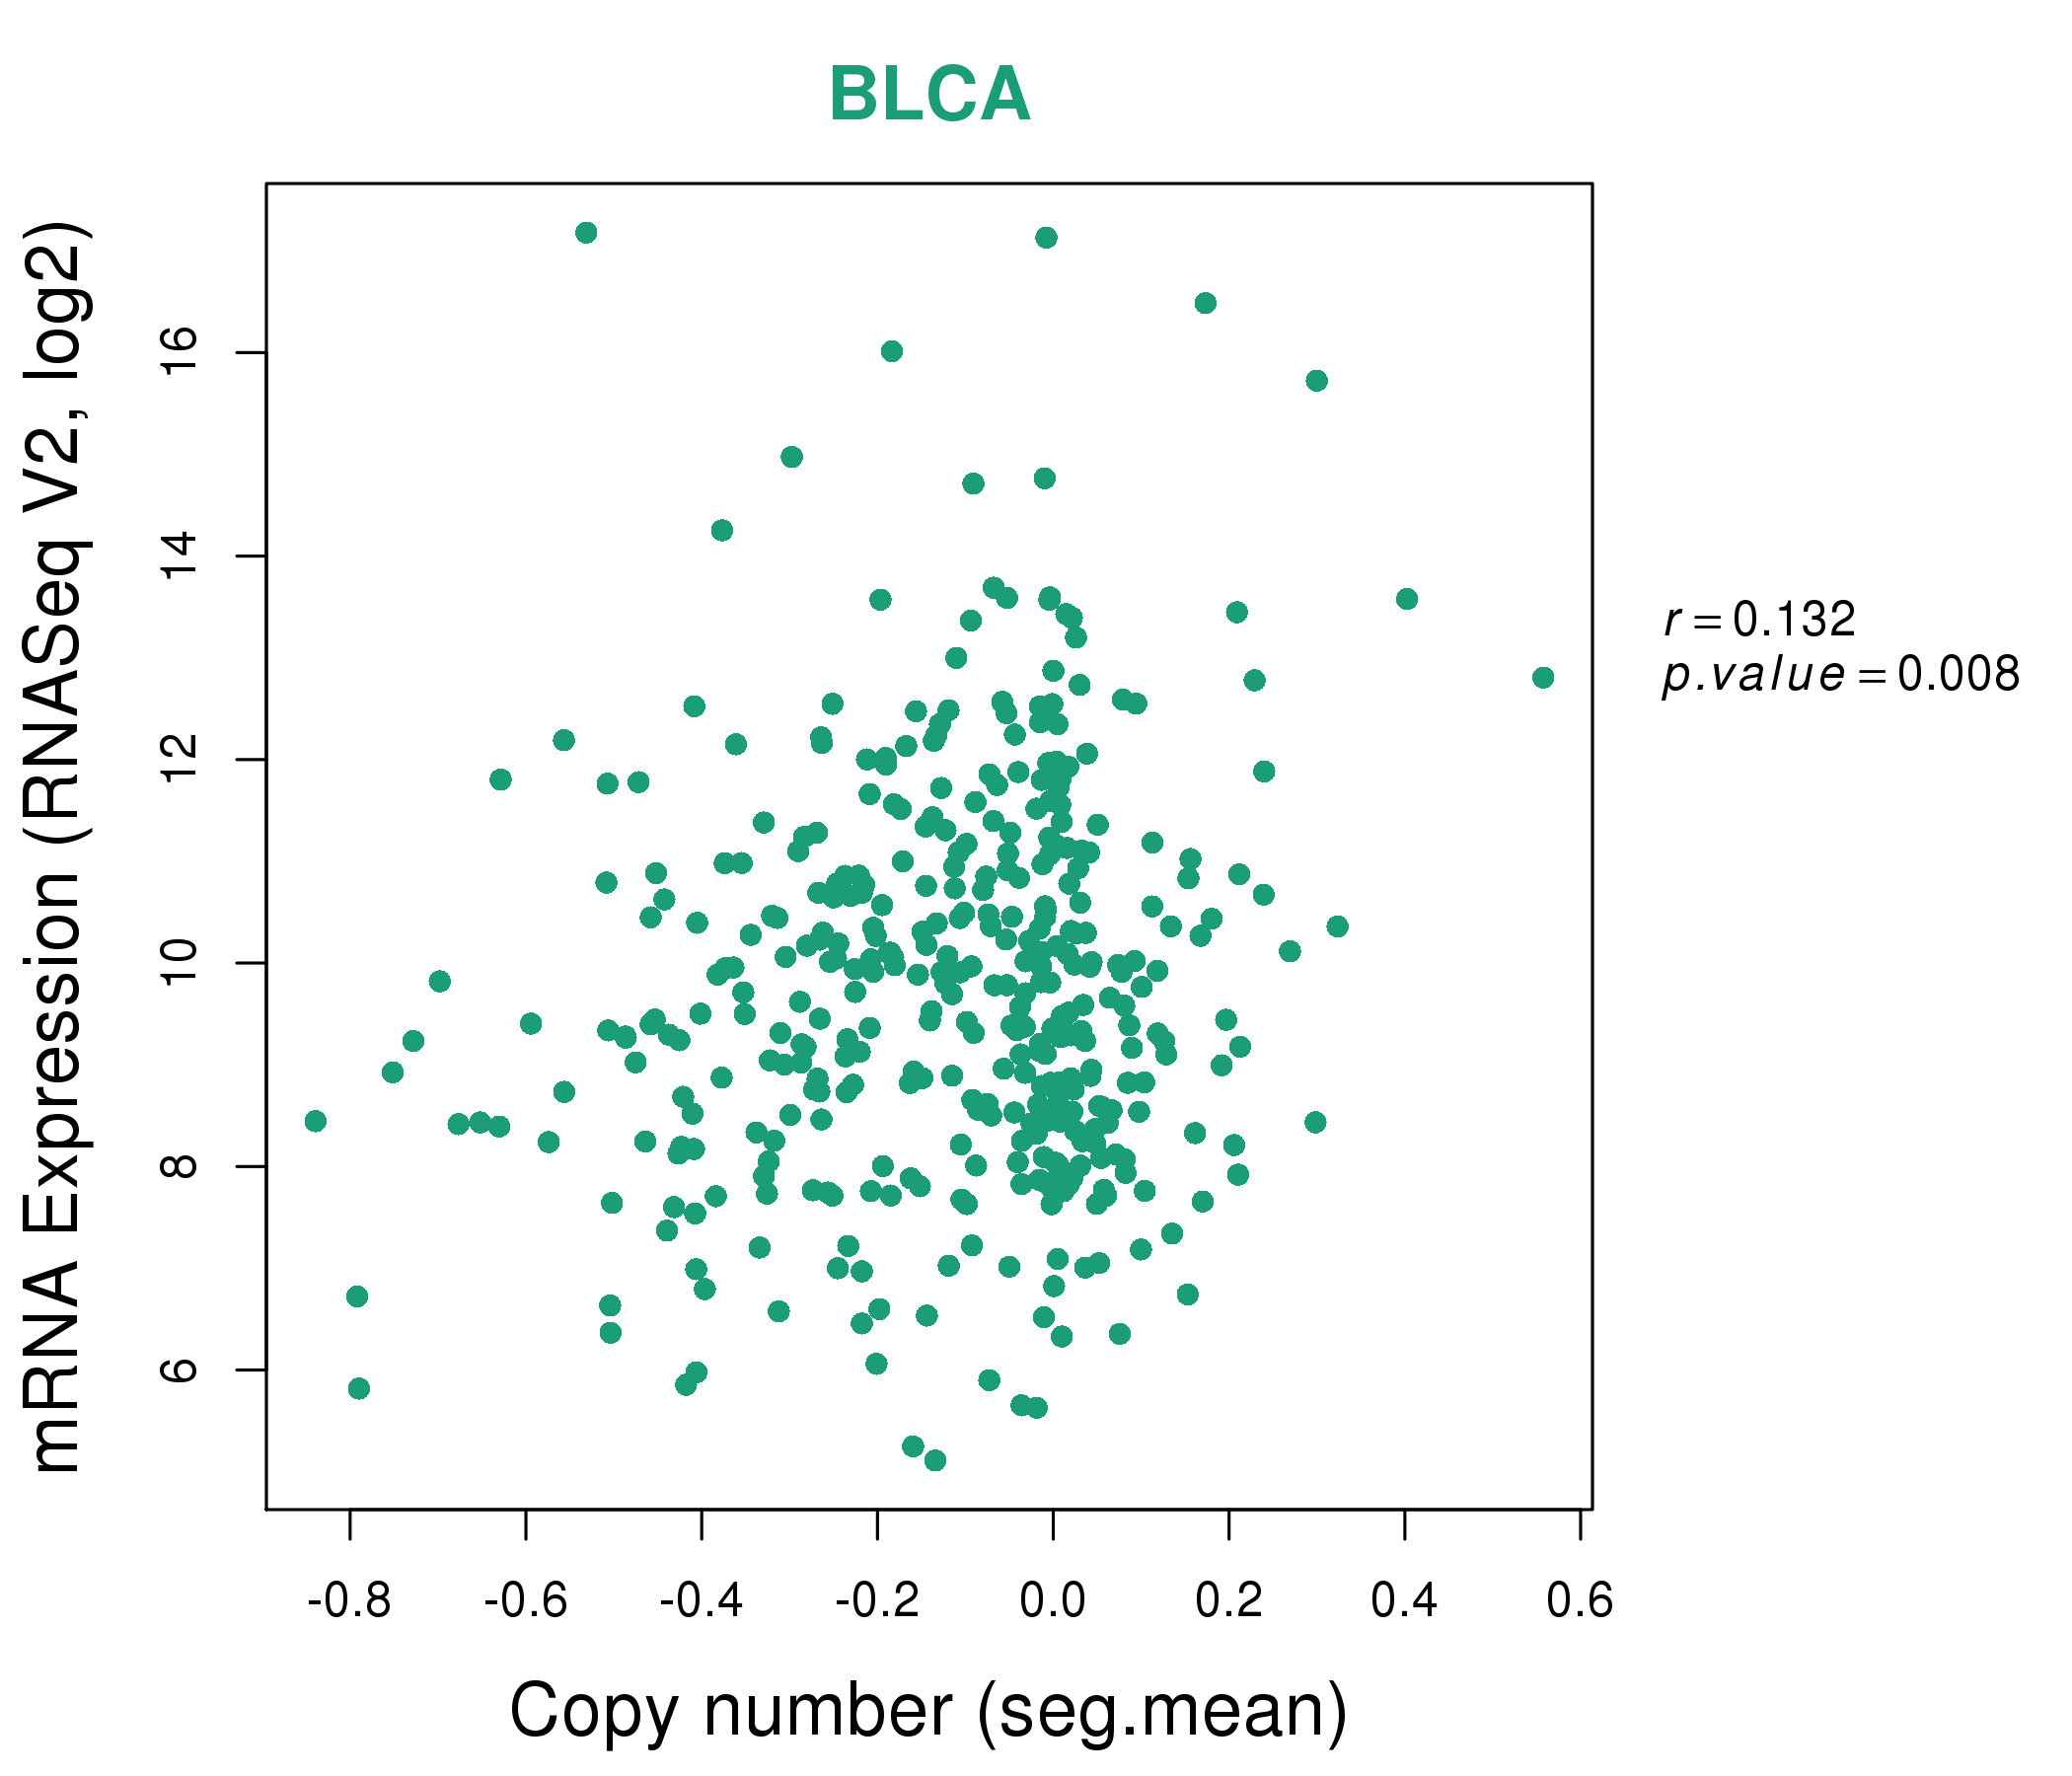
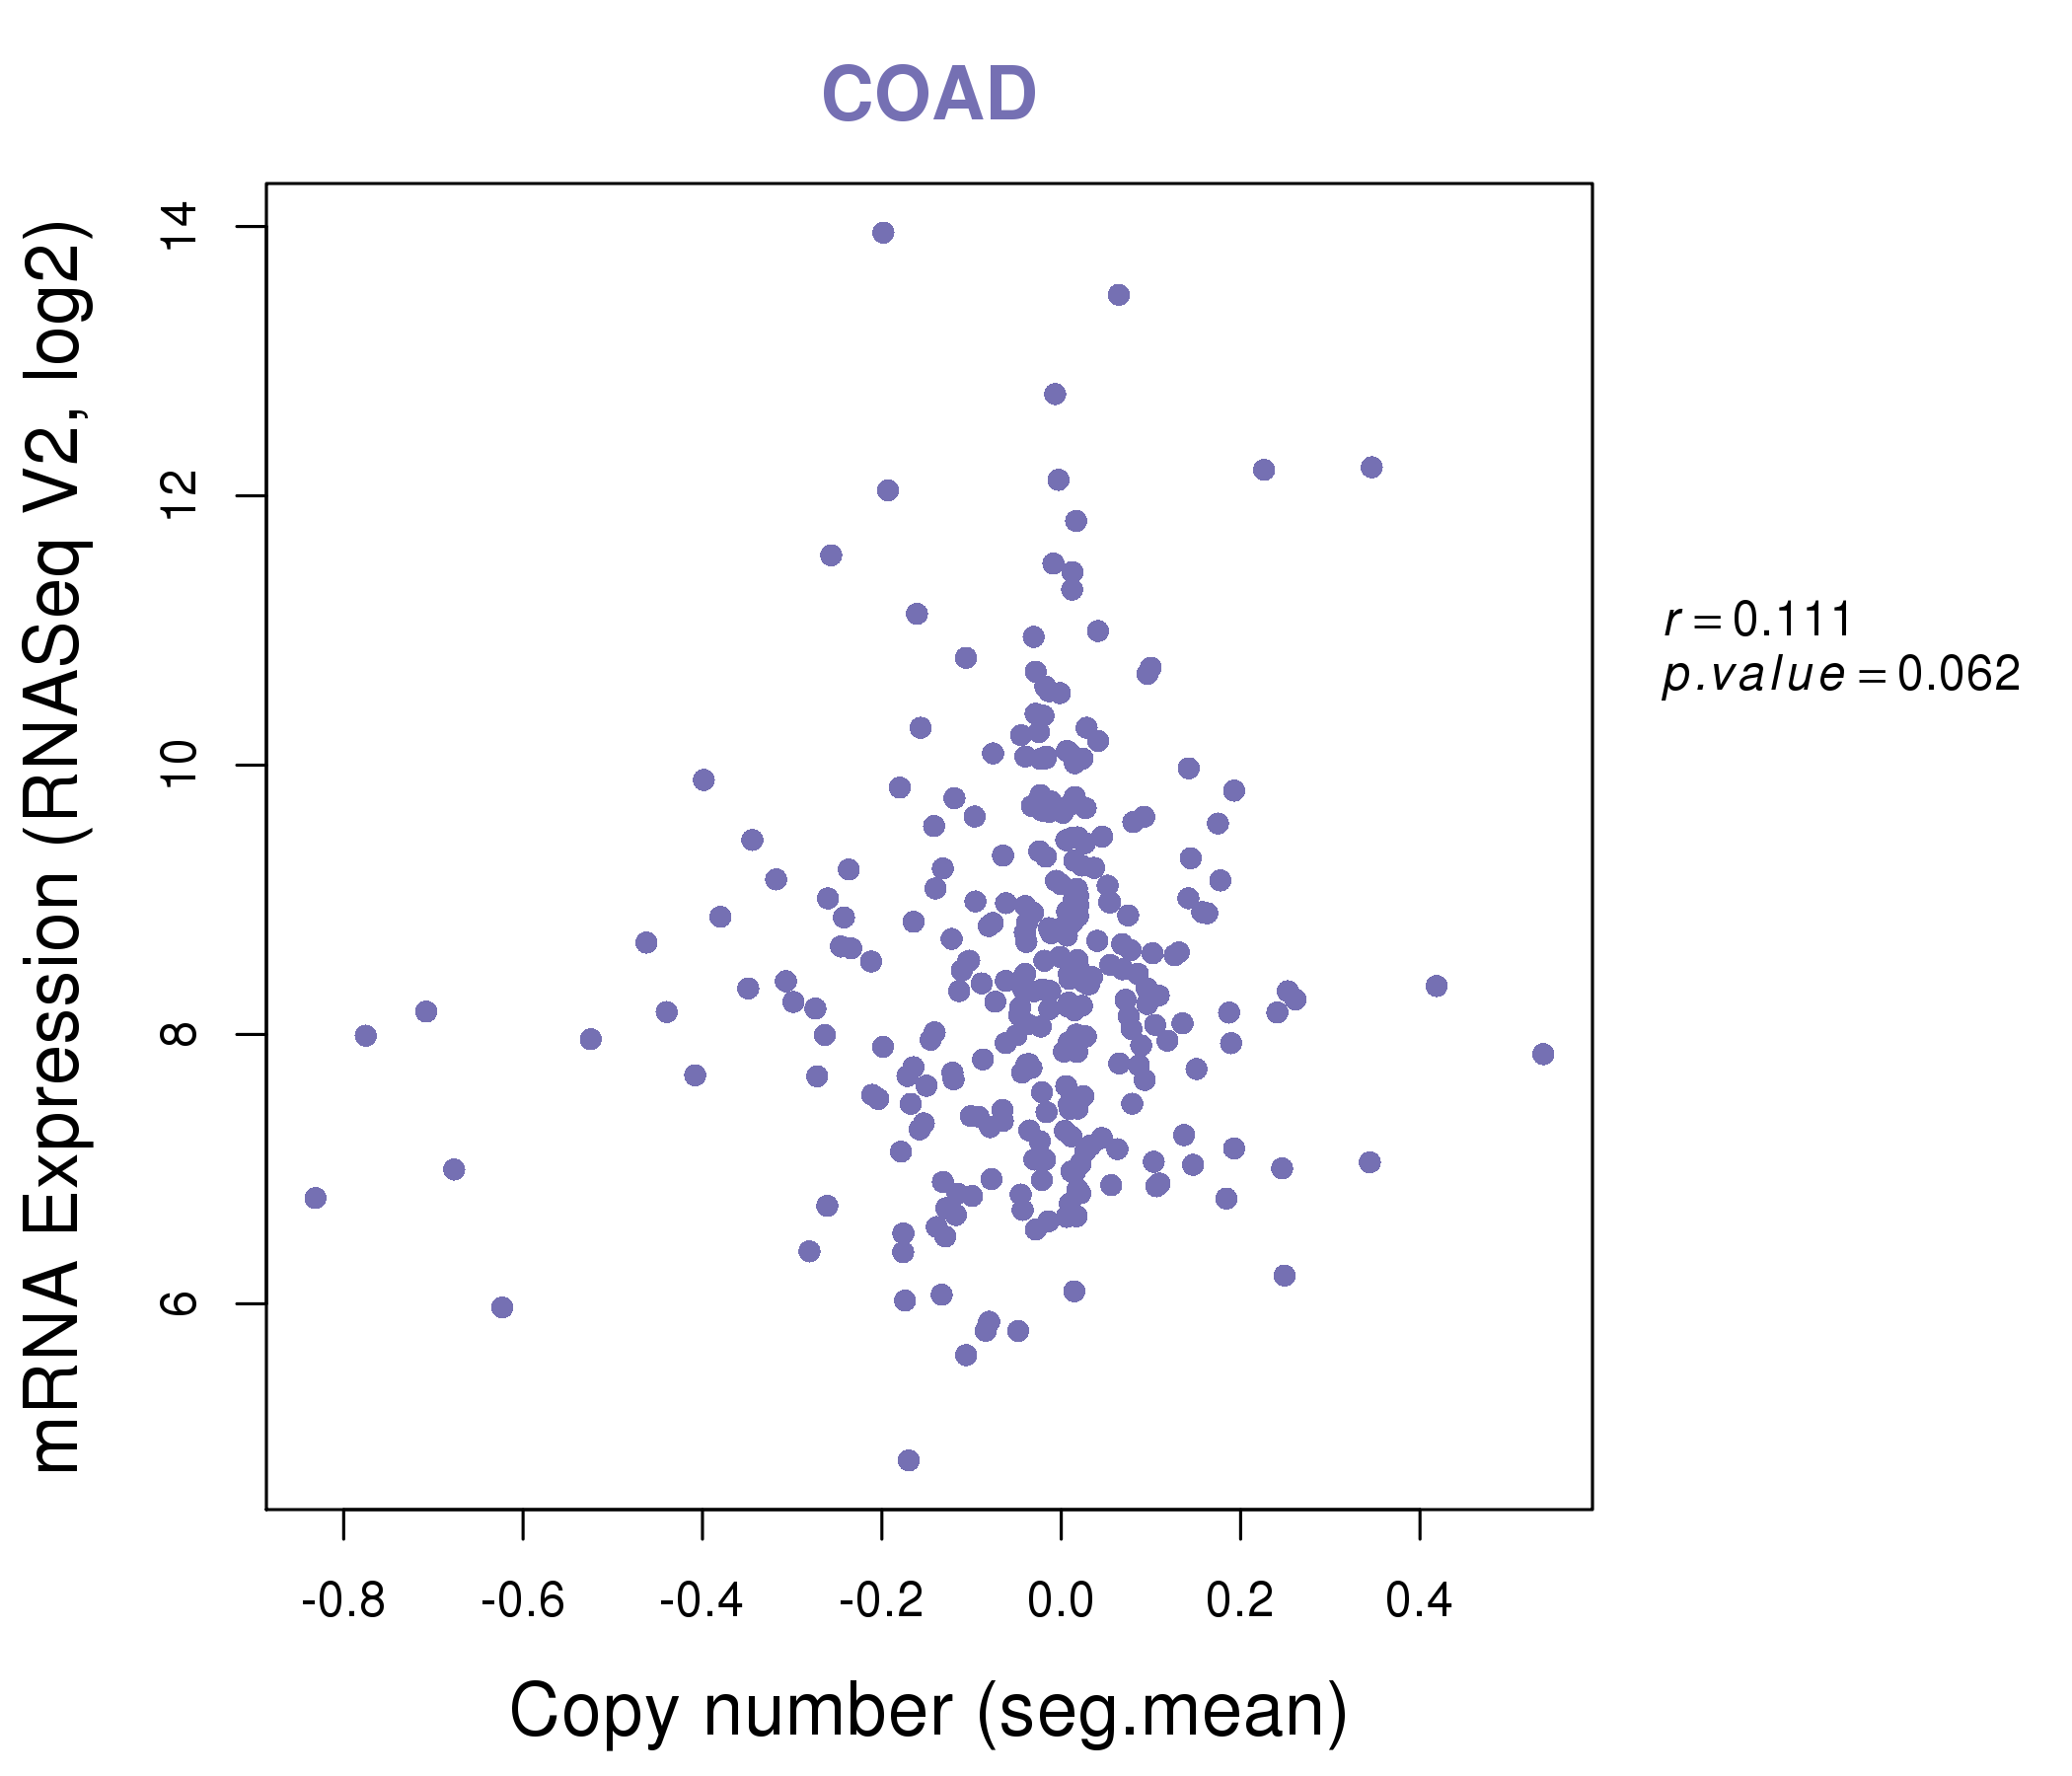
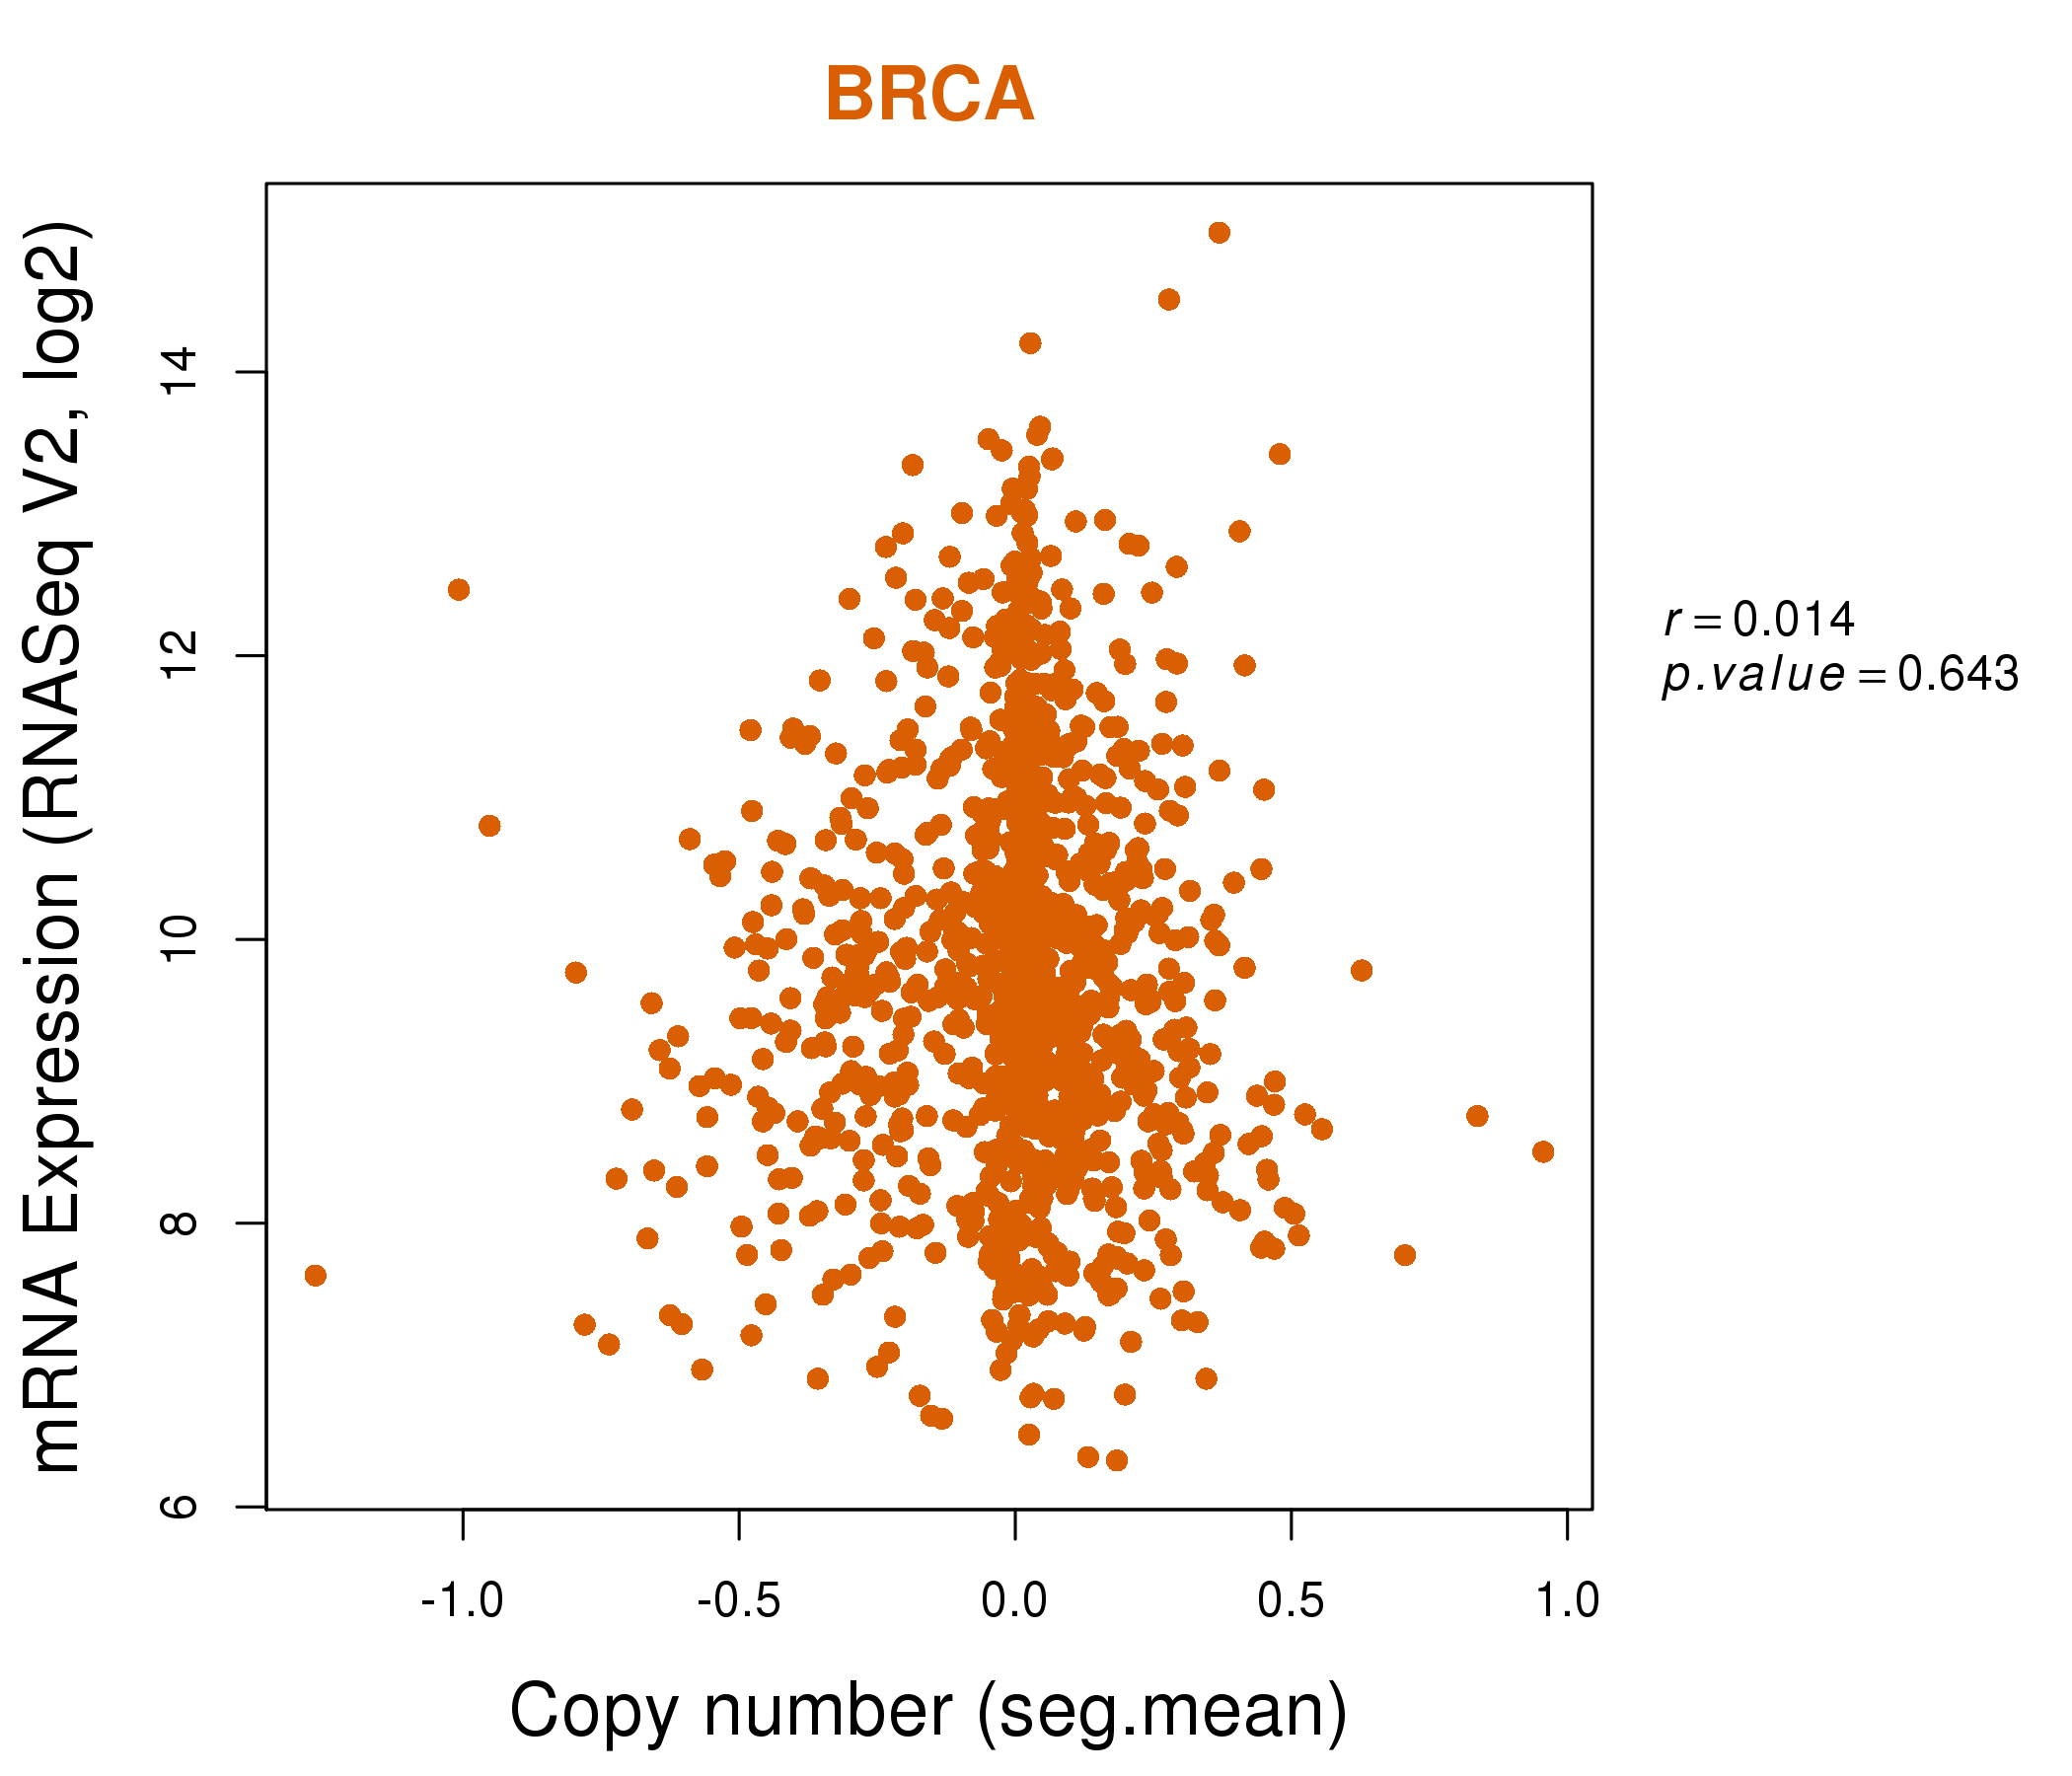
| * This plots show the correlation between CNV and gene expression. |
: Open all plots for all cancer types
 |
|
 |
|
| Top |
| Gene-Gene Network Information |
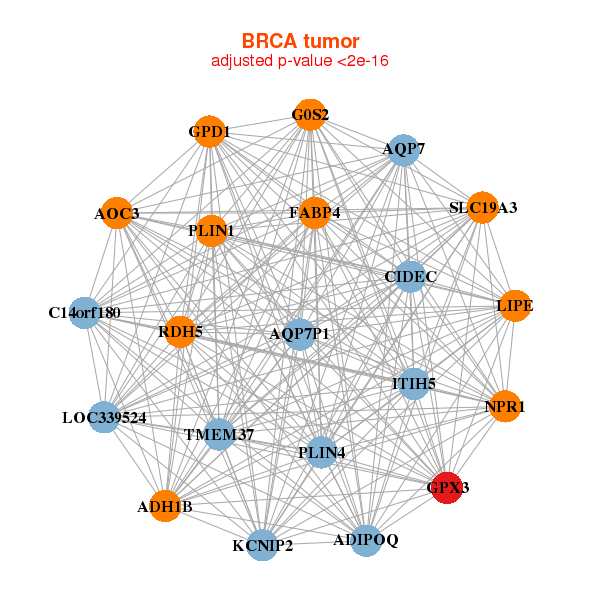
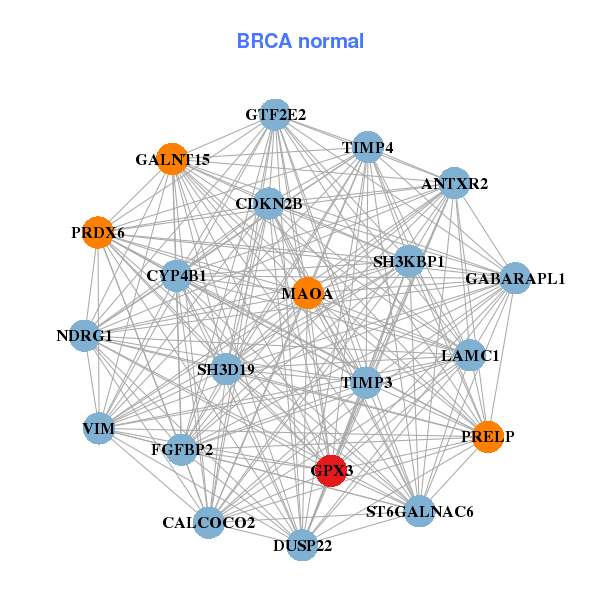
| * Co-Expression network figures were drawn using R package igraph. Only the top 20 genes with the highest correlations were shown. Red circle: input gene, orange circle: cell metabolism gene, sky circle: other gene |
: Open all plots for all cancer types
 |
| ||||
| ADH1B,ADIPOQ,AOC3,AQP7,AQP7P1,C14orf180,CIDEC, FABP4,G0S2,GPD1,GPX3,ITIH5,KCNIP2,LIPE, LOC339524,NPR1,PLIN1,PLIN4,RDH5,SLC19A3,TMEM37 | ANTXR2,CALCOCO2,CDKN2B,CYP4B1,DUSP22,FGFBP2,GABARAPL1, GALNT15,GPX3,GTF2E2,LAMC1,MAOA,NDRG1,PRDX6, PRELP,SH3D19,SH3KBP1,ST6GALNAC6,TIMP3,TIMP4,VIM | ||||
 |
| ||||
| ABCA9,ACSM5,ADH1B,ADIPOQ,CD300LG,CD36,CIDEA, FABP4,GLYAT,GPX3,HEPACAM,KCNIP2,LEP,LGALS12, LOC339524,PLAC9,PLIN1,PLIN4,SCN4A,SEMA3G,TUSC5 | ADAMTS2,AOX1,ARHGAP29,C1R,C1S,CACNB4,CLDN11, CRLF1,CSRP2,EFEMP1,FAM198A,TMEM255A,GALNT15,GPX3, IL1R1,SERPINF1,SPON2,STEAP4,TPST1,WISP2,WTIP |
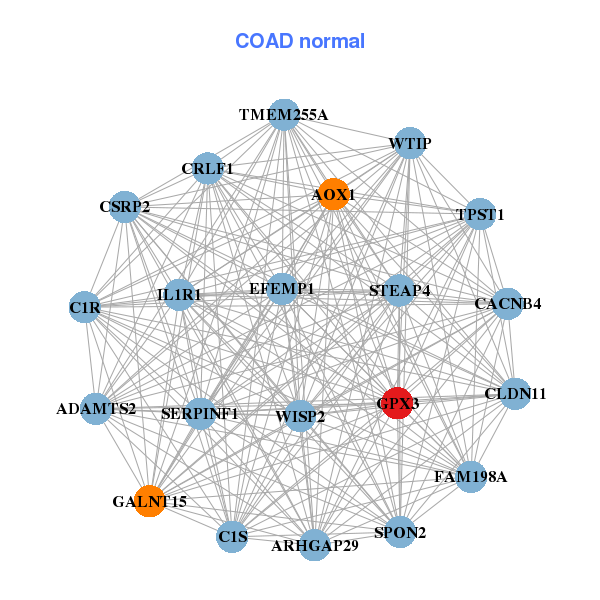
| * Co-Expression network figures were drawn using R package igraph. Only the top 20 genes with the highest correlations were shown. Red circle: input gene, orange circle: cell metabolism gene, sky circle: other gene |
: Open all plots for all cancer types
| Top |
: Open all interacting genes' information including KEGG pathway for all interacting genes from DAVID
| Top |
| Pharmacological Information for GPX3 |
| DB Category | DB Name | DB's ID and Url link |
| Organism-specific databases | PharmGKB | PA28951; -. |
| Organism-specific databases | CTD | 2878; -. |
| * Gene Centered Interaction Network. |
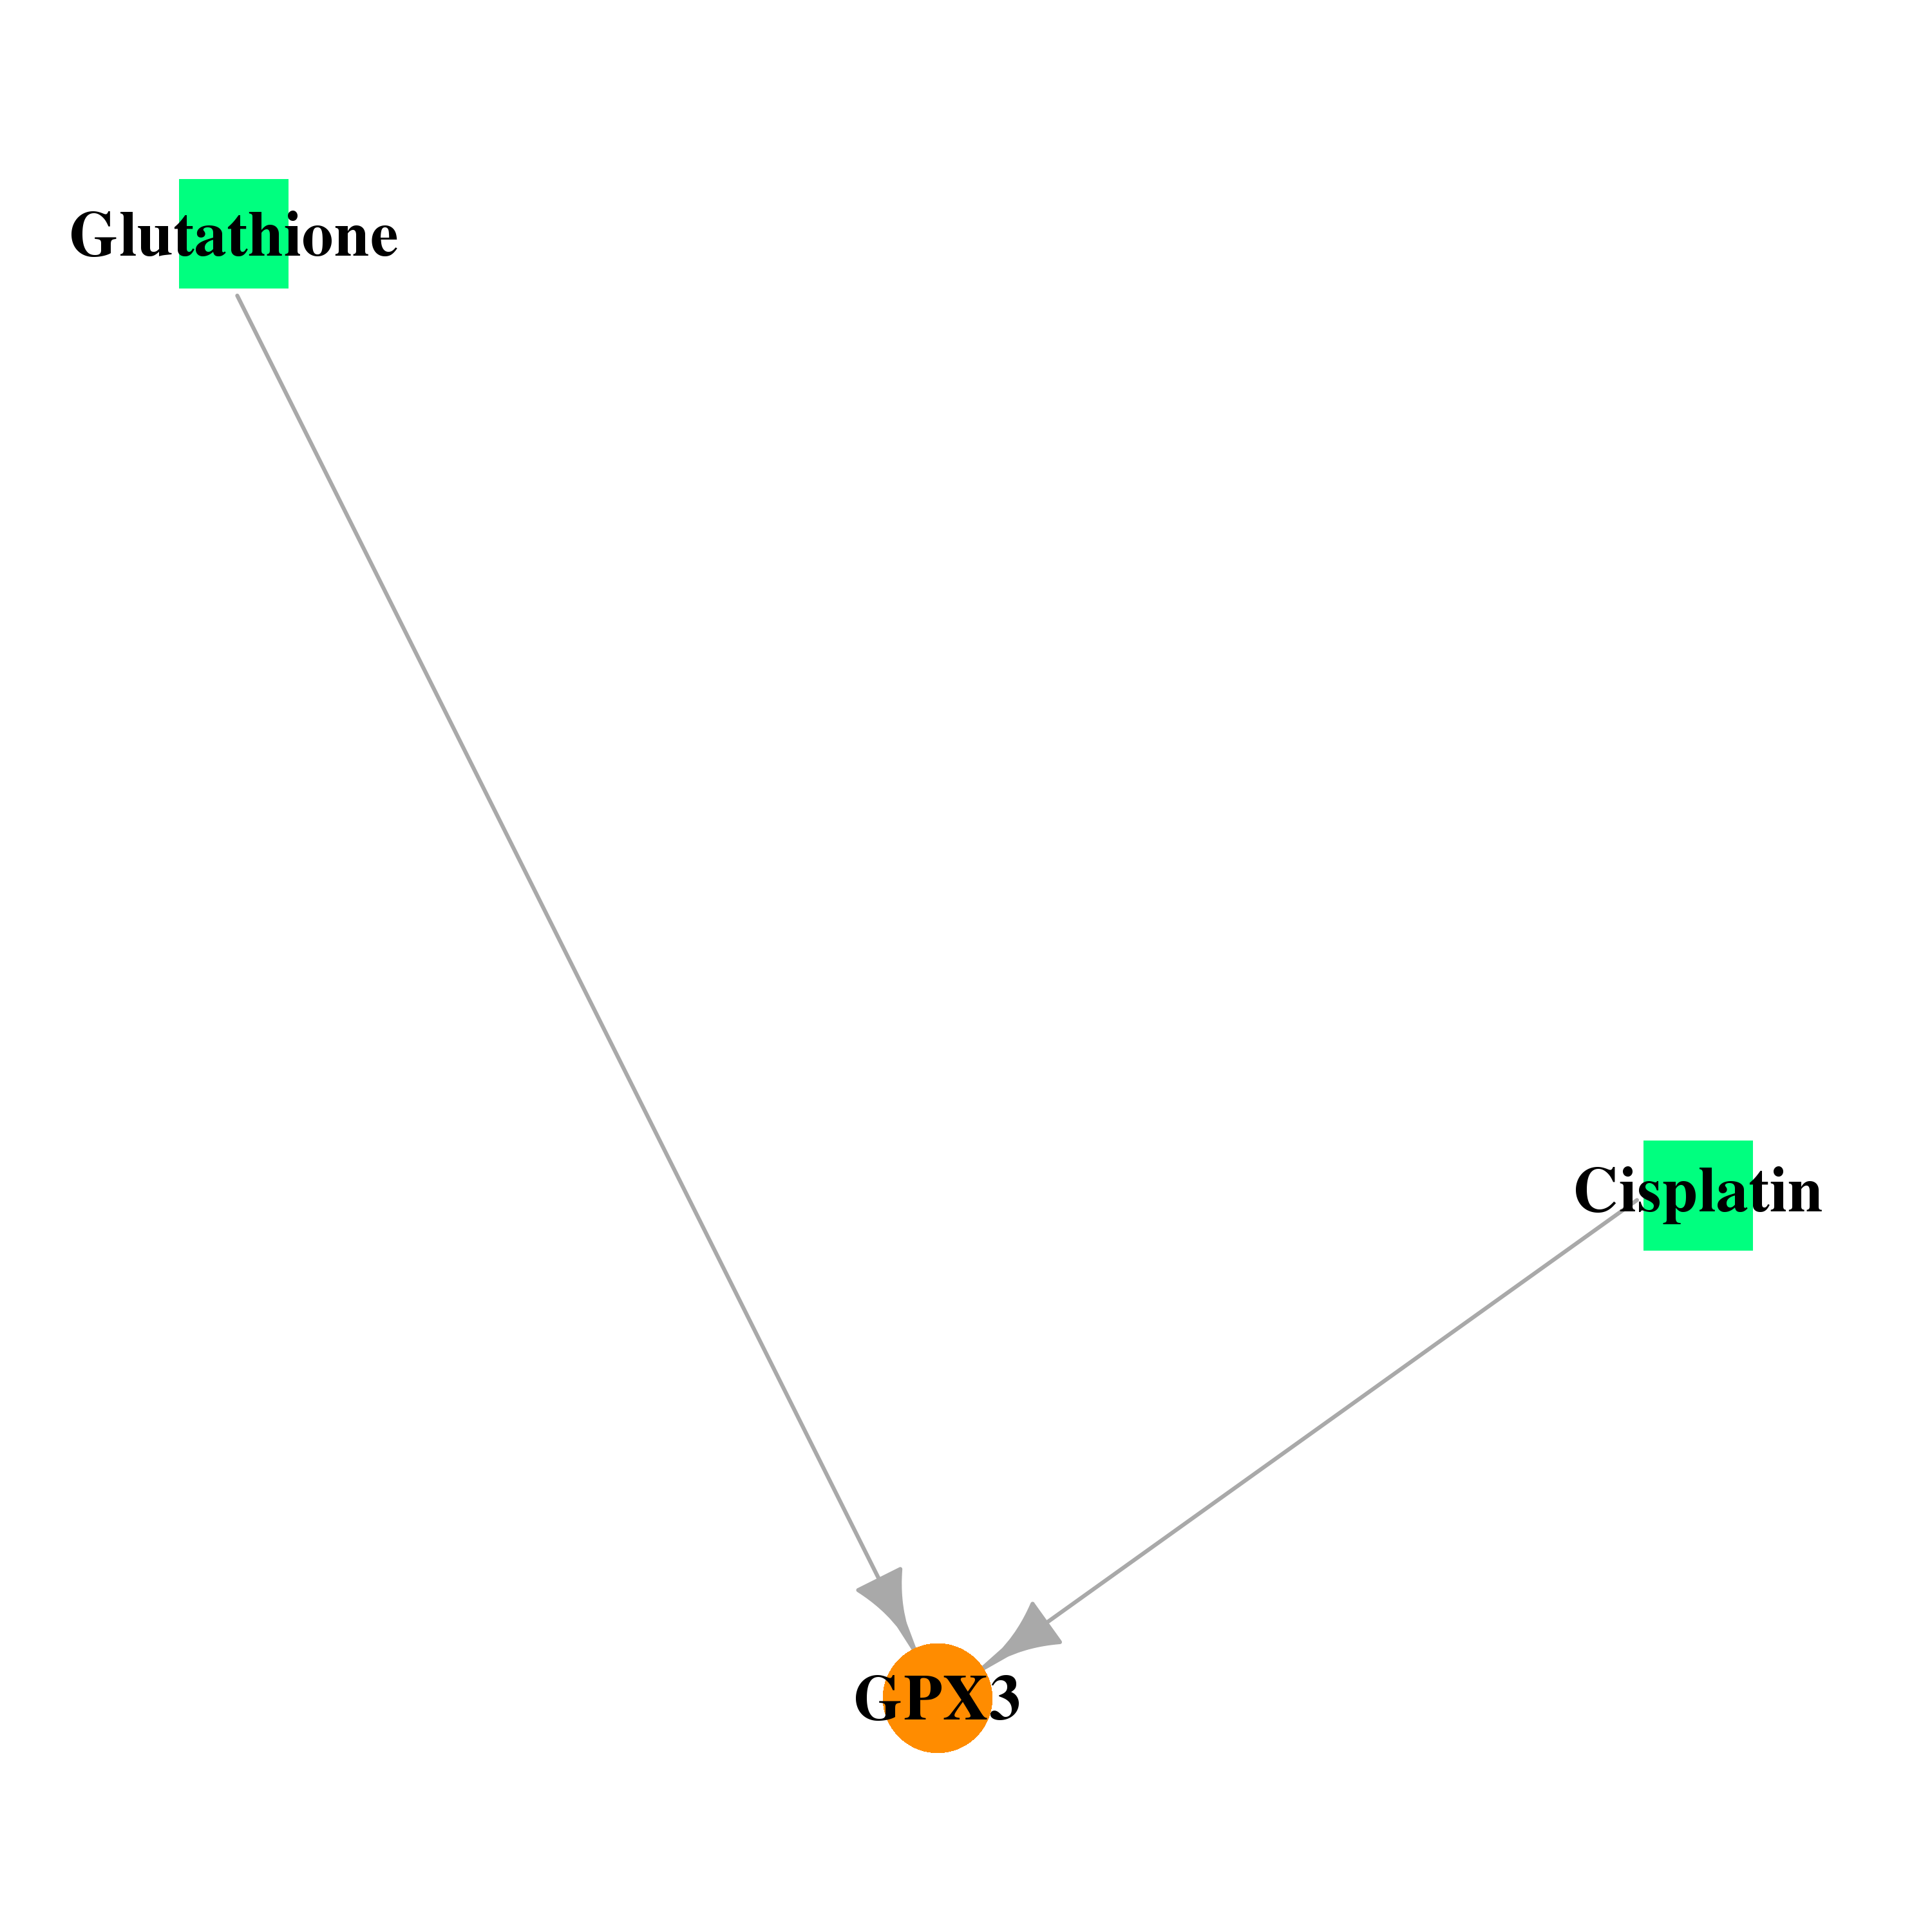 |
| * Drug Centered Interaction Network. |
| DrugBank ID | Target Name | Drug Groups | Generic Name | Drug Centered Network | Drug Structure |
| DB00143 | glutathione peroxidase 3 (plasma) | approved; nutraceutical | Glutathione |  |  |
| DB00515 | glutathione peroxidase 3 (plasma) | approved | Cisplatin |  |  |
| Top |
| Cross referenced IDs for GPX3 |
| * We obtained these cross-references from Uniprot database. It covers 150 different DBs, 18 categories. http://www.uniprot.org/help/cross_references_section |
: Open all cross reference information
|
Copyright © 2016-Present - The Univsersity of Texas Health Science Center at Houston @ |