|
||||||||||||||||||||
| |
| Phenotypic Information (metabolism pathway, cancer, disease, phenome) |
| |
| |
| Gene-Gene Network Information: Co-Expression Network, Interacting Genes & KEGG |
| |
|


| Gene Summary for HADH |
| Basic gene info. | Gene symbol | HADH |
| Gene name | hydroxyacyl-CoA dehydrogenase | |
| Synonyms | HAD|HADH1|HADHSC|HCDH|HHF4|MSCHAD|SCHAD | |
| Cytomap | UCSC genome browser: 4q22-q26 | |
| Genomic location | chr4 :108910869-108956331 | |
| Type of gene | protein-coding | |
| RefGenes | NM_001184705.2, NM_005327.4, | |
| Ensembl id | ENSG00000138796 | |
| Description | L-3-hydroxyacyl-Coenzyme A dehydrogenase, short chainhydroxyacyl-coenzyme A dehydrogenase, mitochondrialmedium and short-chain L-3-hydroxyacyl-coenzyme A dehydrogenaseshort-chain 3-hydroxyacyl-CoA dehydrogenase | |
| Modification date | 20141219 | |
| dbXrefs | MIM : 601609 | |
| HGNC : HGNC | ||
| Ensembl : ENSG00000138796 | ||
| Vega : OTTHUMG00000131810 | ||
| Protein | UniProt: go to UniProt's Cross Reference DB Table | |
| Expression | CleanEX: HS_HADH | |
| BioGPS: 3033 | ||
| Gene Expression Atlas: ENSG00000138796 | ||
| The Human Protein Atlas: ENSG00000138796 | ||
| Pathway | NCI Pathway Interaction Database: HADH | |
| KEGG: HADH | ||
| REACTOME: HADH | ||
| ConsensusPathDB | ||
| Pathway Commons: HADH | ||
| Metabolism | MetaCyc: HADH | |
| HUMANCyc: HADH | ||
| Regulation | Ensembl's Regulation: ENSG00000138796 | |
| miRBase: chr4 :108,910,869-108,956,331 | ||
| TargetScan: NM_001184705 | ||
| cisRED: ENSG00000138796 | ||
| Context | iHOP: HADH | |
| cancer metabolism search in PubMed: HADH | ||
| UCL Cancer Institute: HADH | ||
| Assigned class in ccmGDB | C | |
| Top |
| Phenotypic Information for HADH(metabolism pathway, cancer, disease, phenome) |
| Cancer | CGAP: HADH |
| Familial Cancer Database: HADH | |
| * This gene is included in those cancer gene databases. |
|
|
|
|
|
|
| ||||||||||||||
Oncogene 1 | Significant driver gene in | |||||||||||||||||||
| cf) number; DB name 1 Oncogene; http://nar.oxfordjournals.org/content/35/suppl_1/D721.long, 2 Tumor Suppressor gene; https://bioinfo.uth.edu/TSGene/, 3 Cancer Gene Census; http://www.nature.com/nrc/journal/v4/n3/abs/nrc1299.html, 4 CancerGenes; http://nar.oxfordjournals.org/content/35/suppl_1/D721.long, 5 Network of Cancer Gene; http://ncg.kcl.ac.uk/index.php, 1Therapeutic Vulnerabilities in Cancer; http://cbio.mskcc.org/cancergenomics/statius/ |
| KEGG_FATTY_ACID_METABOLISM KEGG_TRYPTOPHAN_METABOLISM KEGG_BUTANOATE_METABOLISM REACTOME_METABOLISM_OF_LIPIDS_AND_LIPOPROTEINS | |
| OMIM | |
| Orphanet | |
| Disease | KEGG Disease: HADH |
| MedGen: HADH (Human Medical Genetics with Condition) | |
| ClinVar: HADH | |
| Phenotype | MGI: HADH (International Mouse Phenotyping Consortium) |
| PhenomicDB: HADH | |
| Mutations for HADH |
| * Under tables are showing count per each tissue to give us broad intuition about tissue specific mutation patterns.You can go to the detailed page for each mutation database's web site. |
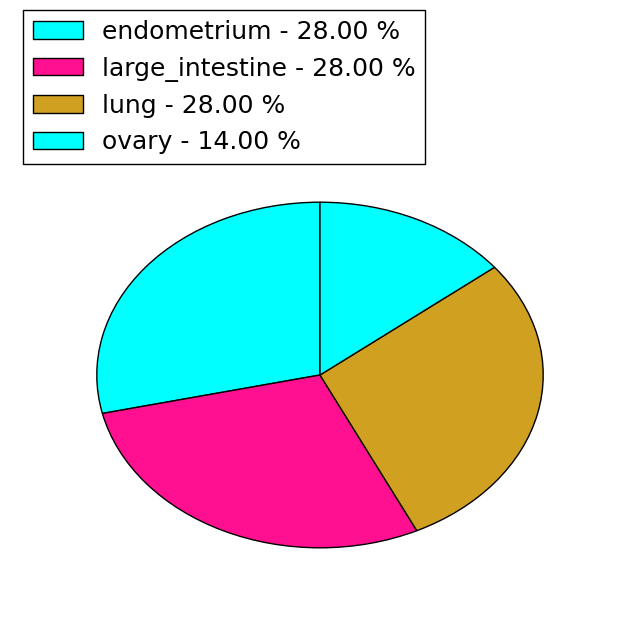
| - Statistics for Tissue and Mutation type | Top |
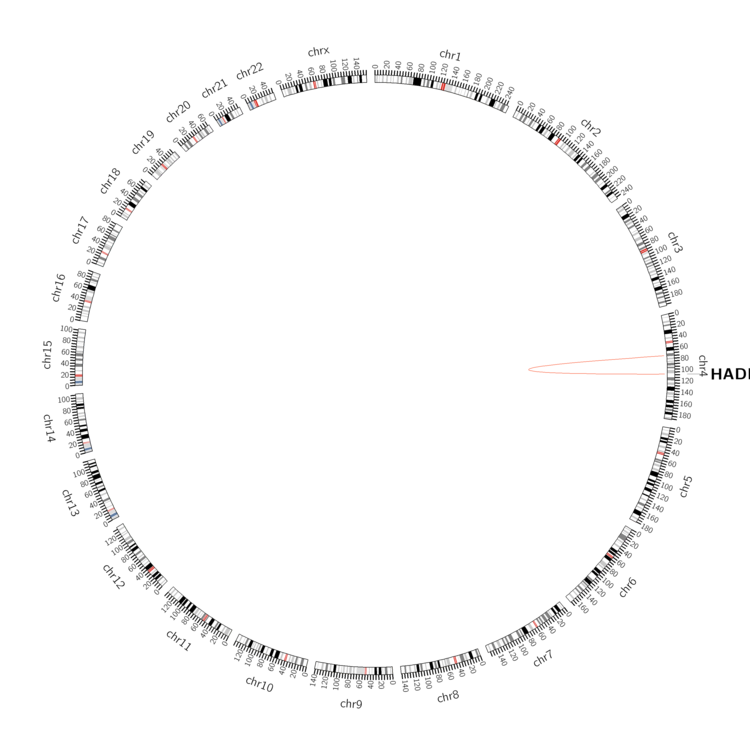 |
| - For Inter-chromosomal Variations |
| There's no inter-chromosomal structural variation. |
| - For Intra-chromosomal Variations |
| * Intra-chromosomal variantions includes 'intrachromosomal amplicon to amplicon', 'intrachromosomal amplicon to non-amplified dna', 'intrachromosomal deletion', 'intrachromosomal fold-back inversion', 'intrachromosomal inversion', 'intrachromosomal tandem duplication', 'Intrachromosomal unknown type', 'intrachromosomal with inverted orientation', 'intrachromosomal with non-inverted orientation'. |
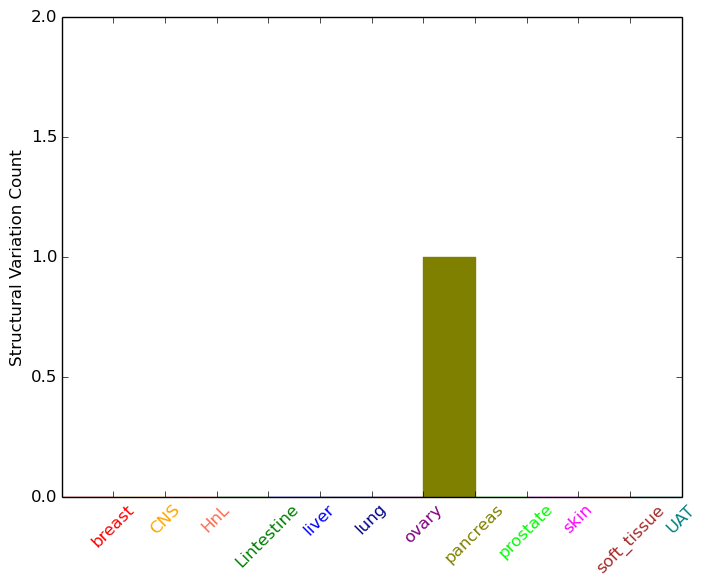 |
| Sample | Symbol_a | Chr_a | Start_a | End_a | Symbol_b | Chr_b | Start_b | End_b |
| pancreas | HADH | chr4 | 108920782 | 108920802 | chr4 | 74966341 | 74966361 |
| cf) Tissue number; Tissue name (1;Breast, 2;Central_nervous_system, 3;Haematopoietic_and_lymphoid_tissue, 4;Large_intestine, 5;Liver, 6;Lung, 7;Ovary, 8;Pancreas, 9;Prostate, 10;Skin, 11;Soft_tissue, 12;Upper_aerodigestive_tract) |
| * From mRNA Sanger sequences, Chitars2.0 arranged chimeric transcripts. This table shows HADH related fusion information. |
| ID | Head Gene | Tail Gene | Accession | Gene_a | qStart_a | qEnd_a | Chromosome_a | tStart_a | tEnd_a | Gene_a | qStart_a | qEnd_a | Chromosome_a | tStart_a | tEnd_a |
| BQ314823 | HADH | 11 | 372 | 4 | 108944648 | 108955491 | NCL | 365 | 595 | 2 | 232321427 | 232322411 | |
| AF133424 | TSPAN16 | 9 | 1048 | 19 | 11406824 | 11437672 | HADH | 1047 | 1841 | 4 | 108940694 | 108955648 | |
| BF348759 | HADH | 2 | 351 | 4 | 108944669 | 108955491 | NCL | 344 | 403 | 2 | 232322352 | 232322411 | |
| AW375766 | HADH | 8 | 290 | 4 | 108955685 | 108955967 | ATP5B | 285 | 399 | 12 | 57031962 | 57032076 | |
| CB164018 | HADH | 1 | 78 | 4 | 108911008 | 108911085 | HADH | 78 | 636 | 4 | 108935650 | 108949090 | |
| BM504479 | HADH | 8 | 438 | 4 | 108911077 | 108935744 | MEIS1 | 438 | 573 | 2 | 66784099 | 66784234 | |
| Top |
| There's no copy number variation information in COSMIC data for this gene. |
| Top |
|
 |
| Top |
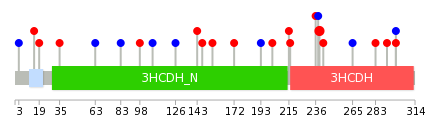
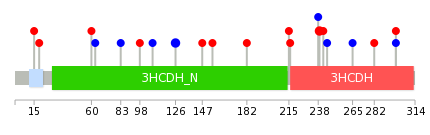
| Stat. for Non-Synonymous SNVs (# total SNVs=13) | (# total SNVs=7) |
 |  |
(# total SNVs=0) | (# total SNVs=0) |
| Top |
| * When you move the cursor on each content, you can see more deailed mutation information on the Tooltip. Those are primary_site,primary_histology,mutation(aa),pubmedID. |
| GRCh37 position | Mutation(aa) | Unique sampleID count |
| chr4:108954337-108954337 | p.A239T | 3 |
| chr4:108948850-108948850 | p.P215S | 1 |
| chr4:108935703-108935703 | p.V126V | 1 |
| chr4:108948853-108948853 | p.G216W | 1 |
| chr4:108911097-108911097 | p.F3F | 1 |
| chr4:108940705-108940705 | p.I143M | 1 |
| chr4:108948914-108948914 | p.R236Q | 1 |
| chr4:108911132-108911132 | p.S15L | 1 |
| chr4:108940716-108940716 | p.N147S | 1 |
| chr4:108954336-108954336 | p.D238D | 1 |
| Top |
|
 |
| Point Mutation/ Tissue ID | 1 | 2 | 3 | 4 | 5 | 6 | 7 | 8 | 9 | 10 | 11 | 12 | 13 | 14 | 15 | 16 | 17 | 18 | 19 | 20 |
| # sample | 1 | 2 | 3 | 4 | 1 | 1 | 1 | 3 | 1 | 1 | 2 | 3 | ||||||||
| # mutation | 1 | 2 | 3 | 4 | 1 | 1 | 1 | 3 | 1 | 1 | 2 | 3 | ||||||||
| nonsynonymous SNV | 1 | 2 | 2 | 2 | 1 | 1 | 2 | 1 | 1 | 1 | ||||||||||
| synonymous SNV | 1 | 2 | 1 | 1 | 1 | 1 | 2 |
| cf) Tissue ID; Tissue type (1; BLCA[Bladder Urothelial Carcinoma], 2; BRCA[Breast invasive carcinoma], 3; CESC[Cervical squamous cell carcinoma and endocervical adenocarcinoma], 4; COAD[Colon adenocarcinoma], 5; GBM[Glioblastoma multiforme], 6; Glioma Low Grade, 7; HNSC[Head and Neck squamous cell carcinoma], 8; KICH[Kidney Chromophobe], 9; KIRC[Kidney renal clear cell carcinoma], 10; KIRP[Kidney renal papillary cell carcinoma], 11; LAML[Acute Myeloid Leukemia], 12; LUAD[Lung adenocarcinoma], 13; LUSC[Lung squamous cell carcinoma], 14; OV[Ovarian serous cystadenocarcinoma ], 15; PAAD[Pancreatic adenocarcinoma], 16; PRAD[Prostate adenocarcinoma], 17; SKCM[Skin Cutaneous Melanoma], 18:STAD[Stomach adenocarcinoma], 19:THCA[Thyroid carcinoma], 20:UCEC[Uterine Corpus Endometrial Carcinoma]) |
| Top |
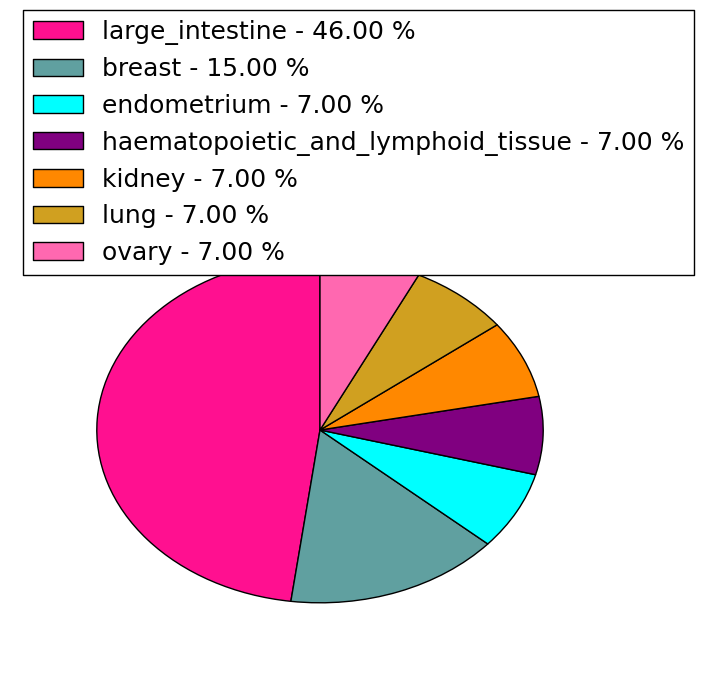
| * We represented just top 10 SNVs. When you move the cursor on each content, you can see more deailed mutation information on the Tooltip. Those are primary_site, primary_histology, mutation(aa), pubmedID. |
| Genomic Position | Mutation(aa) | Unique sampleID count |
| chr4:108954337 | p.A239T,HADH | 2 |
| chr4:108935703 | p.V126V,HADH | 2 |
| chr4:108955465 | p.N245N | 1 |
| chr4:108940820 | p.D238D,HADH | 1 |
| chr4:108911132 | p.S15L,HADH | 1 |
| chr4:108948850 | p.E242K,HADH | 1 |
| chr4:108911144 | p.S19L,HADH | 1 |
| chr4:108948853 | p.V265V,HADH | 1 |
| chr4:108930962 | p.E60D,HADH | 1 |
| chr4:108953508 | p.A282T,HADH | 1 |
| * Copy number data were extracted from TCGA using R package TCGA-Assembler. The URLs of all public data files on TCGA DCC data server were gathered on Jan-05-2015. Function ProcessCNAData in TCGA-Assembler package was used to obtain gene-level copy number value which is calculated as the average copy number of the genomic region of a gene. |
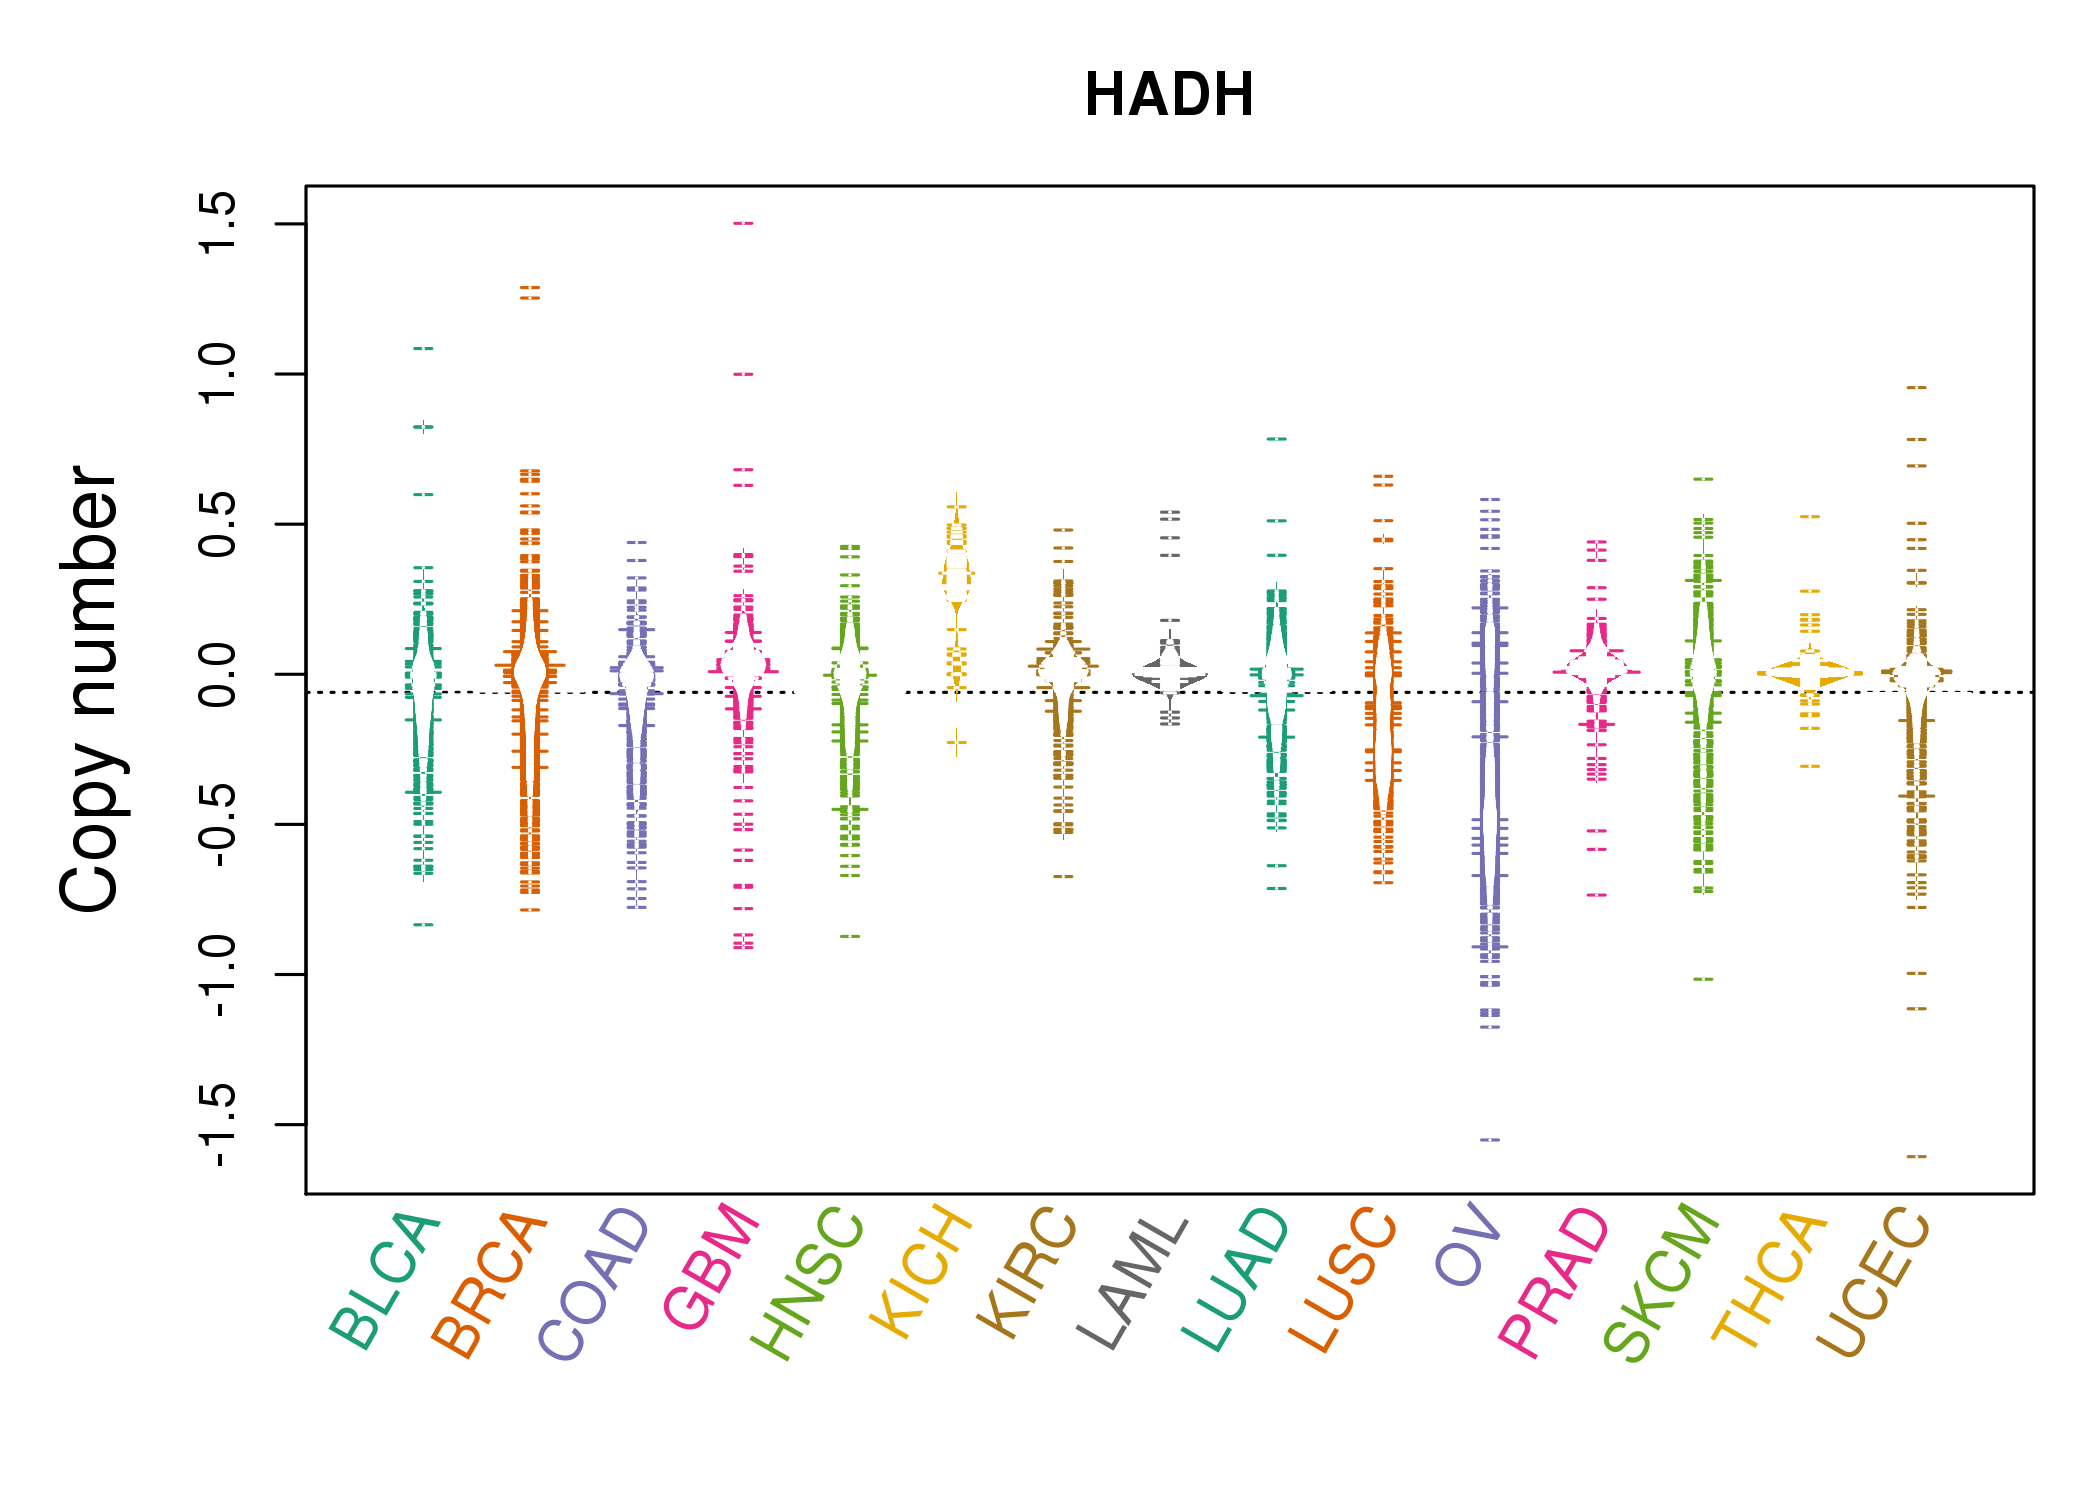 |
| cf) Tissue ID[Tissue type]: BLCA[Bladder Urothelial Carcinoma], BRCA[Breast invasive carcinoma], CESC[Cervical squamous cell carcinoma and endocervical adenocarcinoma], COAD[Colon adenocarcinoma], GBM[Glioblastoma multiforme], Glioma Low Grade, HNSC[Head and Neck squamous cell carcinoma], KICH[Kidney Chromophobe], KIRC[Kidney renal clear cell carcinoma], KIRP[Kidney renal papillary cell carcinoma], LAML[Acute Myeloid Leukemia], LUAD[Lung adenocarcinoma], LUSC[Lung squamous cell carcinoma], OV[Ovarian serous cystadenocarcinoma ], PAAD[Pancreatic adenocarcinoma], PRAD[Prostate adenocarcinoma], SKCM[Skin Cutaneous Melanoma], STAD[Stomach adenocarcinoma], THCA[Thyroid carcinoma], UCEC[Uterine Corpus Endometrial Carcinoma] |
| Top |
| Gene Expression for HADH |
| * CCLE gene expression data were extracted from CCLE_Expression_Entrez_2012-10-18.res: Gene-centric RMA-normalized mRNA expression data. |
 |
| * Normalized gene expression data of RNASeqV2 was extracted from TCGA using R package TCGA-Assembler. The URLs of all public data files on TCGA DCC data server were gathered at Jan-05-2015. Only eight cancer types have enough normal control samples for differential expression analysis. (t test, adjusted p<0.05 (using Benjamini-Hochberg FDR)) |
 |
| Top |
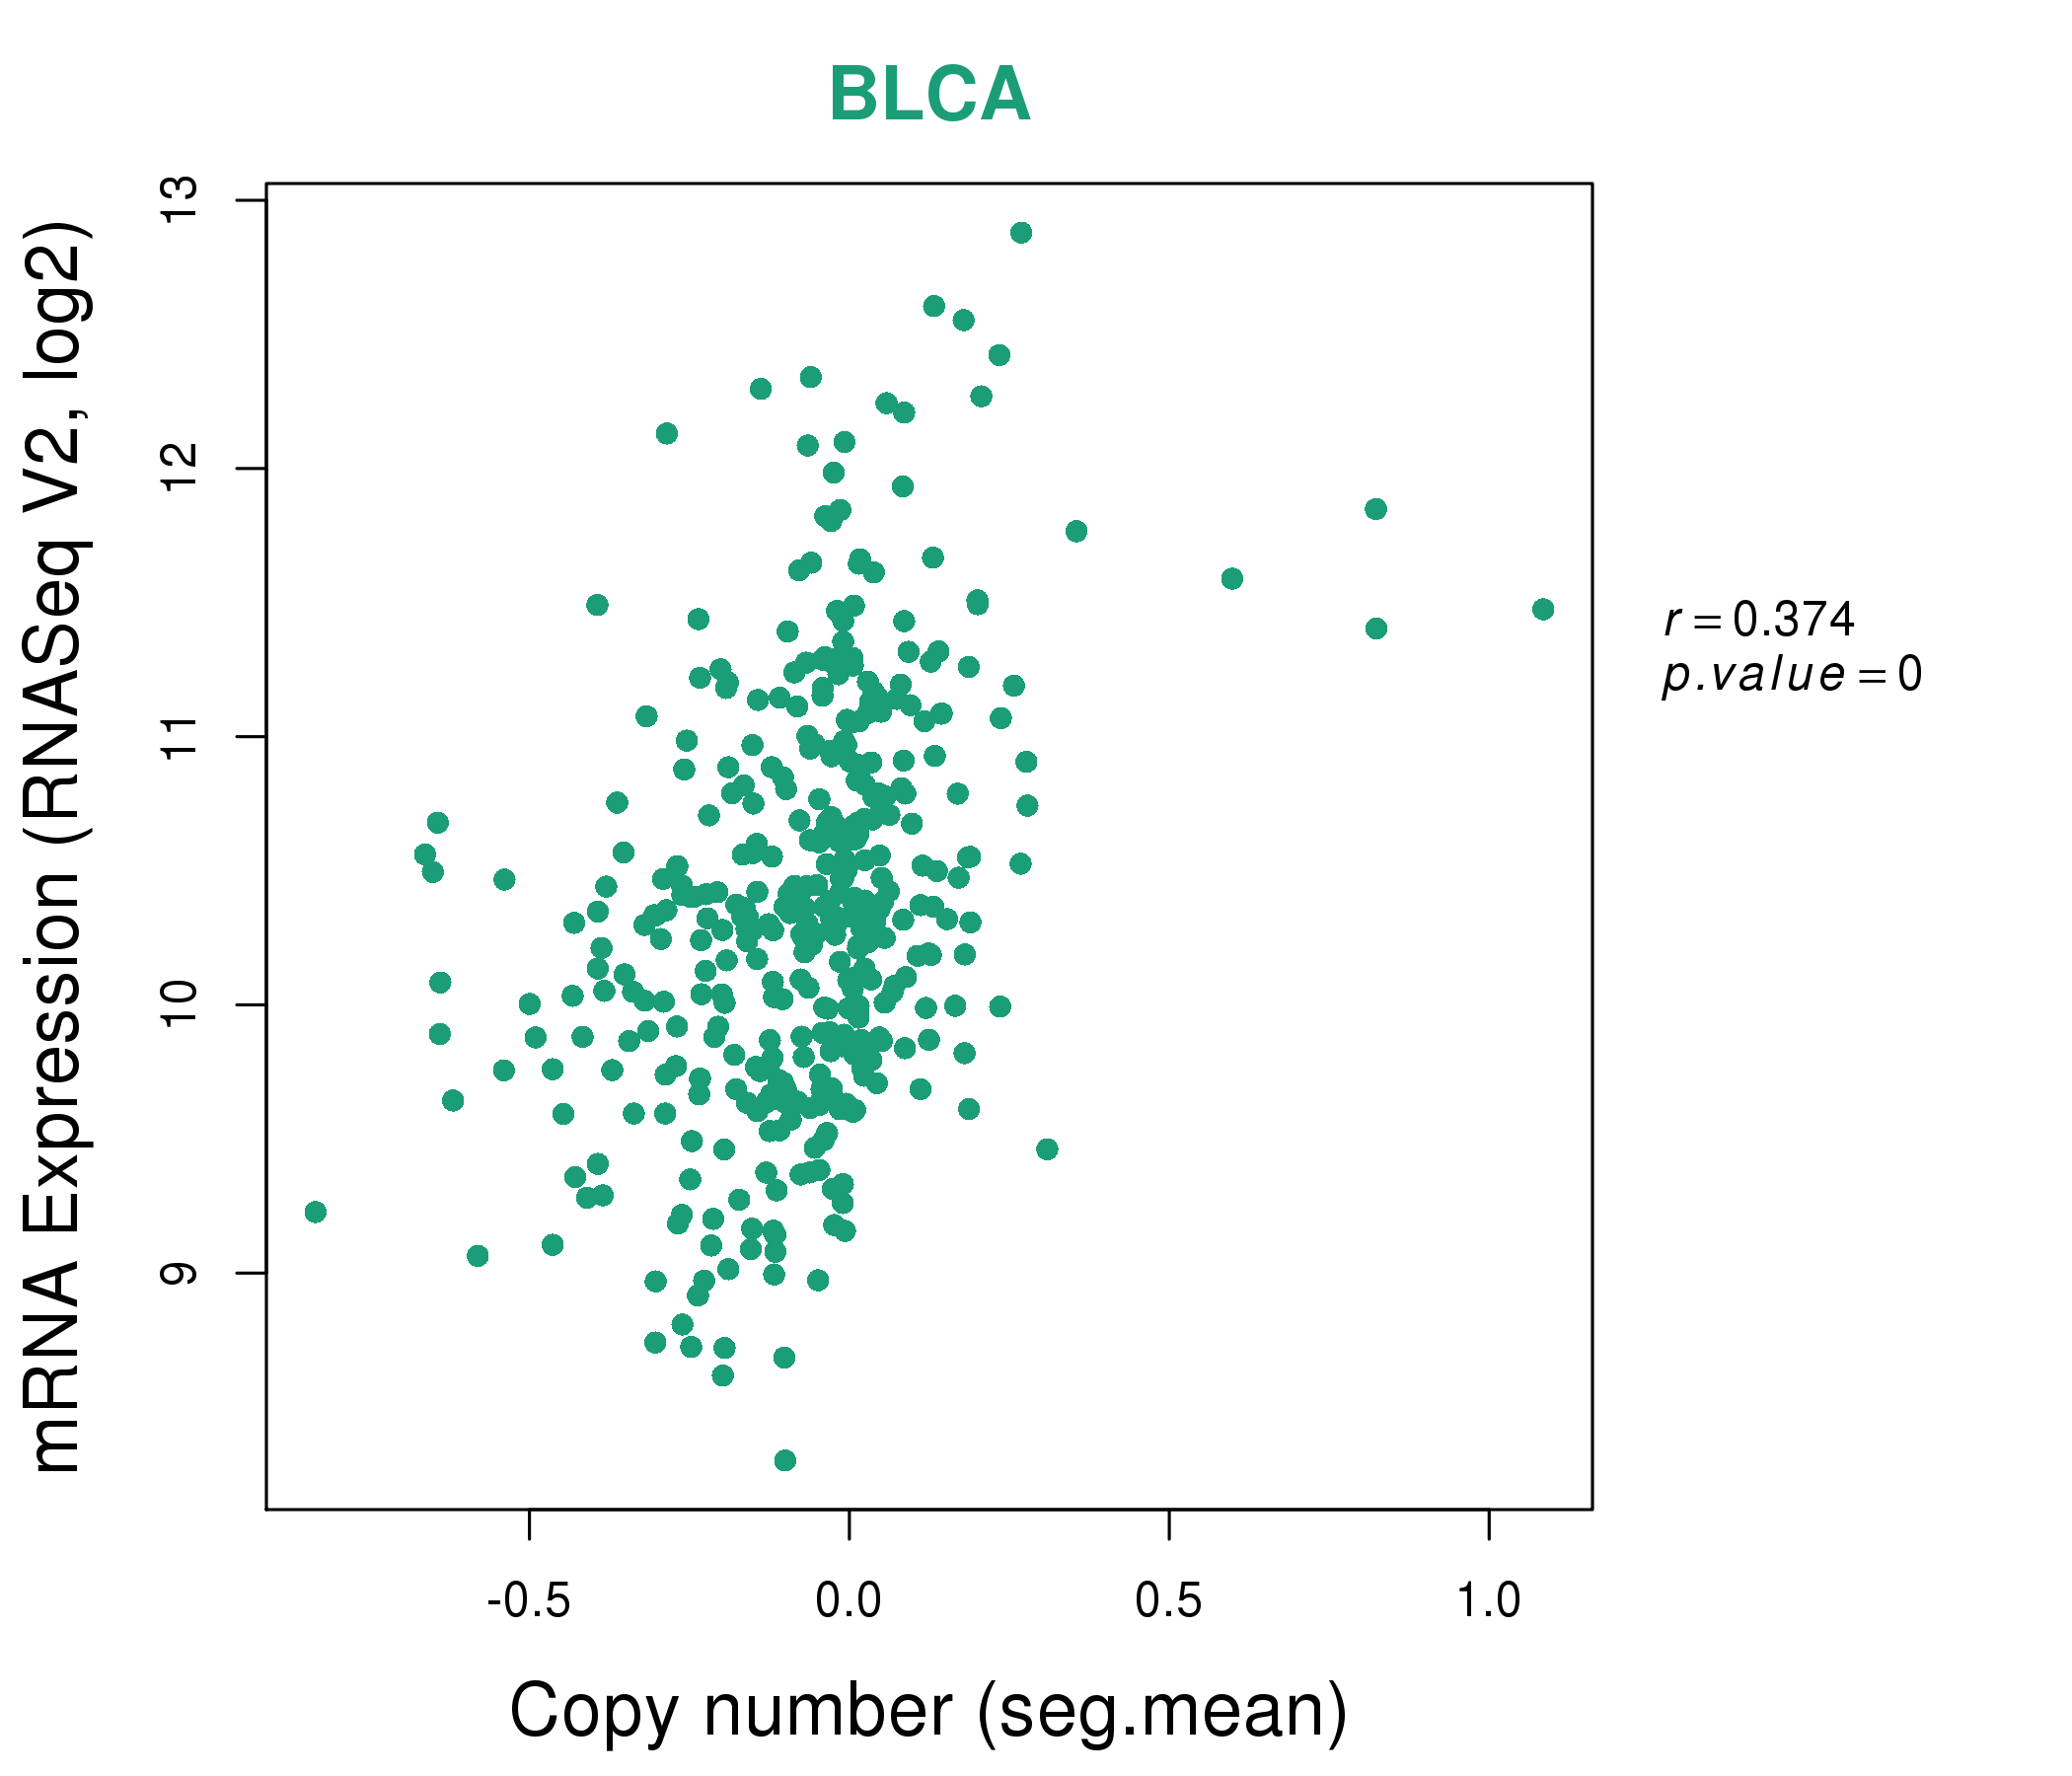
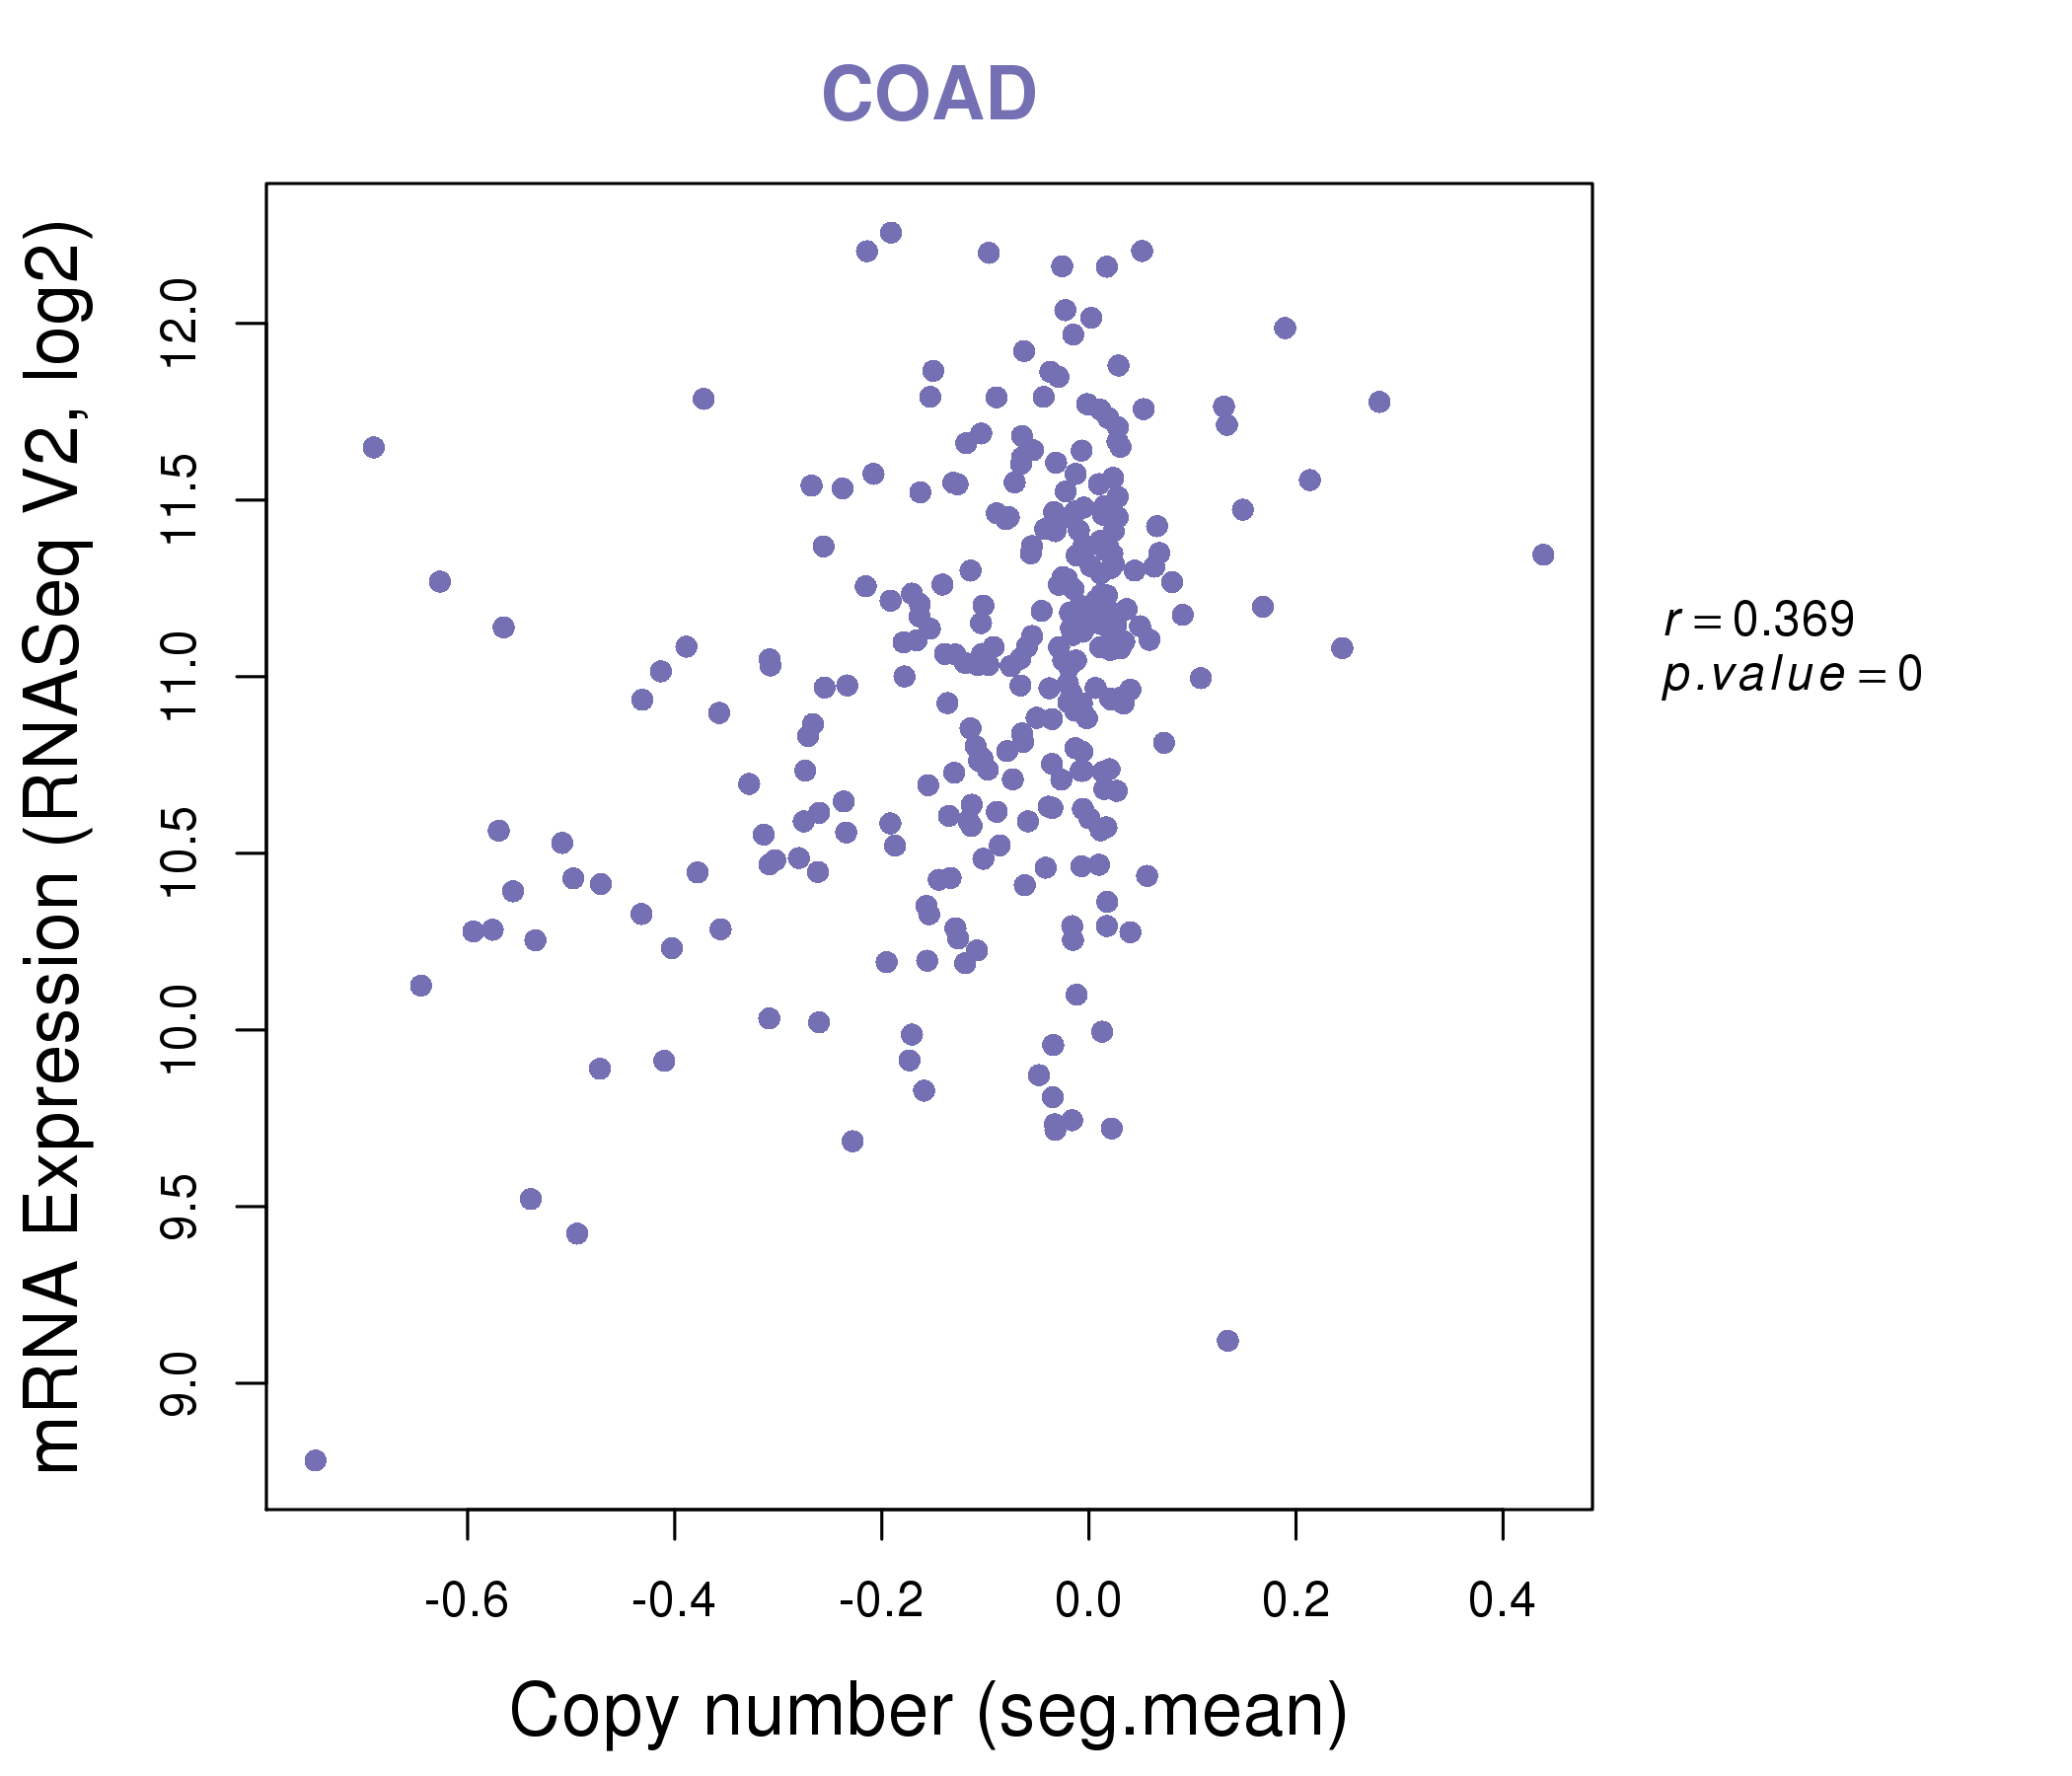
| * This plots show the correlation between CNV and gene expression. |
: Open all plots for all cancer types
 |
|
 |
|


| Top |
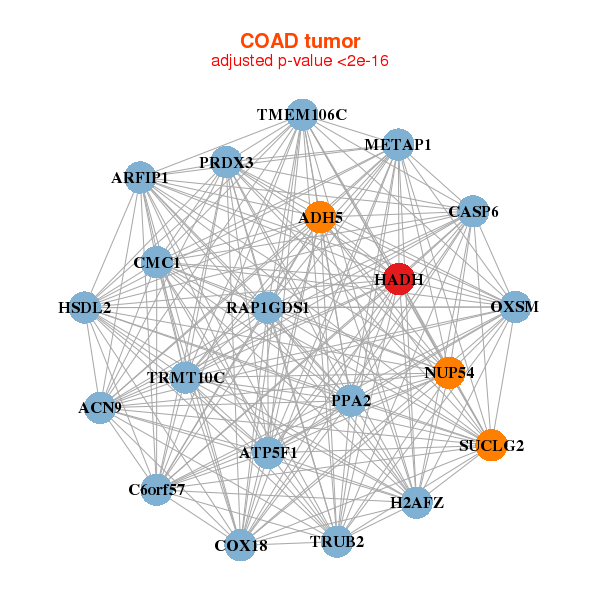
| Gene-Gene Network Information |
| * Co-Expression network figures were drawn using R package igraph. Only the top 20 genes with the highest correlations were shown. Red circle: input gene, orange circle: cell metabolism gene, sky circle: other gene |
: Open all plots for all cancer types
 |
| ||||
| BRE,SLC35F6,DYNC2LI1,GTF3C2,HADHA,HADHB,IMMT, LAPTM4A,MRPL19,MRPL35,NDUFA10,PCCB,PRDX3,PREPL, RAB10,RBKS,SH3YL1,SRBD1,TRMT61B,UQCRC2,YPEL5 | ACAT1,ATP5B,ADCK3,COX5A,EPM2A,MTFR1L,FH, HADHB,KLHL31,NDUFS1,NNT,NRD1,PDHX,PHYH, PPP3CB,RRAGD,RXRG,SCN4A,SDHB,SNTA1,UQCRFS1 | ||||
 |
| ||||
| ACADS,ATP5A1,ATP5G3,CES3,CPT2,ECHS1,FASTKD1, HADHA,HADHB,IMMT,KIAA0391,MDH1,MRPL35,AP5M1, NAT1,NDUFA10,PCCB,SDHD,SUCLG1,UQCRC1,UQCRC2 | ACSL5,AKR1B10,BTD,CROT,CYP2B6,CYP2C18,GDPD2, HADHA,HADHB,HSD17B11,NCOA4,PBLD,PGRMC1,PRAP1, RBKS,SLC23A3,SLC3A1,SNX24,TMBIM6,TMEM82,TOR1AIP2 |
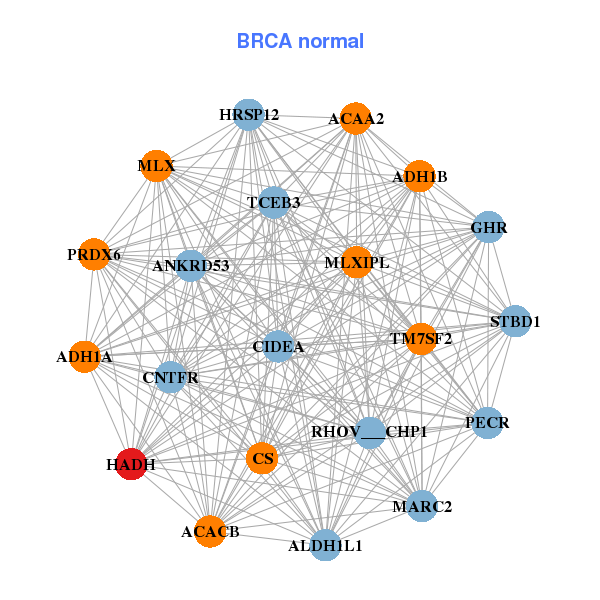
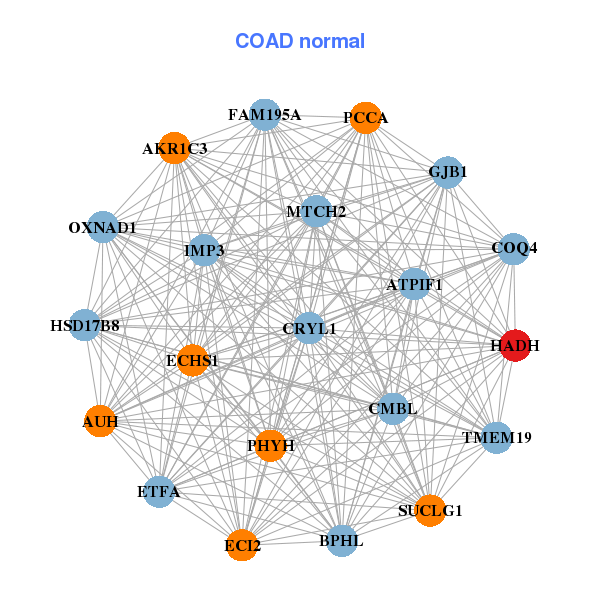
| * Co-Expression network figures were drawn using R package igraph. Only the top 20 genes with the highest correlations were shown. Red circle: input gene, orange circle: cell metabolism gene, sky circle: other gene |
: Open all plots for all cancer types
| Top |
: Open all interacting genes' information including KEGG pathway for all interacting genes from DAVID
| Top |
| Pharmacological Information for HADH |
| DB Category | DB Name | DB's ID and Url link |
| * Gene Centered Interaction Network. |
 |
| * Drug Centered Interaction Network. |
| DrugBank ID | Target Name | Drug Groups | Generic Name | Drug Centered Network | Drug Structure |
| DB00157 | hydroxyacyl-CoA dehydrogenase | approved; nutraceutical | NADH |  |  |
| DB01907 | hydroxyacyl-CoA dehydrogenase | experimental | Nicotinamide-Adenine-Dinucleotide | 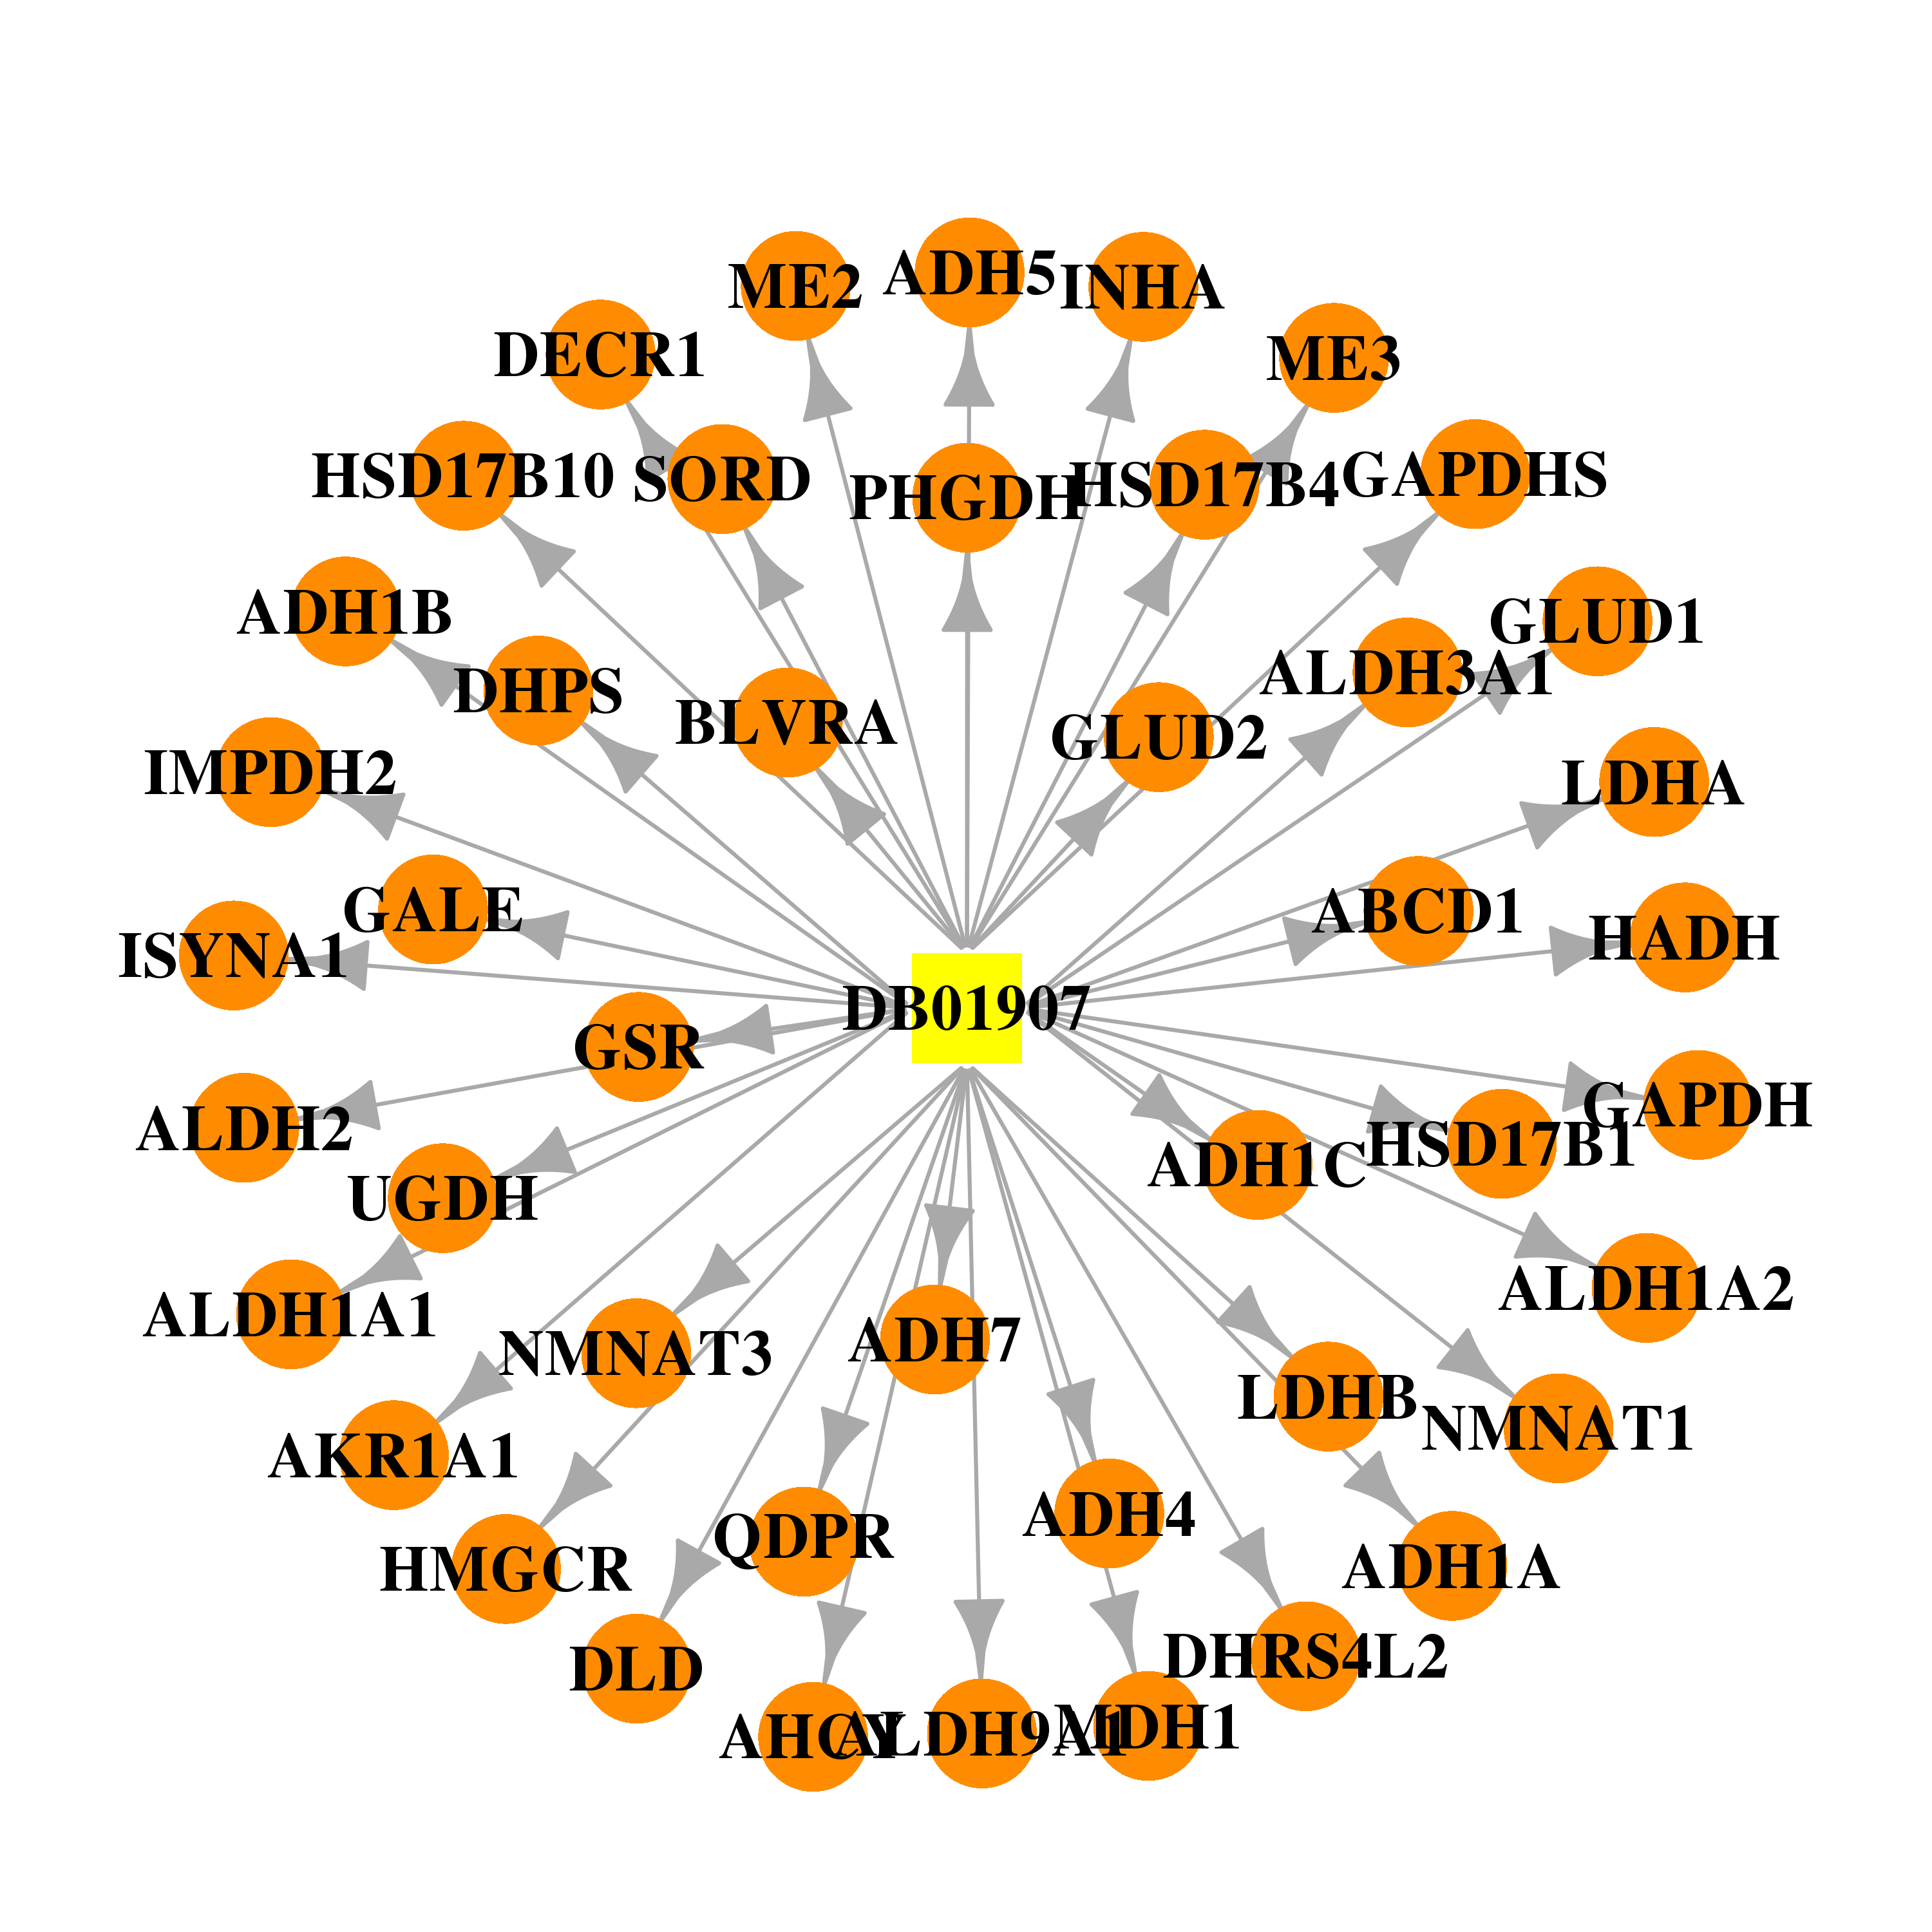 | 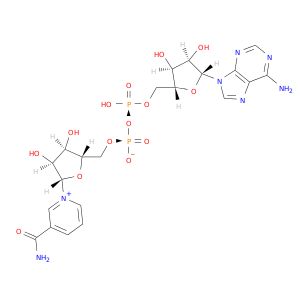 |
| DB03059 | hydroxyacyl-CoA dehydrogenase | experimental | Acetoacetyl-Coenzyme A | 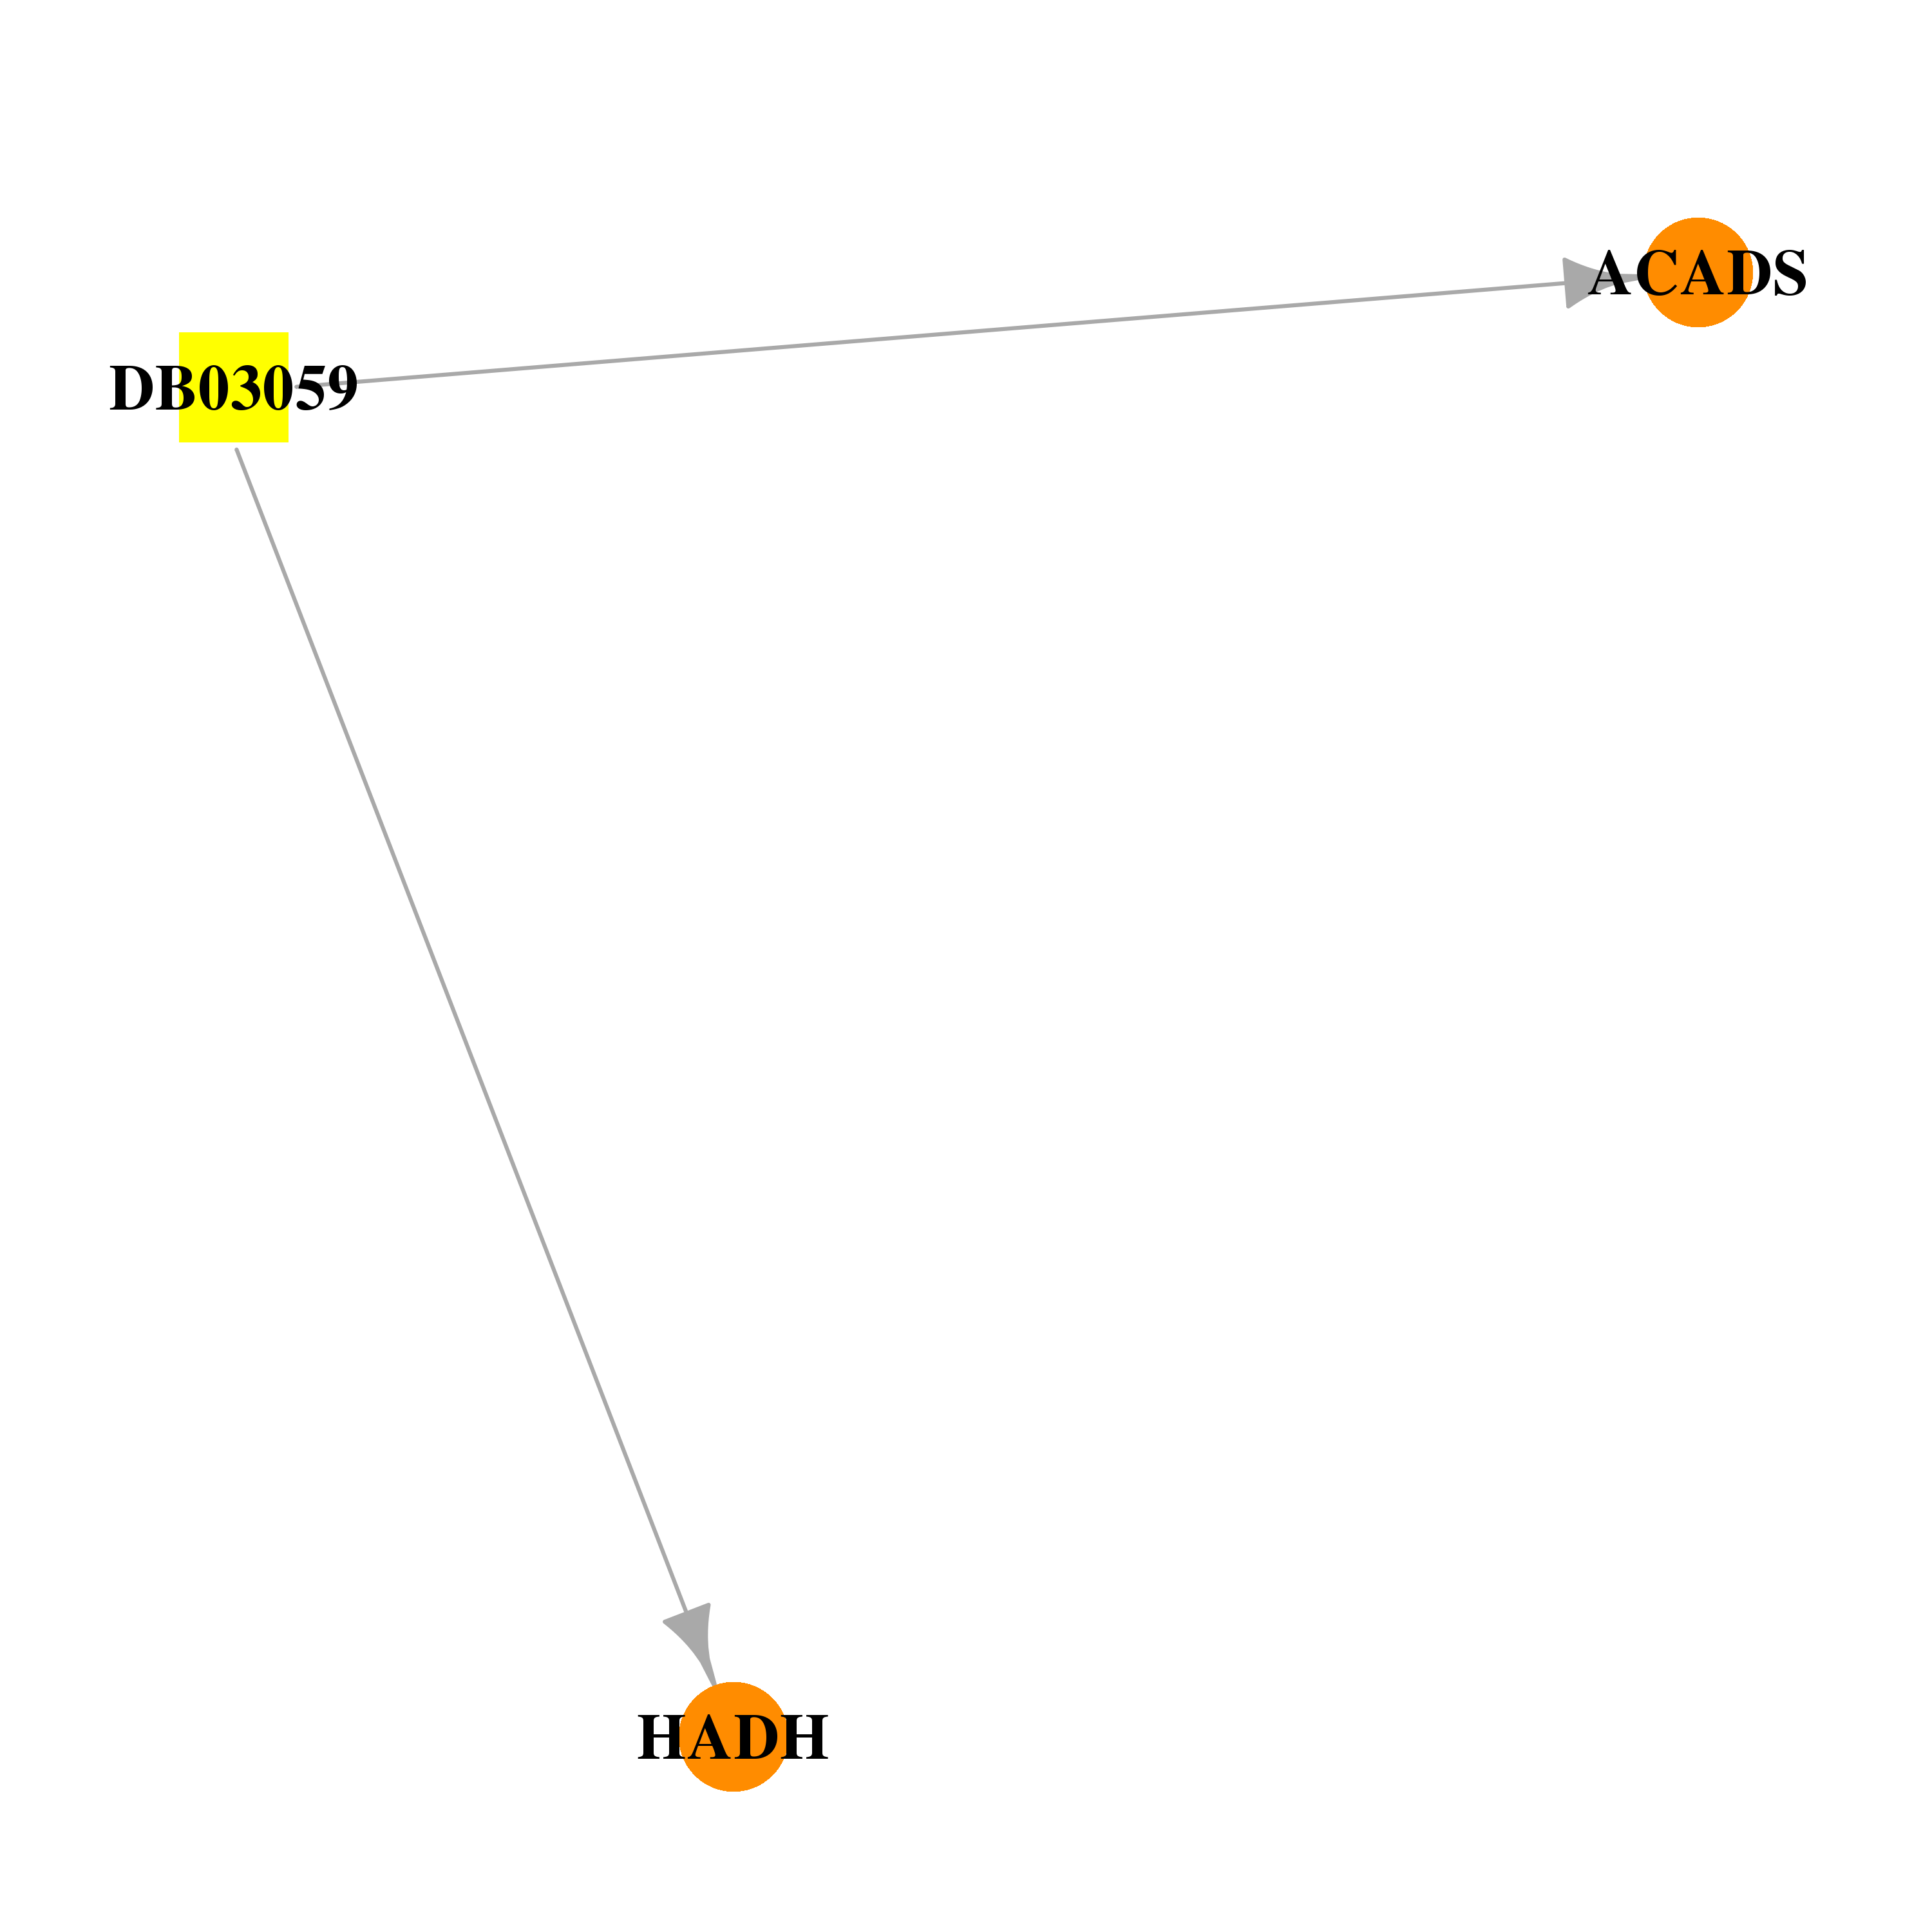 | 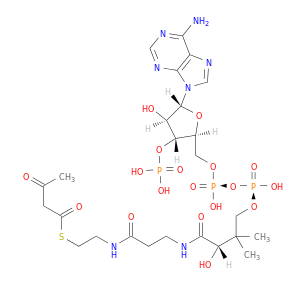 |
| DB03612 | hydroxyacyl-CoA dehydrogenase | experimental | 3-Hydroxybutyryl-Coenzyme A | 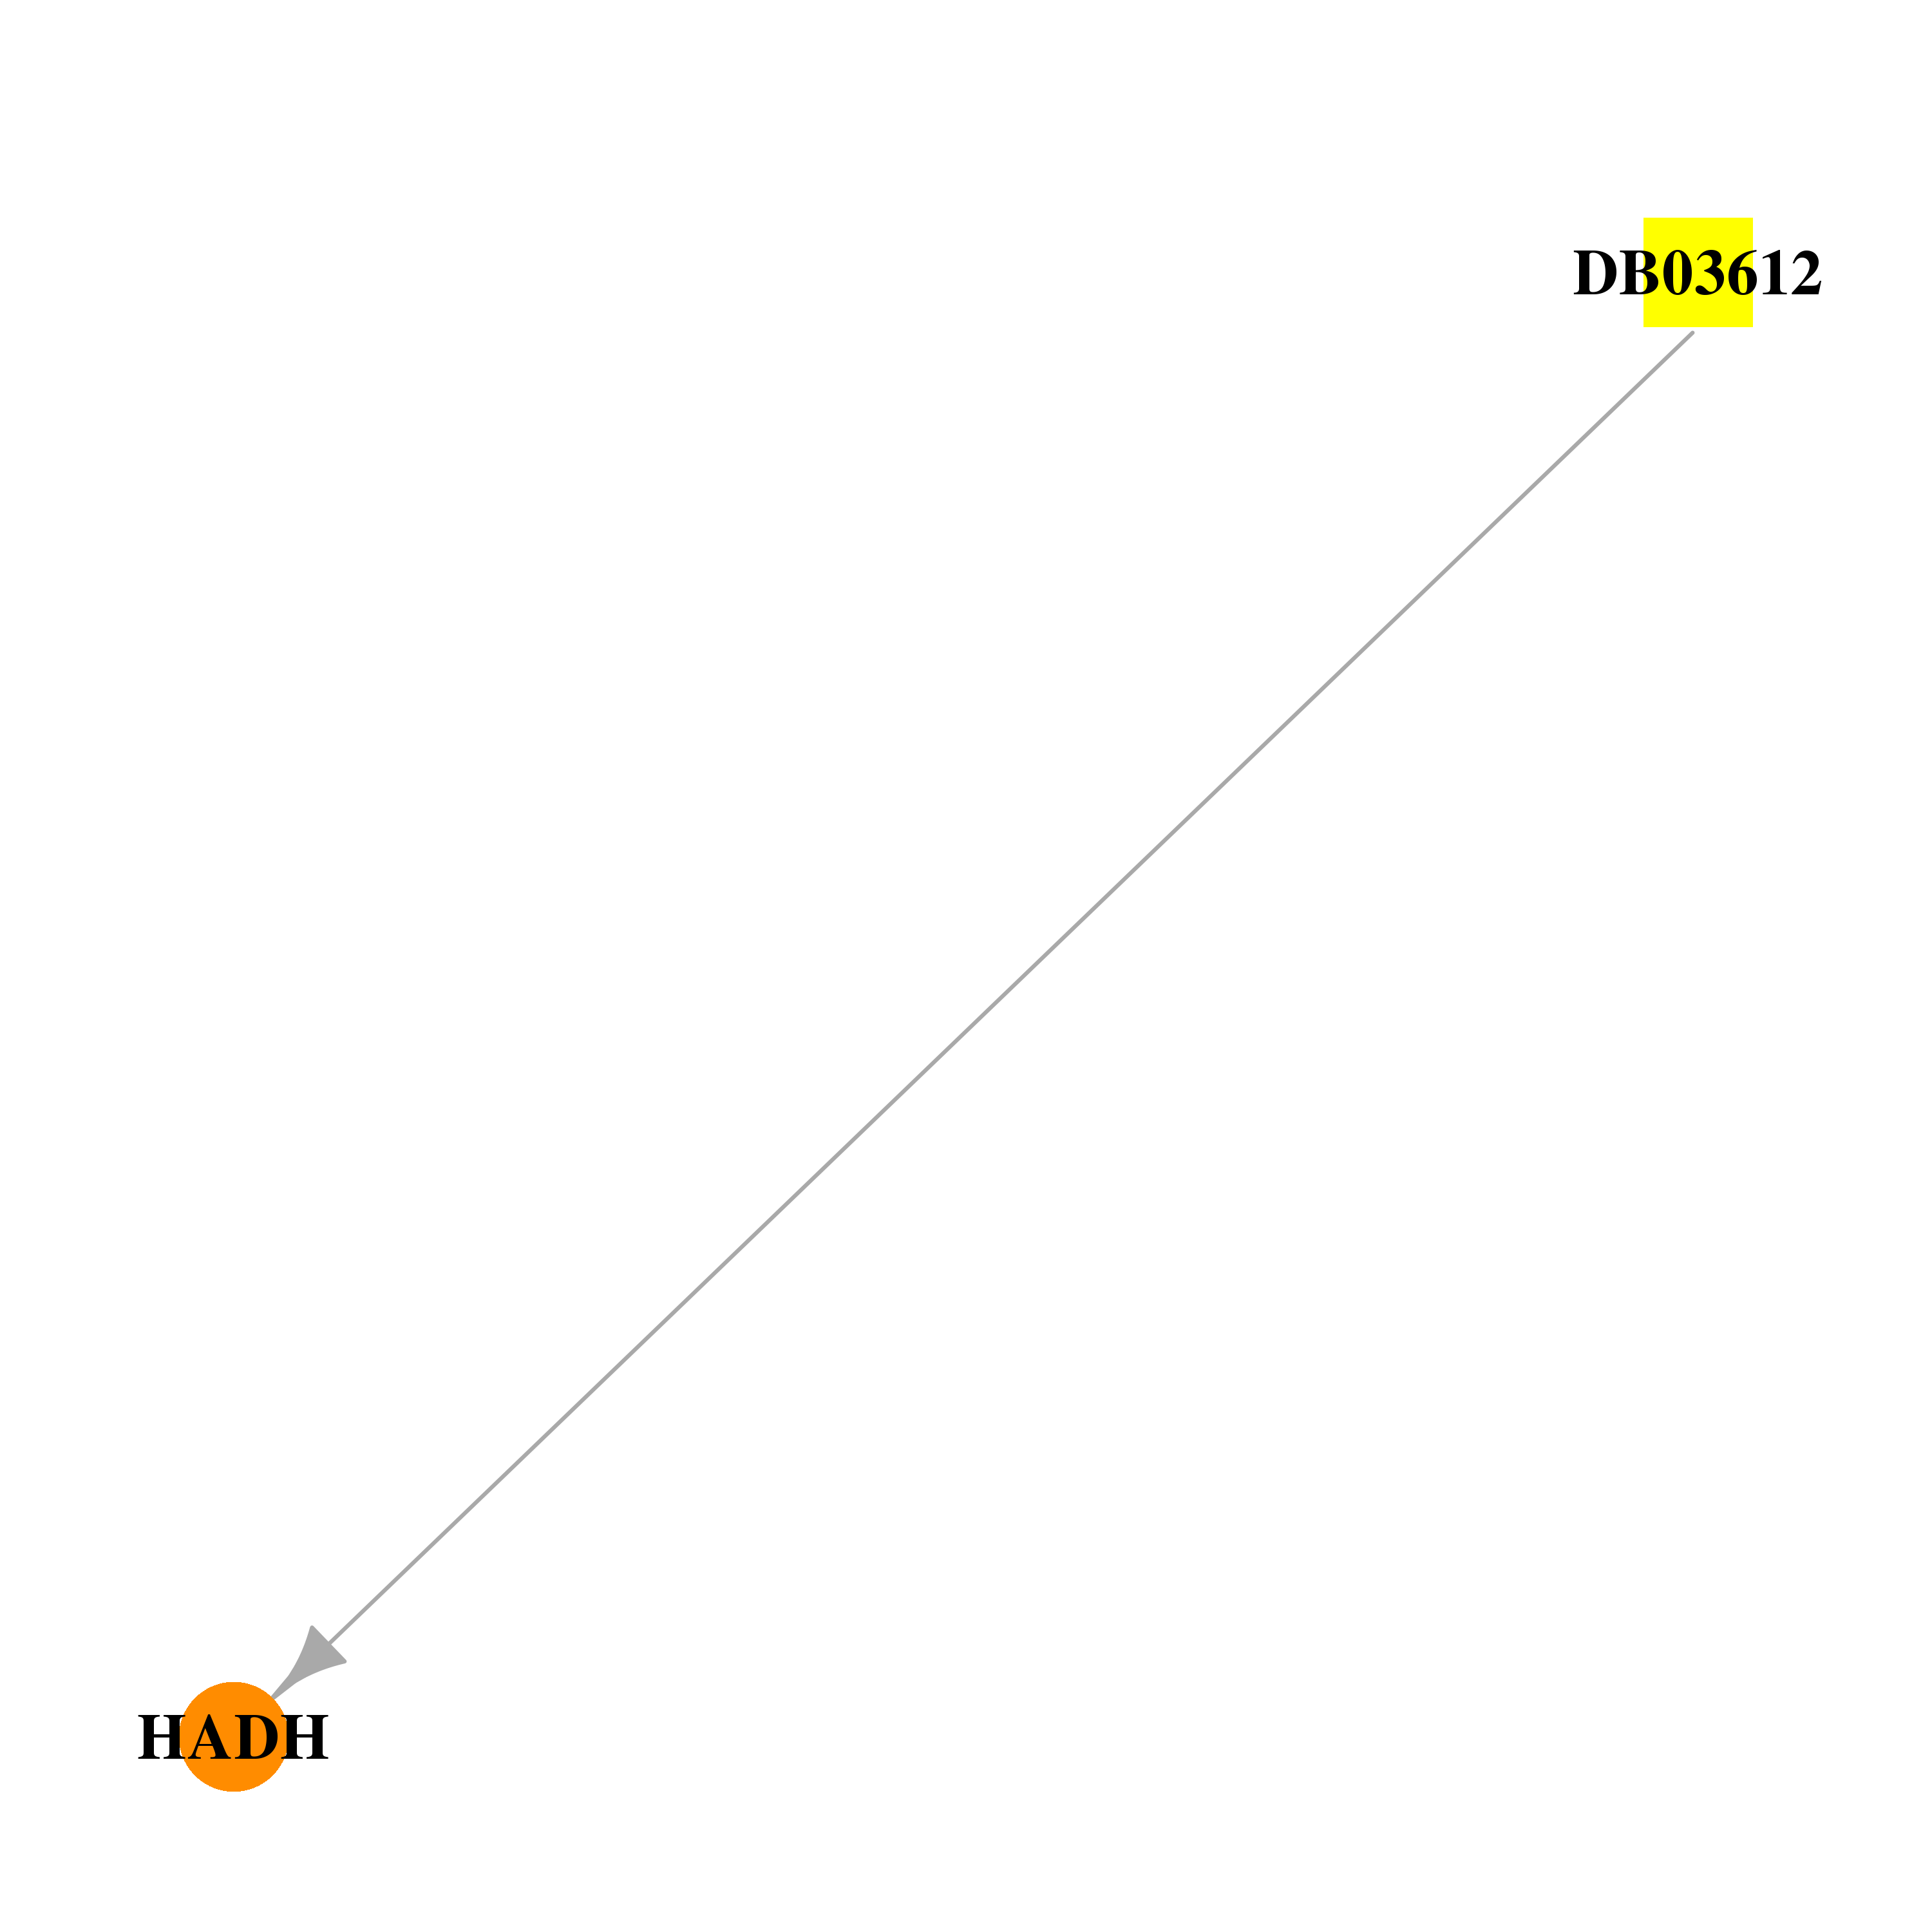 |  |
| DB00123 | hydroxyacyl-CoA dehydrogenase | approved; nutraceutical | L-Lysine | 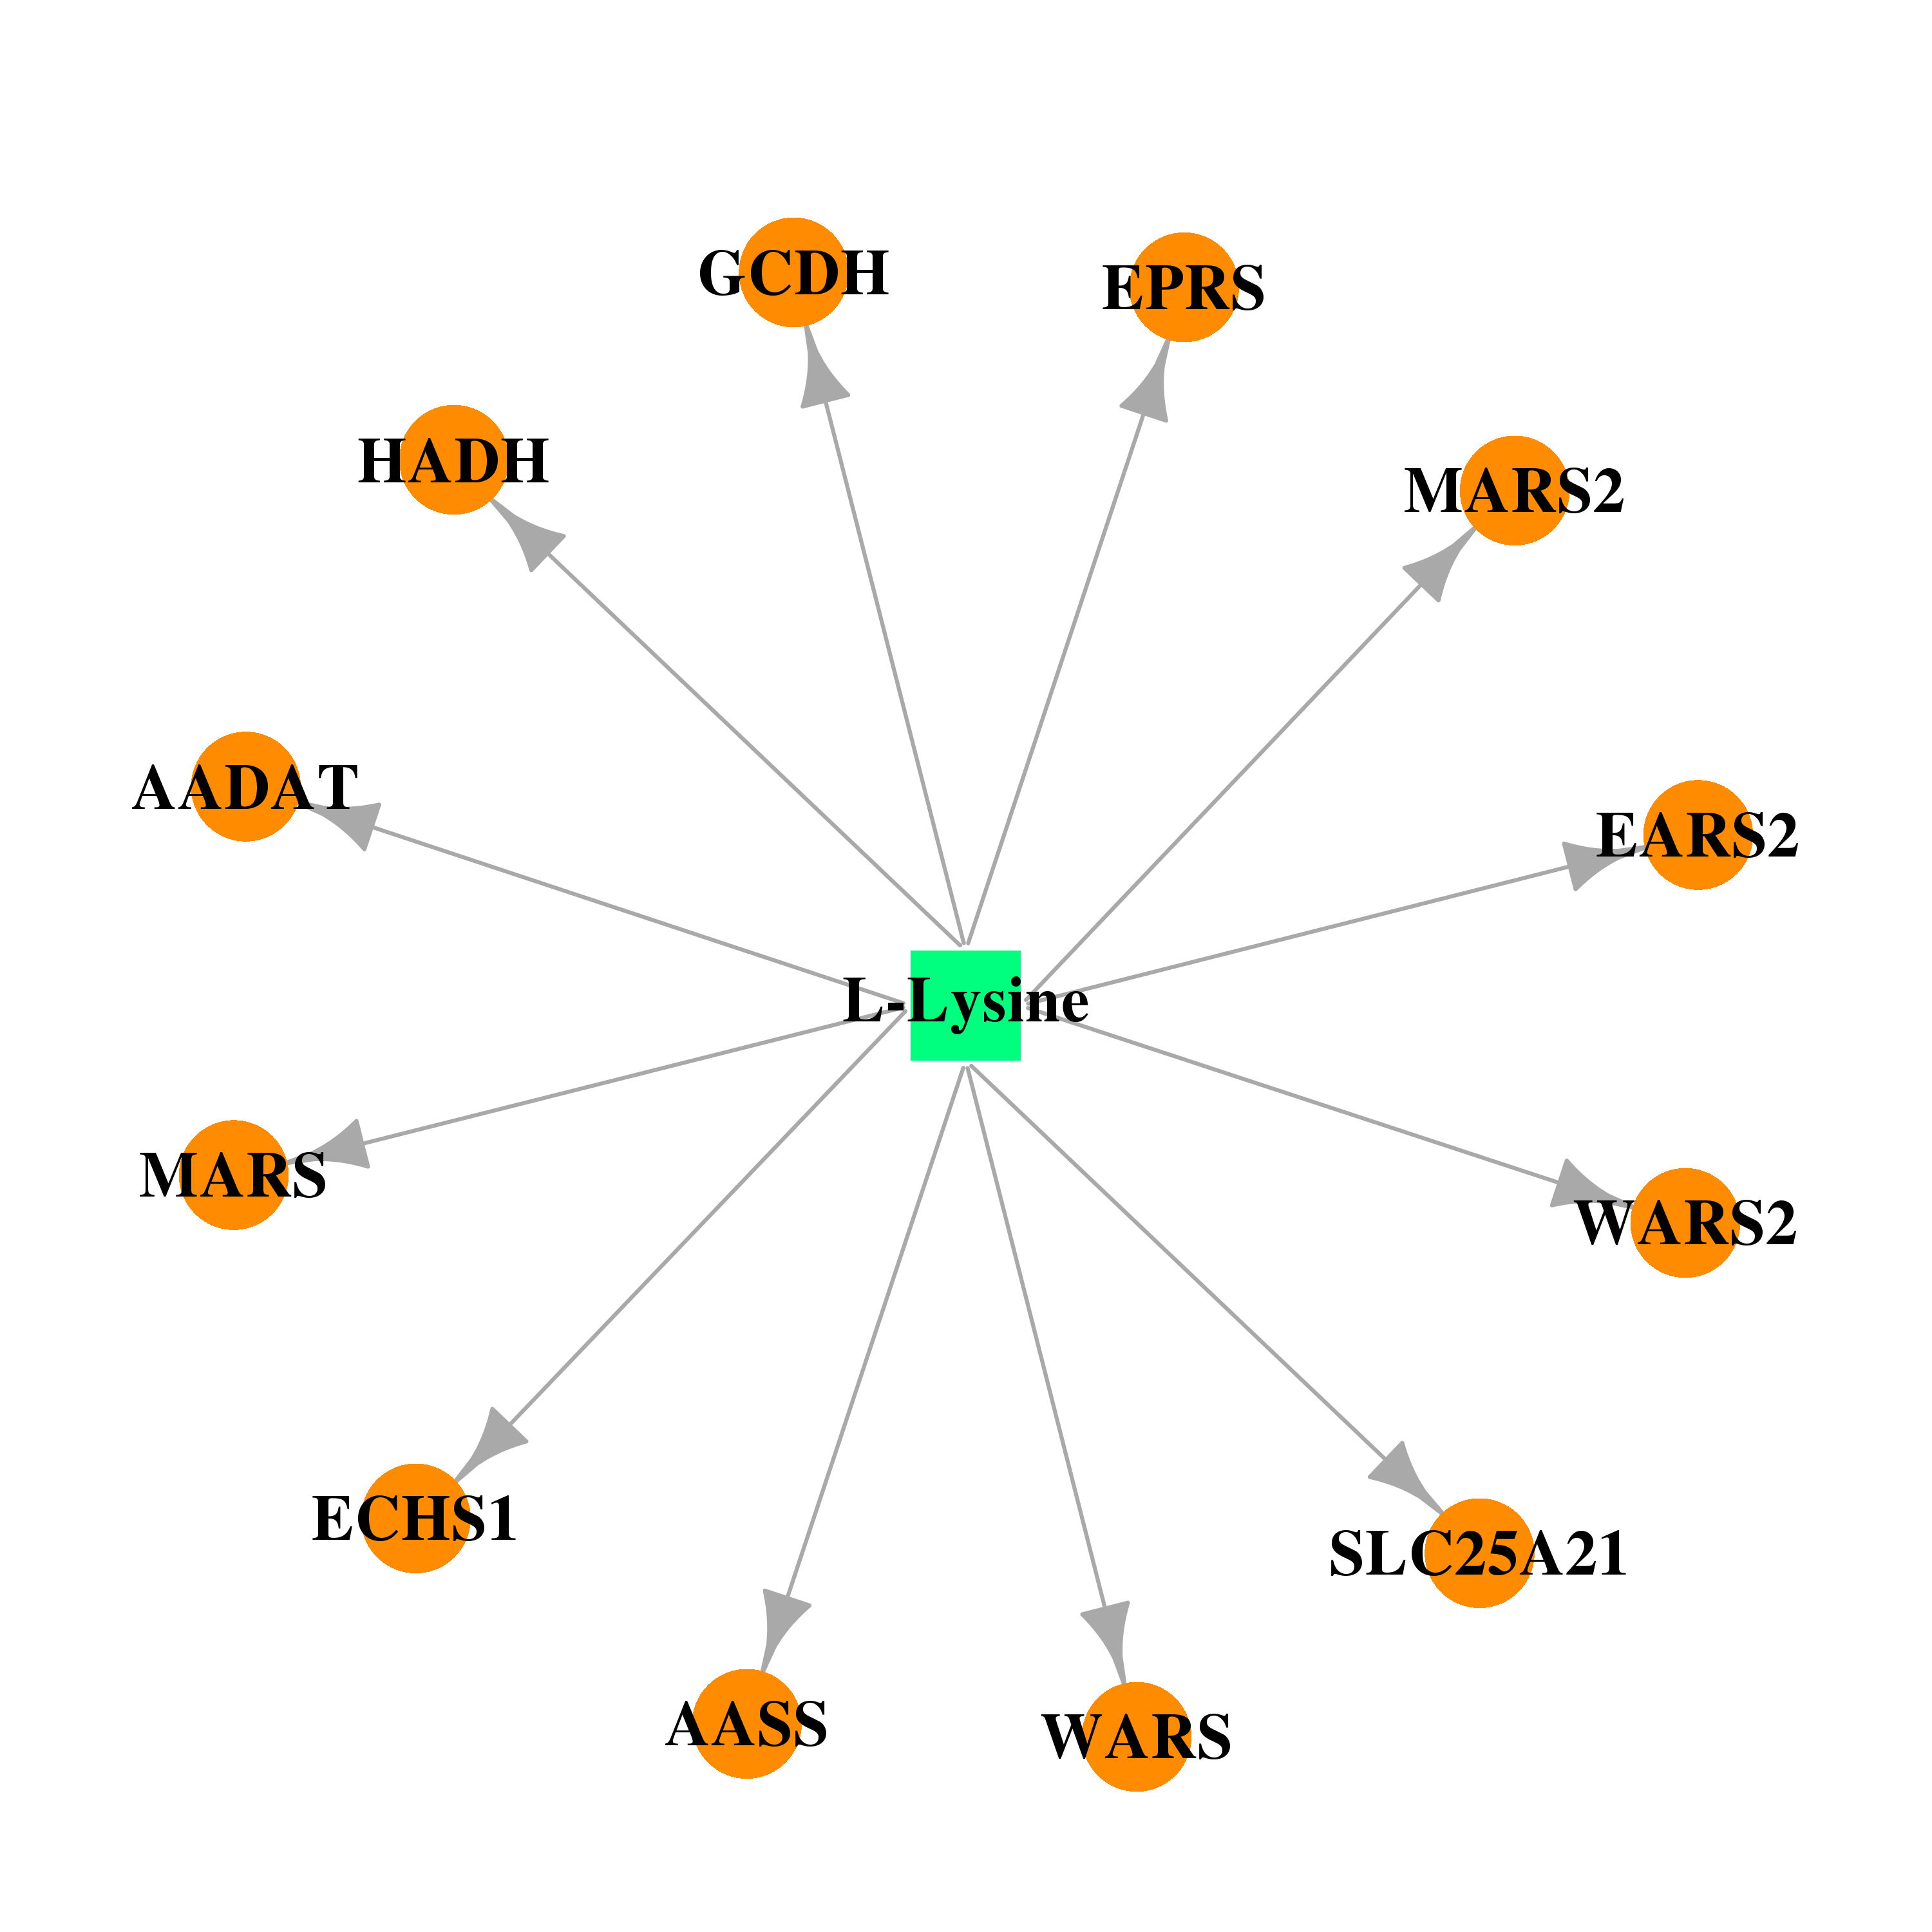 | 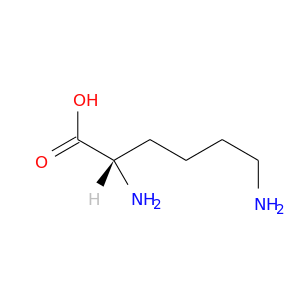 |
| Top |
| Cross referenced IDs for HADH |
| * We obtained these cross-references from Uniprot database. It covers 150 different DBs, 18 categories. http://www.uniprot.org/help/cross_references_section |
: Open all cross reference information
|
Copyright © 2016-Present - The Univsersity of Texas Health Science Center at Houston @ |