|
||||||||||||||||||||||||||||||||||||||||||||||||||||||||||||||||||||||||||||||||||||||||||||||||||||||||||||||||||||||||||||||||||||||||||||||||||||||||||||||||||||||||||||||||||||||||||||||||||||||||||||||||||||||||||||||||||||||||||||||||||||||||||||||||||||||||||||||||||||||||||||||||||||||||||||||||||||||||||
| |
| Phenotypic Information (metabolism pathway, cancer, disease, phenome) |
| |
| |
| Gene-Gene Network Information: Co-Expression Network, Interacting Genes & KEGG |
| |
|


| Gene Summary for ST8SIA6 |
| Basic gene info. | Gene symbol | ST8SIA6 |
| Gene name | ST8 alpha-N-acetyl-neuraminide alpha-2,8-sialyltransferase 6 | |
| Synonyms | SIA8F|SIAT8F|ST8SIA-VI | |
| Cytomap | UCSC genome browser: 10p12.33 | |
| Genomic location | chr10 :17362675-17496254 | |
| Type of gene | protein-coding | |
| RefGenes | NM_001004470.1, | |
| Ensembl id | ENSG00000148488 | |
| Description | SIAT8-FST8SiaVIalpha-2,8-sialyltransferase 8Falpha-2,8-sialyltransferase 8F variant 2alpha-2,8-sialyltransferase 8F variant 3sialyltransferase 8F (alpha-2, 8-sialyltransferase)sialyltransferase St8Sia VIsialytransferase St8Sia VI | |
| Modification date | 20141207 | |
| dbXrefs | MIM : 610139 | |
| HGNC : HGNC | ||
| HPRD : 15344 | ||
| Protein | UniProt: go to UniProt's Cross Reference DB Table | |
| Expression | CleanEX: HS_ST8SIA6 | |
| BioGPS: 338596 | ||
| Gene Expression Atlas: ENSG00000148488 | ||
| The Human Protein Atlas: ENSG00000148488 | ||
| Pathway | NCI Pathway Interaction Database: ST8SIA6 | |
| KEGG: ST8SIA6 | ||
| REACTOME: ST8SIA6 | ||
| ConsensusPathDB | ||
| Pathway Commons: ST8SIA6 | ||
| Metabolism | MetaCyc: ST8SIA6 | |
| HUMANCyc: ST8SIA6 | ||
| Regulation | Ensembl's Regulation: ENSG00000148488 | |
| miRBase: chr10 :17,362,675-17,496,254 | ||
| TargetScan: NM_001004470 | ||
| cisRED: ENSG00000148488 | ||
| Context | iHOP: ST8SIA6 | |
| cancer metabolism search in PubMed: ST8SIA6 | ||
| UCL Cancer Institute: ST8SIA6 | ||
| Assigned class in ccmGDB | C | |
| Top |
| Phenotypic Information for ST8SIA6(metabolism pathway, cancer, disease, phenome) |
| Cancer | CGAP: ST8SIA6 |
| Familial Cancer Database: ST8SIA6 | |
| * This gene is included in those cancer gene databases. |
|
|
|
|
|
| . | ||||||||||||||||||||||||||||||||||||||||||||||||||||||||||||||||||||||||||||||||||||||||||||||||||||||||||||||||||||||||||||||||||||||||||||||||||||||||||||||||||||||||||||||||||||||||||||||||||||||||||||||||||||||||||||||||||||||||||||||||||||||||||||||||||||||||||||||||||||||||||||||||||||||||||||||||||||
Oncogene 1 | Significant driver gene in | |||||||||||||||||||||||||||||||||||||||||||||||||||||||||||||||||||||||||||||||||||||||||||||||||||||||||||||||||||||||||||||||||||||||||||||||||||||||||||||||||||||||||||||||||||||||||||||||||||||||||||||||||||||||||||||||||||||||||||||||||||||||||||||||||||||||||||||||||||||||||||||||||||||||||||||||||||||||||
| cf) number; DB name 1 Oncogene; http://nar.oxfordjournals.org/content/35/suppl_1/D721.long, 2 Tumor Suppressor gene; https://bioinfo.uth.edu/TSGene/, 3 Cancer Gene Census; http://www.nature.com/nrc/journal/v4/n3/abs/nrc1299.html, 4 CancerGenes; http://nar.oxfordjournals.org/content/35/suppl_1/D721.long, 5 Network of Cancer Gene; http://ncg.kcl.ac.uk/index.php, 1Therapeutic Vulnerabilities in Cancer; http://cbio.mskcc.org/cancergenomics/statius/ |
| REACTOME_METABOLISM_OF_PROTEINS | |
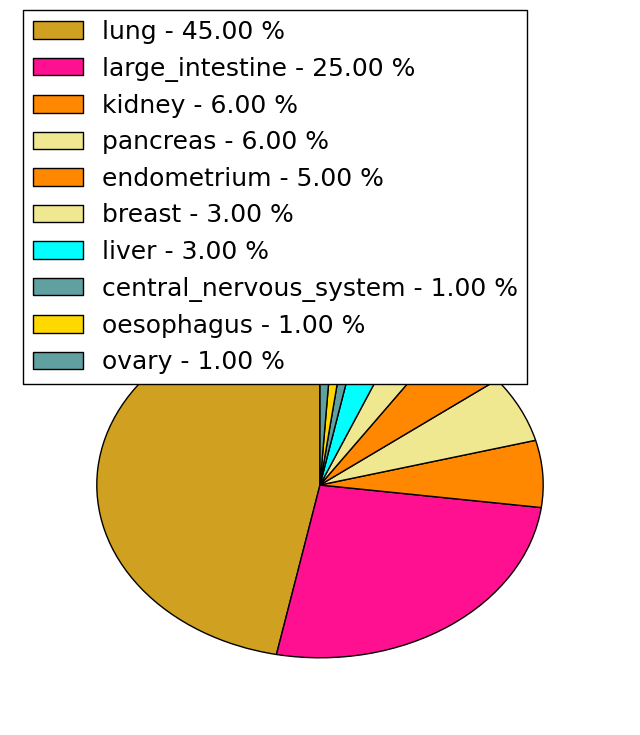
| Mutations for ST8SIA6 |
| * Under tables are showing count per each tissue to give us broad intuition about tissue specific mutation patterns.You can go to the detailed page for each mutation database's web site. |
| - Statistics for Tissue and Mutation type | Top |
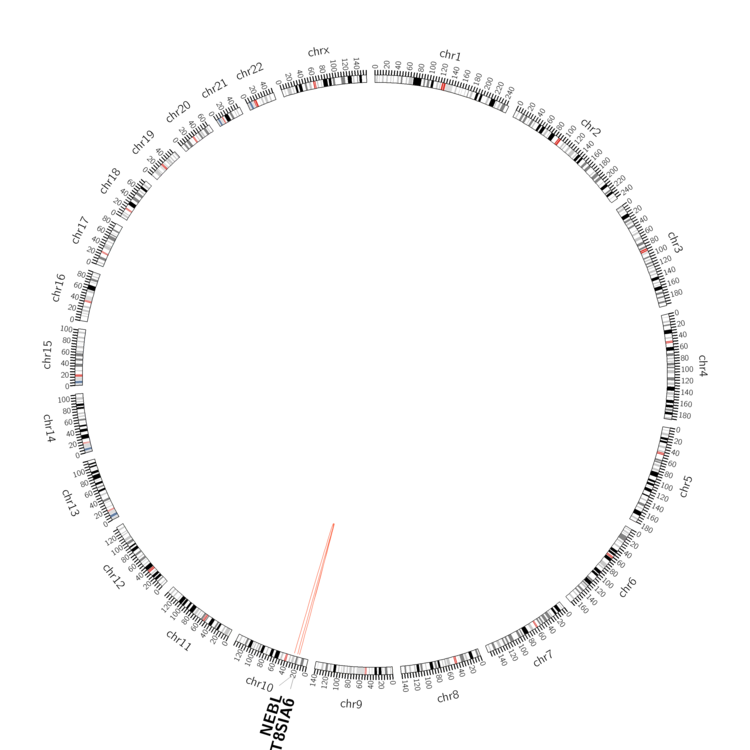 |
| - For Inter-chromosomal Variations |
| There's no inter-chromosomal structural variation. |
| - For Intra-chromosomal Variations |
| * Intra-chromosomal variantions includes 'intrachromosomal amplicon to amplicon', 'intrachromosomal amplicon to non-amplified dna', 'intrachromosomal deletion', 'intrachromosomal fold-back inversion', 'intrachromosomal inversion', 'intrachromosomal tandem duplication', 'Intrachromosomal unknown type', 'intrachromosomal with inverted orientation', 'intrachromosomal with non-inverted orientation'. |
 |
| Sample | Symbol_a | Chr_a | Start_a | End_a | Symbol_b | Chr_b | Start_b | End_b |
| pancreas | ST8SIA6 | chr10 | 17406508 | 17406528 | NEBL | chr10 | 21205588 | 21205608 |
| pancreas | ST8SIA6 | chr10 | 17421016 | 17421036 | chr10 | 27282394 | 27282414 |
| cf) Tissue number; Tissue name (1;Breast, 2;Central_nervous_system, 3;Haematopoietic_and_lymphoid_tissue, 4;Large_intestine, 5;Liver, 6;Lung, 7;Ovary, 8;Pancreas, 9;Prostate, 10;Skin, 11;Soft_tissue, 12;Upper_aerodigestive_tract) |
| * From mRNA Sanger sequences, Chitars2.0 arranged chimeric transcripts. This table shows ST8SIA6 related fusion information. |
| ID | Head Gene | Tail Gene | Accession | Gene_a | qStart_a | qEnd_a | Chromosome_a | tStart_a | tEnd_a | Gene_a | qStart_a | qEnd_a | Chromosome_a | tStart_a | tEnd_a |
| AA780464 | TNFSF9 | 1 | 208 | 19 | 6535868 | 6536075 | ST8SIA6 | 198 | 440 | 10 | 17432093 | 17432338 | |
| AI954707 | ST8SIA6 | 1 | 213 | 10 | 17390237 | 17390449 | ST8SIA6 | 207 | 546 | 10 | 17383988 | 17384327 | |
| Top |
| Mutation type/ Tissue ID | brca | cns | cerv | endome | haematopo | kidn | Lintest | liver | lung | ns | ovary | pancre | prost | skin | stoma | thyro | urina | |||
| Total # sample | 1 | 1 | ||||||||||||||||||
| GAIN (# sample) | 1 | 1 | ||||||||||||||||||
| LOSS (# sample) |
| cf) Tissue ID; Tissue type (1; Breast, 2; Central_nervous_system, 3; Cervix, 4; Endometrium, 5; Haematopoietic_and_lymphoid_tissue, 6; Kidney, 7; Large_intestine, 8; Liver, 9; Lung, 10; NS, 11; Ovary, 12; Pancreas, 13; Prostate, 14; Skin, 15; Stomach, 16; Thyroid, 17; Urinary_tract) |
| Top |
|
 |
| Top |
| Stat. for Non-Synonymous SNVs (# total SNVs=60) | (# total SNVs=25) |
 |  |
(# total SNVs=5) | (# total SNVs=0) |
 |
| Top |
| * When you move the cursor on each content, you can see more deailed mutation information on the Tooltip. Those are primary_site,primary_histology,mutation(aa),pubmedID. |
| GRCh37 position | Mutation(aa) | Unique sampleID count |
| chr10:17363274-17363274 | p.L267P | 4 |
| chr10:17363321-17363321 | p.A252fs*53 | 4 |
| chr10:17369027-17369027 | p.S207S | 4 |
| chr10:17362951-17362951 | p.E375* | 3 |
| chr10:17432598-17432598 | p.S74S | 2 |
| chr10:17363213-17363213 | p.L287L | 2 |
| chr10:17363217-17363217 | p.T286M | 2 |
| chr10:17432535-17432535 | p.T95T | 2 |
| chr10:17363170-17363170 | p.K302* | 2 |
| chr10:17401513-17401513 | p.R126K | 2 |
| Top |
|
 |
| Point Mutation/ Tissue ID | 1 | 2 | 3 | 4 | 5 | 6 | 7 | 8 | 9 | 10 | 11 | 12 | 13 | 14 | 15 | 16 | 17 | 18 | 19 | 20 |
| # sample | 1 | 2 | 11 | 1 | 3 | 2 | 16 | 8 | 1 | 3 | 7 | 7 | ||||||||
| # mutation | 1 | 2 | 10 | 1 | 3 | 2 | 16 | 8 | 1 | 3 | 7 | 7 | ||||||||
| nonsynonymous SNV | 1 | 2 | 8 | 1 | 2 | 1 | 10 | 5 | 1 | 2 | 6 | 3 | ||||||||
| synonymous SNV | 2 | 1 | 1 | 6 | 3 | 1 | 1 | 4 |
| cf) Tissue ID; Tissue type (1; BLCA[Bladder Urothelial Carcinoma], 2; BRCA[Breast invasive carcinoma], 3; CESC[Cervical squamous cell carcinoma and endocervical adenocarcinoma], 4; COAD[Colon adenocarcinoma], 5; GBM[Glioblastoma multiforme], 6; Glioma Low Grade, 7; HNSC[Head and Neck squamous cell carcinoma], 8; KICH[Kidney Chromophobe], 9; KIRC[Kidney renal clear cell carcinoma], 10; KIRP[Kidney renal papillary cell carcinoma], 11; LAML[Acute Myeloid Leukemia], 12; LUAD[Lung adenocarcinoma], 13; LUSC[Lung squamous cell carcinoma], 14; OV[Ovarian serous cystadenocarcinoma ], 15; PAAD[Pancreatic adenocarcinoma], 16; PRAD[Prostate adenocarcinoma], 17; SKCM[Skin Cutaneous Melanoma], 18:STAD[Stomach adenocarcinoma], 19:THCA[Thyroid carcinoma], 20:UCEC[Uterine Corpus Endometrial Carcinoma]) |
| Top |
| * We represented just top 10 SNVs. When you move the cursor on each content, you can see more deailed mutation information on the Tooltip. Those are primary_site, primary_histology, mutation(aa), pubmedID. |
| Genomic Position | Mutation(aa) | Unique sampleID count |
| chr10:17363274 | p.L267P | 4 |
| chr10:17369027 | p.S207S | 2 |
| chr10:17363213 | p.L287L | 2 |
| chr10:17432598 | p.S74S | 2 |
| chr10:17363189 | p.G342R | 1 |
| chr10:17432566 | p.S223I | 1 |
| chr10:17369026 | p.C132S | 1 |
| chr10:17363045 | p.L325L | 1 |
| chr10:17373507 | p.T218T | 1 |
| chr10:17363200 | p.A130S | 1 |
| * Copy number data were extracted from TCGA using R package TCGA-Assembler. The URLs of all public data files on TCGA DCC data server were gathered on Jan-05-2015. Function ProcessCNAData in TCGA-Assembler package was used to obtain gene-level copy number value which is calculated as the average copy number of the genomic region of a gene. |
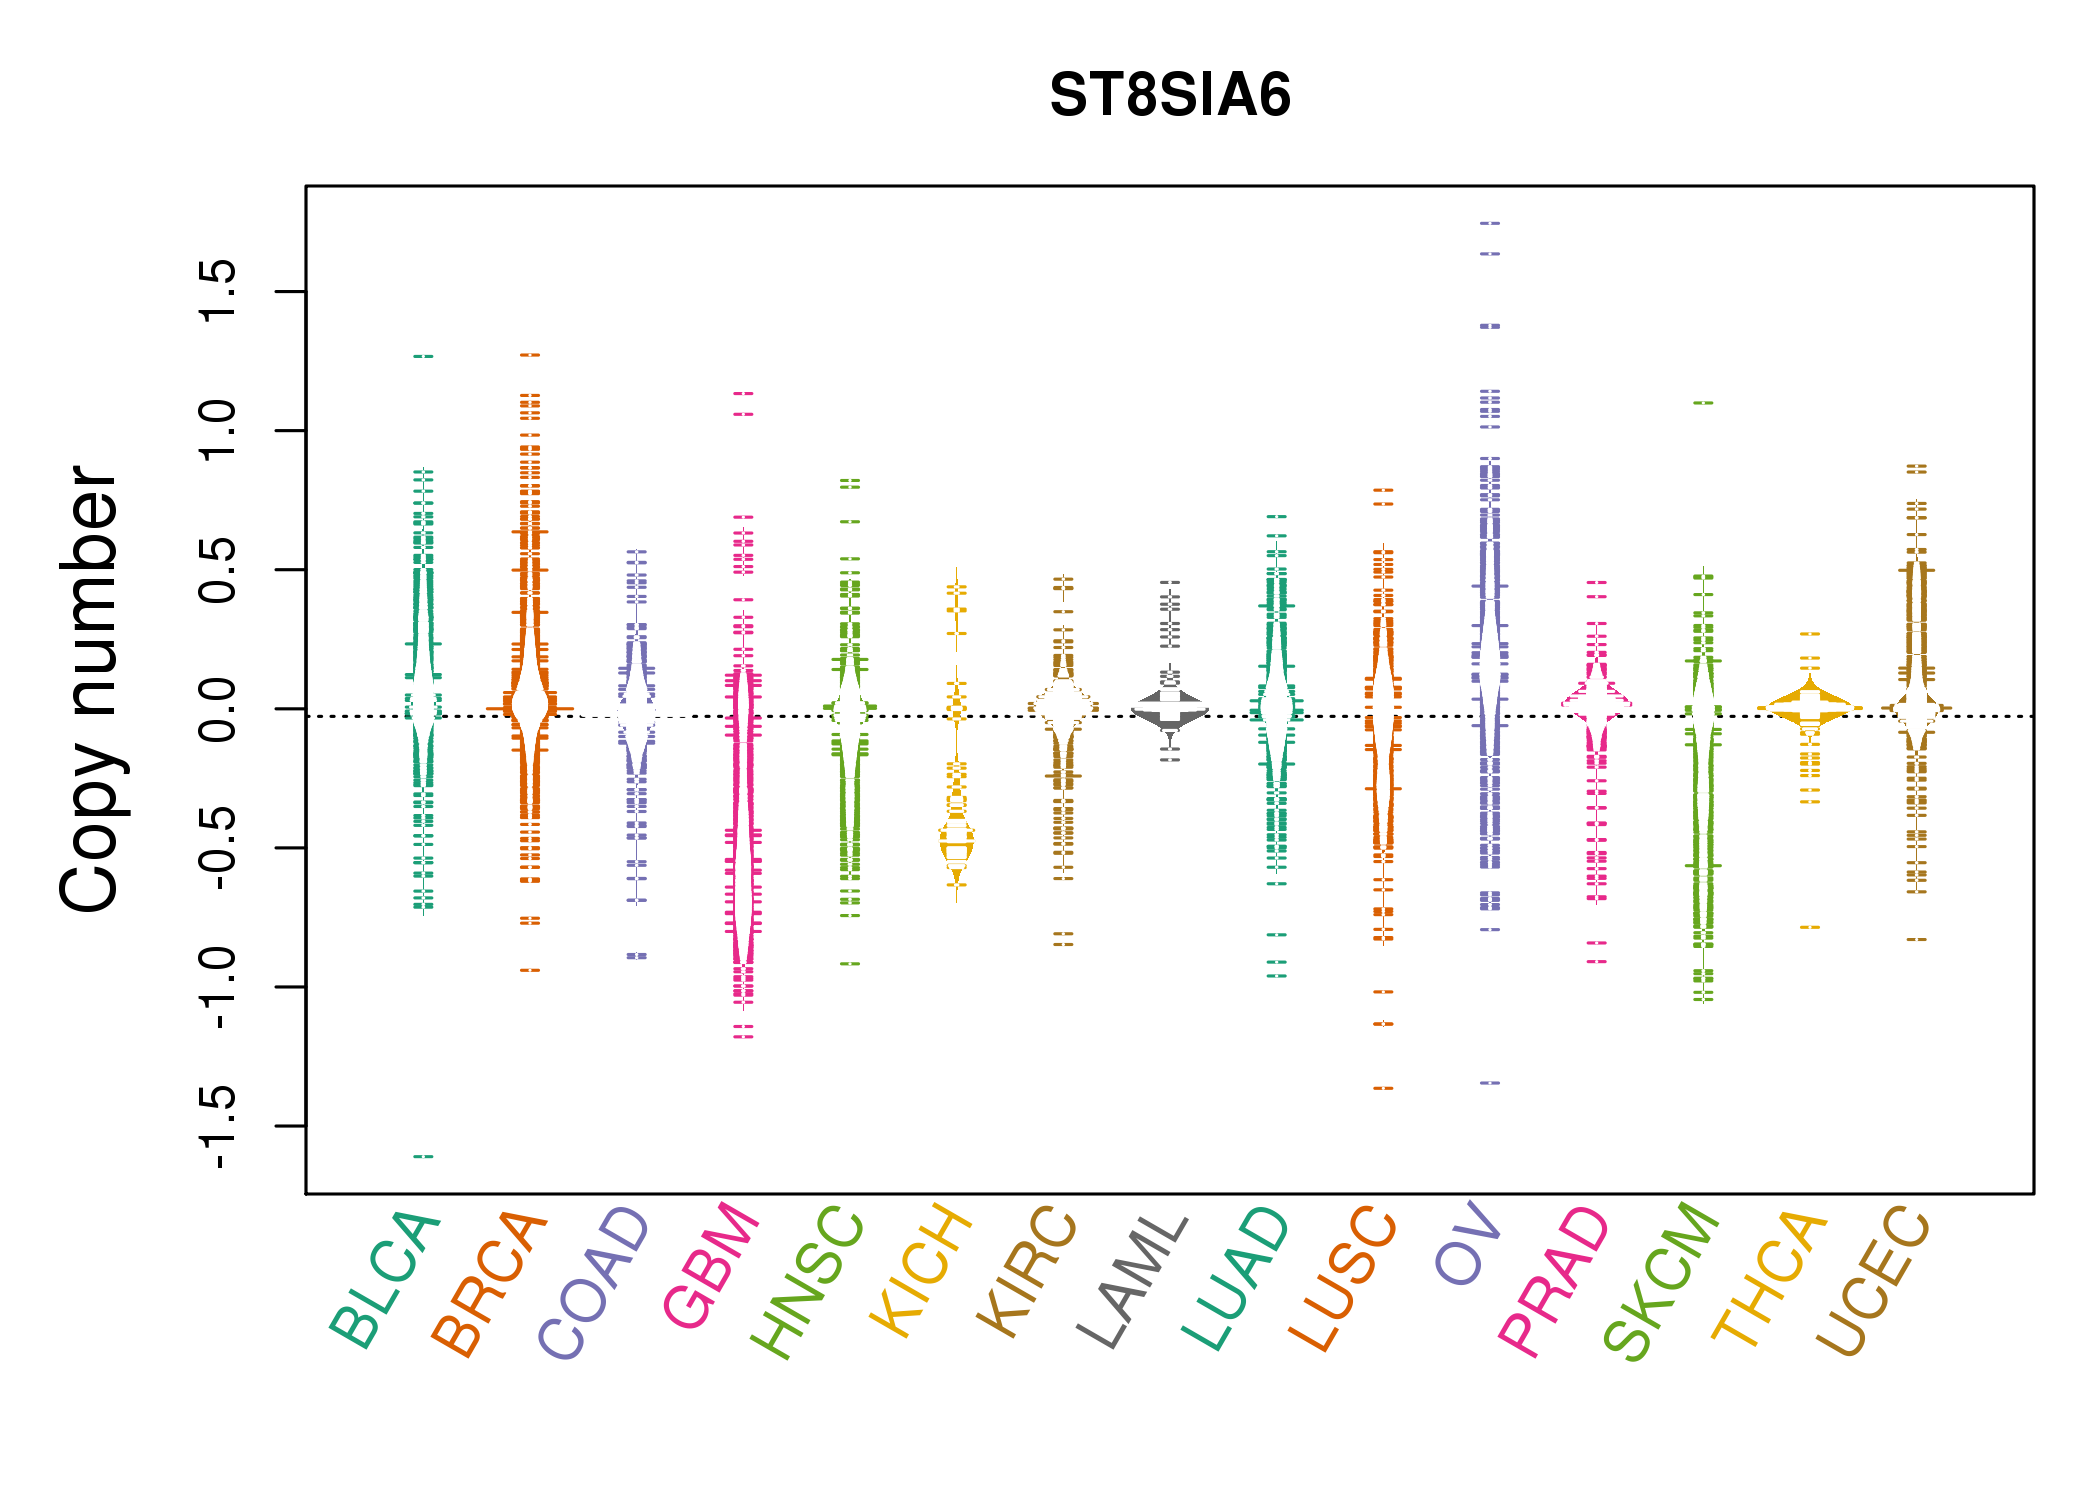 |
| cf) Tissue ID[Tissue type]: BLCA[Bladder Urothelial Carcinoma], BRCA[Breast invasive carcinoma], CESC[Cervical squamous cell carcinoma and endocervical adenocarcinoma], COAD[Colon adenocarcinoma], GBM[Glioblastoma multiforme], Glioma Low Grade, HNSC[Head and Neck squamous cell carcinoma], KICH[Kidney Chromophobe], KIRC[Kidney renal clear cell carcinoma], KIRP[Kidney renal papillary cell carcinoma], LAML[Acute Myeloid Leukemia], LUAD[Lung adenocarcinoma], LUSC[Lung squamous cell carcinoma], OV[Ovarian serous cystadenocarcinoma ], PAAD[Pancreatic adenocarcinoma], PRAD[Prostate adenocarcinoma], SKCM[Skin Cutaneous Melanoma], STAD[Stomach adenocarcinoma], THCA[Thyroid carcinoma], UCEC[Uterine Corpus Endometrial Carcinoma] |
| Top |
| Gene Expression for ST8SIA6 |
| * CCLE gene expression data were extracted from CCLE_Expression_Entrez_2012-10-18.res: Gene-centric RMA-normalized mRNA expression data. |
 |
| * Normalized gene expression data of RNASeqV2 was extracted from TCGA using R package TCGA-Assembler. The URLs of all public data files on TCGA DCC data server were gathered at Jan-05-2015. Only eight cancer types have enough normal control samples for differential expression analysis. (t test, adjusted p<0.05 (using Benjamini-Hochberg FDR)) |
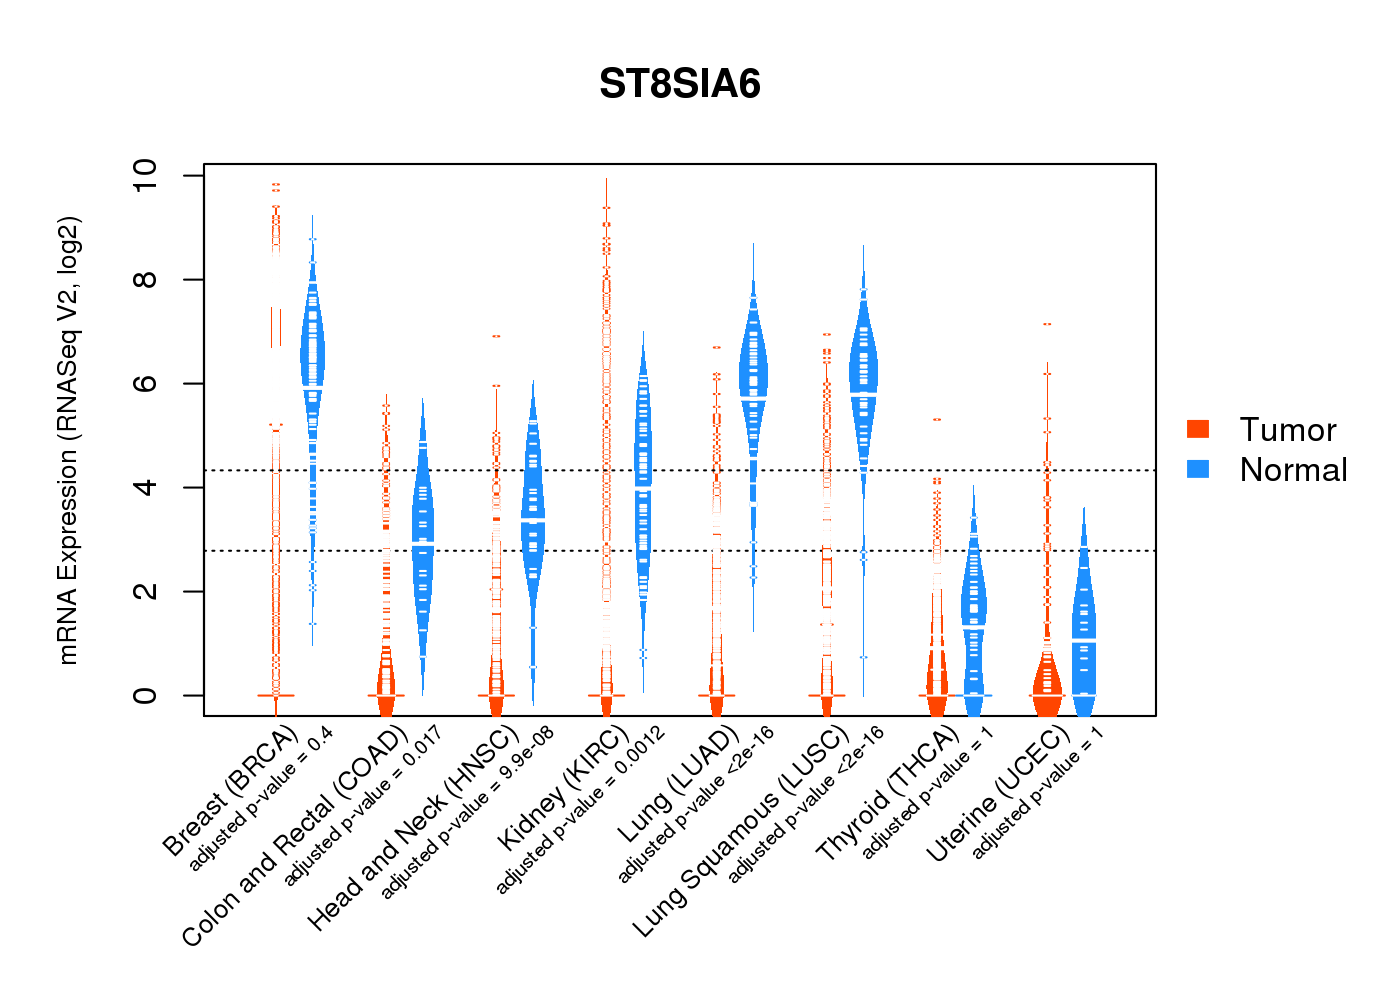 |
| Top |
| * This plots show the correlation between CNV and gene expression. |
: Open all plots for all cancer types
 |
|
 |
|


| Top |
| Gene-Gene Network Information |
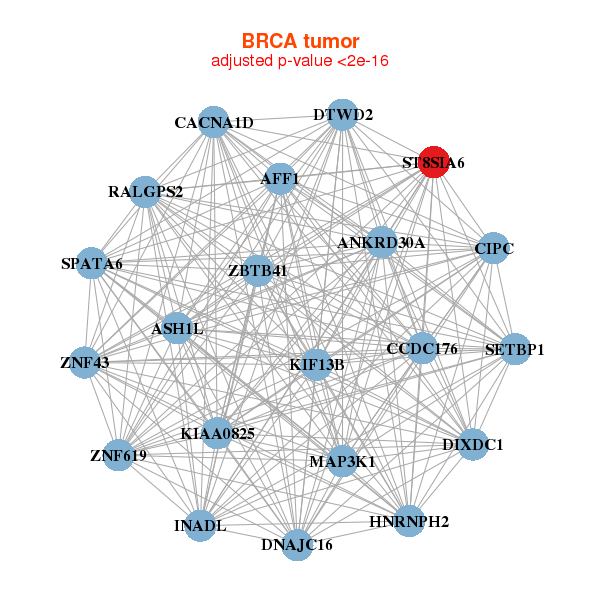
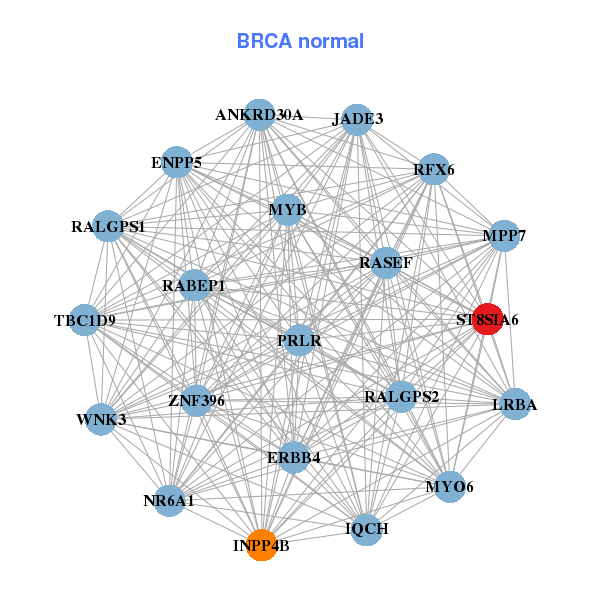
| * Co-Expression network figures were drawn using R package igraph. Only the top 20 genes with the highest correlations were shown. Red circle: input gene, orange circle: cell metabolism gene, sky circle: other gene |
: Open all plots for all cancer types
 |
|
| AFF1,ANKRD30A,ASH1L,CCDC176,KIAA0825,CACNA1D,DIXDC1, DNAJC16,DTWD2,HNRNPH2,INADL,CIPC,KIF13B,MAP3K1, RALGPS2,SETBP1,SPATA6,ST8SIA6,ZBTB41,ZNF43,ZNF619 | ANKRD30A,ENPP5,ERBB4,INPP4B,IQCH,LRBA,MPP7, MYB,MYO6,NR6A1,JADE3,PRLR,RABEP1,RALGPS1, RALGPS2,RASEF,RFX6,ST8SIA6,TBC1D9,WNK3,ZNF396 |
 |
|
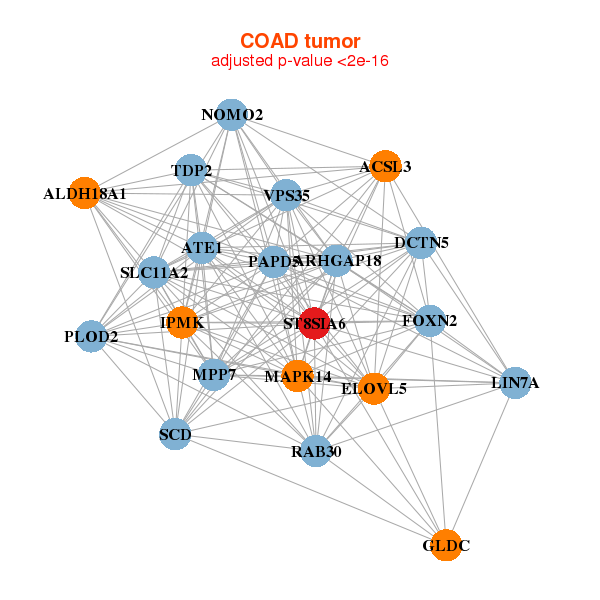
| ACSL3,ALDH18A1,ARHGAP18,ATE1,DCTN5,ELOVL5,FOXN2, GLDC,IPMK,LIN7A,MAPK14,MPP7,NOMO2,PAPD5, PLOD2,RAB30,SCD,SLC11A2,ST8SIA6,TDP2,VPS35 | ALDOA,ARF3,BTBD3,CEACAM7,FAM120AOS,FUT3,GRAMD3, HIST1H2BD,IFNGR2,LCMT1,LITAF,LRP4,MFSD5,NETO2, OPN3,PEX26,PGM1,PLOD2,SLC16A3,ST8SIA6,TMEM171 |
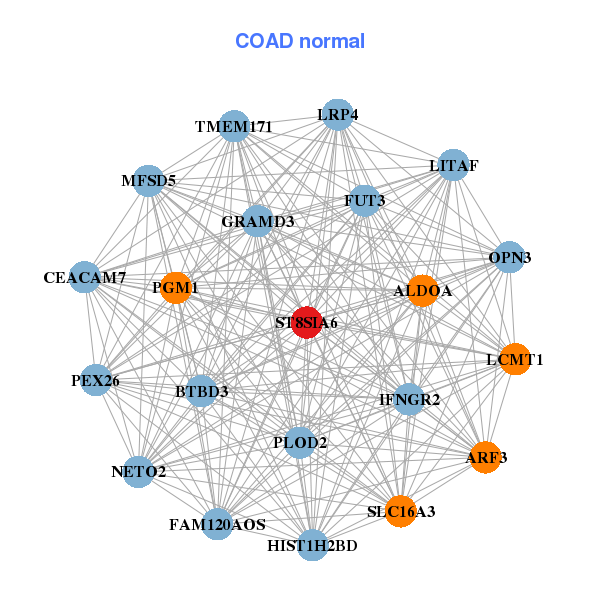
| * Co-Expression network figures were drawn using R package igraph. Only the top 20 genes with the highest correlations were shown. Red circle: input gene, orange circle: cell metabolism gene, sky circle: other gene |
: Open all plots for all cancer types
| Top |
: Open all interacting genes' information including KEGG pathway for all interacting genes from DAVID
| Top |
| Pharmacological Information for ST8SIA6 |
| There's no related Drug. |
| Top |
| Cross referenced IDs for ST8SIA6 |
| * We obtained these cross-references from Uniprot database. It covers 150 different DBs, 18 categories. http://www.uniprot.org/help/cross_references_section |
: Open all cross reference information
|
Copyright © 2016-Present - The Univsersity of Texas Health Science Center at Houston @ |