|
|||||||||||||||||||||||||||||||||||||||||||||||||||||||||||||||||||||||||||||||||||||||||||||||||||||||||||||||||||||||||||||||||||||||||||||||||||||||||||||||||||||||||||||||||||||||||||||||||||||||||||||||||||||||||||||||||||||||||||||||||||||||||||||||||||||||||||||||||||||||||||||||||||||||||||||||||||||||||||||||||||||||||||||
| |
| Phenotypic Information (metabolism pathway, cancer, disease, phenome) |
| |
| |
| Gene-Gene Network Information: Co-Expression Network, Interacting Genes & KEGG |
| |
|


| Gene Summary for PDE1C |
| Top |
| Phenotypic Information for PDE1C(metabolism pathway, cancer, disease, phenome) |
| Cancer | CGAP: PDE1C |
| Familial Cancer Database: PDE1C | |
| * This gene is included in those cancer gene databases. |
|
|
|
|
|
| . | |||||||||||||||||||||||||||||||||||||||||||||||||||||||||||||||||||||||||||||||||||||||||||||||||||||||||||||||||||||||||||||||||||||||||||||||||||||||||||||||||||||||||||||||||||||||||||||||||||||||||||||||||||||||||||||||||||||||||||||||||||||||||||||||||||||||||||||||||||||||||||||||||||||||||||||||||||||||||||||||||||||||
Oncogene 1 | Significant driver gene in | ||||||||||||||||||||||||||||||||||||||||||||||||||||||||||||||||||||||||||||||||||||||||||||||||||||||||||||||||||||||||||||||||||||||||||||||||||||||||||||||||||||||||||||||||||||||||||||||||||||||||||||||||||||||||||||||||||||||||||||||||||||||||||||||||||||||||||||||||||||||||||||||||||||||||||||||||||||||||||||||||||||||||||||
| cf) number; DB name 1 Oncogene; http://nar.oxfordjournals.org/content/35/suppl_1/D721.long, 2 Tumor Suppressor gene; https://bioinfo.uth.edu/TSGene/, 3 Cancer Gene Census; http://www.nature.com/nrc/journal/v4/n3/abs/nrc1299.html, 4 CancerGenes; http://nar.oxfordjournals.org/content/35/suppl_1/D721.long, 5 Network of Cancer Gene; http://ncg.kcl.ac.uk/index.php, 1Therapeutic Vulnerabilities in Cancer; http://cbio.mskcc.org/cancergenomics/statius/ |
| KEGG_PURINE_METABOLISM | |
| OMIM | |
| Orphanet | |
| Disease | KEGG Disease: PDE1C |
| MedGen: PDE1C (Human Medical Genetics with Condition) | |
| ClinVar: PDE1C | |
| Phenotype | MGI: PDE1C (International Mouse Phenotyping Consortium) |
| PhenomicDB: PDE1C | |
| Mutations for PDE1C |
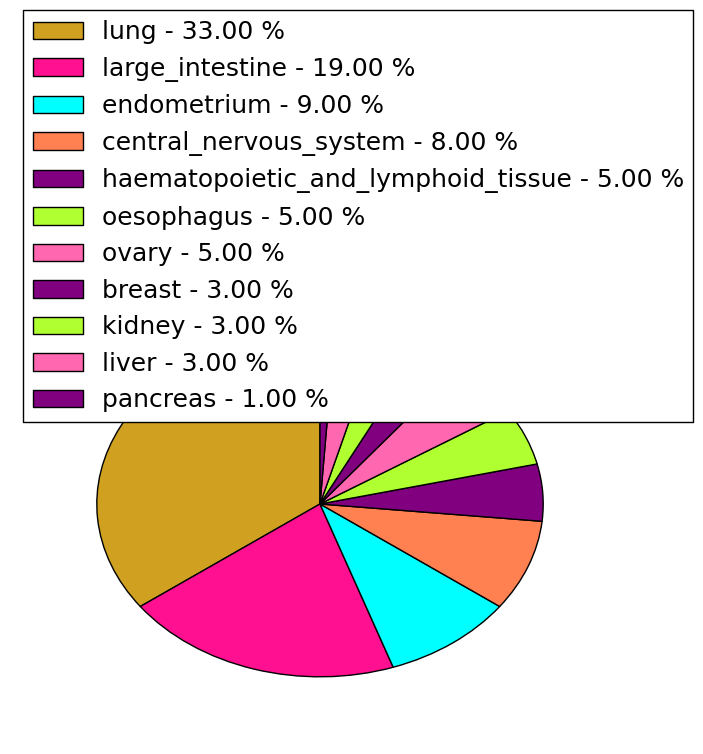
| * Under tables are showing count per each tissue to give us broad intuition about tissue specific mutation patterns.You can go to the detailed page for each mutation database's web site. |
| - Statistics for Tissue and Mutation type | Top |
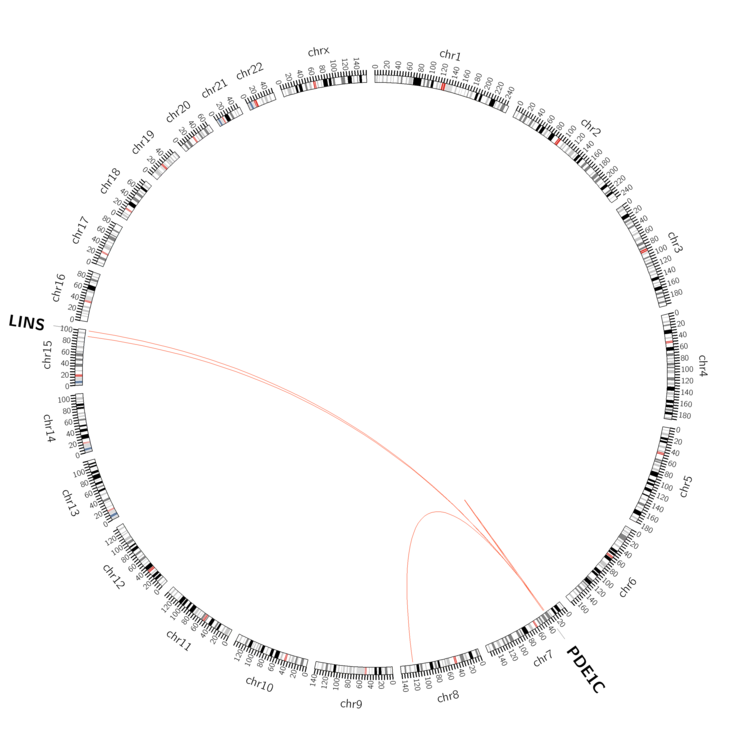 |
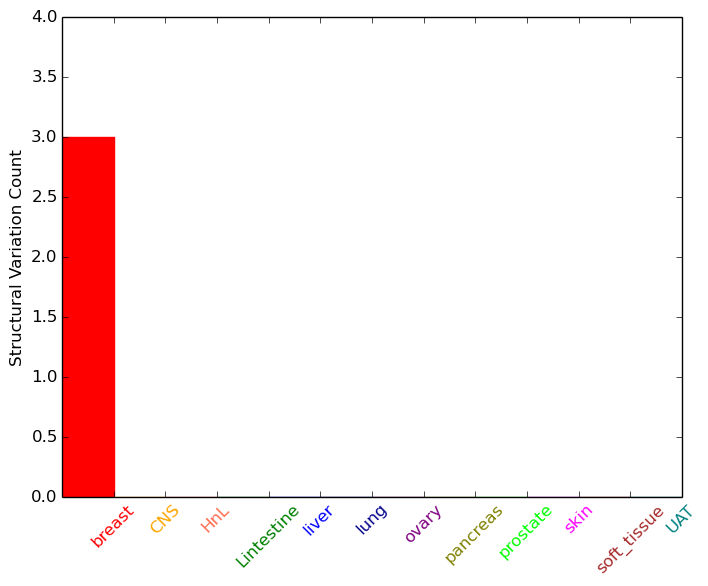
| - For Inter-chromosomal Variations |
| * Inter-chromosomal variantions includes 'interchromosomal amplicon to amplicon', 'interchromosomal amplicon to non-amplified dna', 'interchromosomal insertion', 'Interchromosomal unknown type'. |
 |
| - For Intra-chromosomal Variations |
| * Intra-chromosomal variantions includes 'intrachromosomal amplicon to amplicon', 'intrachromosomal amplicon to non-amplified dna', 'intrachromosomal deletion', 'intrachromosomal fold-back inversion', 'intrachromosomal inversion', 'intrachromosomal tandem duplication', 'Intrachromosomal unknown type', 'intrachromosomal with inverted orientation', 'intrachromosomal with non-inverted orientation'. |
 |
| Sample | Symbol_a | Chr_a | Start_a | End_a | Symbol_b | Chr_b | Start_b | End_b |
| breast | PDE1C | chr7 | 31818064 | 31818064 | LINS | chr15 | 101125974 | 101125974 |
| breast | PDE1C | chr7 | 31965409 | 31965409 | chr7 | 33676607 | 33676607 | |
| breast | PDE1C | chr7 | 31966608 | 31966608 | chr15 | 90665564 | 90665564 | |
| breast | PDE1C | chr7 | 31983559 | 31983559 | chr8 | 123026791 | 123026791 | |
| ovary | PDE1C | chr7 | 31963758 | 31963778 | PDE1C | chr7 | 31961897 | 31961917 |
| ovary | PDE1C | chr7 | 32046598 | 32046618 | PDE1C | chr7 | 32046664 | 32046684 |
| cf) Tissue number; Tissue name (1;Breast, 2;Central_nervous_system, 3;Haematopoietic_and_lymphoid_tissue, 4;Large_intestine, 5;Liver, 6;Lung, 7;Ovary, 8;Pancreas, 9;Prostate, 10;Skin, 11;Soft_tissue, 12;Upper_aerodigestive_tract) |
| * From mRNA Sanger sequences, Chitars2.0 arranged chimeric transcripts. This table shows PDE1C related fusion information. |
| ID | Head Gene | Tail Gene | Accession | Gene_a | qStart_a | qEnd_a | Chromosome_a | tStart_a | tEnd_a | Gene_a | qStart_a | qEnd_a | Chromosome_a | tStart_a | tEnd_a |
| H11830 | SETX | 1 | 348 | 9 | 135145001 | 135150759 | PDE1C | 336 | 358 | 7 | 32108935 | 32108957 | |
| AV724221 | PDE1C | 1 | 425 | 7 | 32088724 | 32089152 | LAT2 | 421 | 604 | 7 | 73643778 | 73643964 | |
| AA247844 | PDE1C | 1 | 201 | 7 | 31825611 | 31825812 | PDE1C | 196 | 255 | 7 | 31829557 | 31829617 | |
| Top |
| Mutation type/ Tissue ID | brca | cns | cerv | endome | haematopo | kidn | Lintest | liver | lung | ns | ovary | pancre | prost | skin | stoma | thyro | urina | |||
| Total # sample | 2 | 2 | 1 | 3 | 7 | 1 | 1 | 1 | 1 | 5 | ||||||||||
| GAIN (# sample) | 1 | 2 | 1 | 3 | 6 | 1 | 1 | 1 | 1 | 5 | ||||||||||
| LOSS (# sample) | 1 | 1 |
| cf) Tissue ID; Tissue type (1; Breast, 2; Central_nervous_system, 3; Cervix, 4; Endometrium, 5; Haematopoietic_and_lymphoid_tissue, 6; Kidney, 7; Large_intestine, 8; Liver, 9; Lung, 10; NS, 11; Ovary, 12; Pancreas, 13; Prostate, 14; Skin, 15; Stomach, 16; Thyroid, 17; Urinary_tract) |
| Top |
|
 |
| Top |
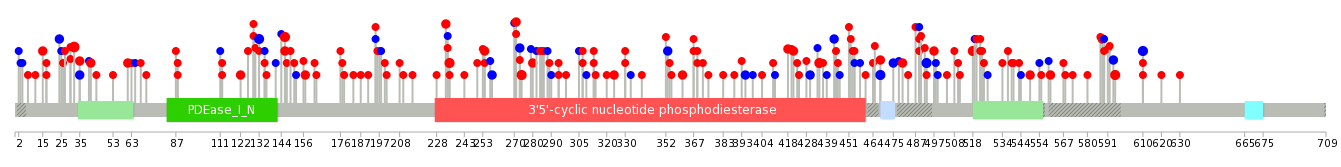
| Stat. for Non-Synonymous SNVs (# total SNVs=133) | (# total SNVs=34) |
 |  |
(# total SNVs=0) | (# total SNVs=1) |
 |
| Top |
| * When you move the cursor on each content, you can see more deailed mutation information on the Tooltip. Those are primary_site,primary_histology,mutation(aa),pubmedID. |
| GRCh37 position | Mutation(aa) | Unique sampleID count |
| chr7:31904603-31904603 | p.D235N | 4 |
| chr7:31890295-31890295 | p.E271Q | 4 |
| chr7:32109912-32109912 | p.R32C | 4 |
| chr7:31918727-31918727 | p.R103* | 4 |
| chr7:31864483-31864483 | p.S468S | 3 |
| chr7:31862716-31862716 | p.R518Q | 3 |
| chr7:31855568-31855568 | p.E595K | 3 |
| chr7:31890286-31890286 | p.G274R | 3 |
| chr7:31864484-31864484 | p.S468L | 3 |
| chr7:31917638-31917638 | p.R146Q | 3 |
| Top |
|
 |
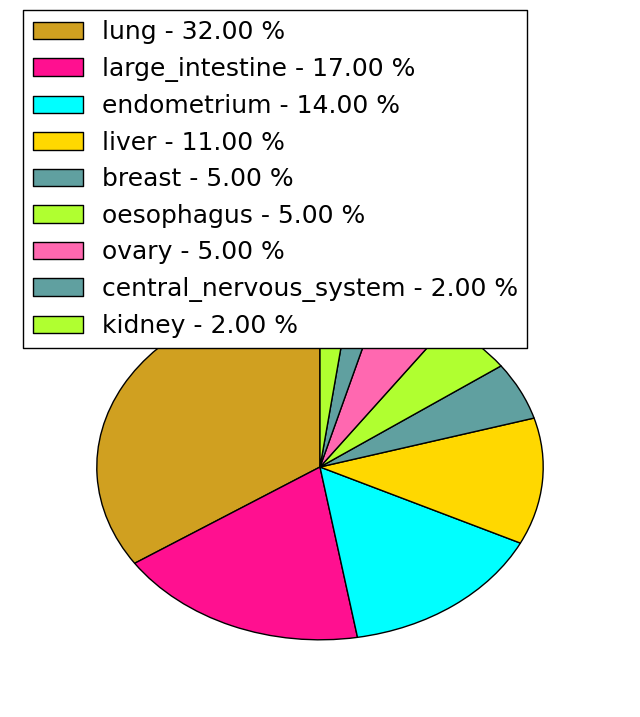
| Point Mutation/ Tissue ID | 1 | 2 | 3 | 4 | 5 | 6 | 7 | 8 | 9 | 10 | 11 | 12 | 13 | 14 | 15 | 16 | 17 | 18 | 19 | 20 |
| # sample | 4 | 3 | 1 | 17 | 4 | 9 | 1 | 1 | 26 | 13 | 4 | 1 | 2 | 47 | 11 | 14 | ||||
| # mutation | 4 | 3 | 1 | 17 | 4 | 9 | 1 | 1 | 30 | 15 | 4 | 1 | 2 | 63 | 11 | 16 | ||||
| nonsynonymous SNV | 3 | 2 | 1 | 14 | 4 | 7 | 1 | 18 | 12 | 4 | 1 | 42 | 5 | 10 | ||||||
| synonymous SNV | 1 | 1 | 3 | 2 | 1 | 12 | 3 | 1 | 1 | 21 | 6 | 6 |
| cf) Tissue ID; Tissue type (1; BLCA[Bladder Urothelial Carcinoma], 2; BRCA[Breast invasive carcinoma], 3; CESC[Cervical squamous cell carcinoma and endocervical adenocarcinoma], 4; COAD[Colon adenocarcinoma], 5; GBM[Glioblastoma multiforme], 6; Glioma Low Grade, 7; HNSC[Head and Neck squamous cell carcinoma], 8; KICH[Kidney Chromophobe], 9; KIRC[Kidney renal clear cell carcinoma], 10; KIRP[Kidney renal papillary cell carcinoma], 11; LAML[Acute Myeloid Leukemia], 12; LUAD[Lung adenocarcinoma], 13; LUSC[Lung squamous cell carcinoma], 14; OV[Ovarian serous cystadenocarcinoma ], 15; PAAD[Pancreatic adenocarcinoma], 16; PRAD[Prostate adenocarcinoma], 17; SKCM[Skin Cutaneous Melanoma], 18:STAD[Stomach adenocarcinoma], 19:THCA[Thyroid carcinoma], 20:UCEC[Uterine Corpus Endometrial Carcinoma]) |
| Top |
| * We represented just top 10 SNVs. When you move the cursor on each content, you can see more deailed mutation information on the Tooltip. Those are primary_site, primary_histology, mutation(aa), pubmedID. |
| Genomic Position | Mutation(aa) | Unique sampleID count |
| chr7:31855568 | p.P493P,PDE1C | 3 |
| chr7:31864484 | p.E595K,PDE1C | 3 |
| chr7:31862790 | p.S468W,PDE1C | 3 |
| chr7:31855724 | p.T254M,PDE1C | 2 |
| chr7:31890345 | p.R46Q | 2 |
| chr7:31862779 | p.S497Y,PDE1C | 2 |
| chr7:32109934 | p.D235N,PDE1C | 2 |
| chr7:31904603 | p.R146Q,PDE1C | 2 |
| chr7:31855612 | p.A543T,PDE1C | 2 |
| chr7:32209516 | p.A361V,PDE1C | 2 |
| * Copy number data were extracted from TCGA using R package TCGA-Assembler. The URLs of all public data files on TCGA DCC data server were gathered on Jan-05-2015. Function ProcessCNAData in TCGA-Assembler package was used to obtain gene-level copy number value which is calculated as the average copy number of the genomic region of a gene. |
 |
| cf) Tissue ID[Tissue type]: BLCA[Bladder Urothelial Carcinoma], BRCA[Breast invasive carcinoma], CESC[Cervical squamous cell carcinoma and endocervical adenocarcinoma], COAD[Colon adenocarcinoma], GBM[Glioblastoma multiforme], Glioma Low Grade, HNSC[Head and Neck squamous cell carcinoma], KICH[Kidney Chromophobe], KIRC[Kidney renal clear cell carcinoma], KIRP[Kidney renal papillary cell carcinoma], LAML[Acute Myeloid Leukemia], LUAD[Lung adenocarcinoma], LUSC[Lung squamous cell carcinoma], OV[Ovarian serous cystadenocarcinoma ], PAAD[Pancreatic adenocarcinoma], PRAD[Prostate adenocarcinoma], SKCM[Skin Cutaneous Melanoma], STAD[Stomach adenocarcinoma], THCA[Thyroid carcinoma], UCEC[Uterine Corpus Endometrial Carcinoma] |
| Top |
| Gene Expression for PDE1C |
| * CCLE gene expression data were extracted from CCLE_Expression_Entrez_2012-10-18.res: Gene-centric RMA-normalized mRNA expression data. |
 |
| * Normalized gene expression data of RNASeqV2 was extracted from TCGA using R package TCGA-Assembler. The URLs of all public data files on TCGA DCC data server were gathered at Jan-05-2015. Only eight cancer types have enough normal control samples for differential expression analysis. (t test, adjusted p<0.05 (using Benjamini-Hochberg FDR)) |
 |
| Top |
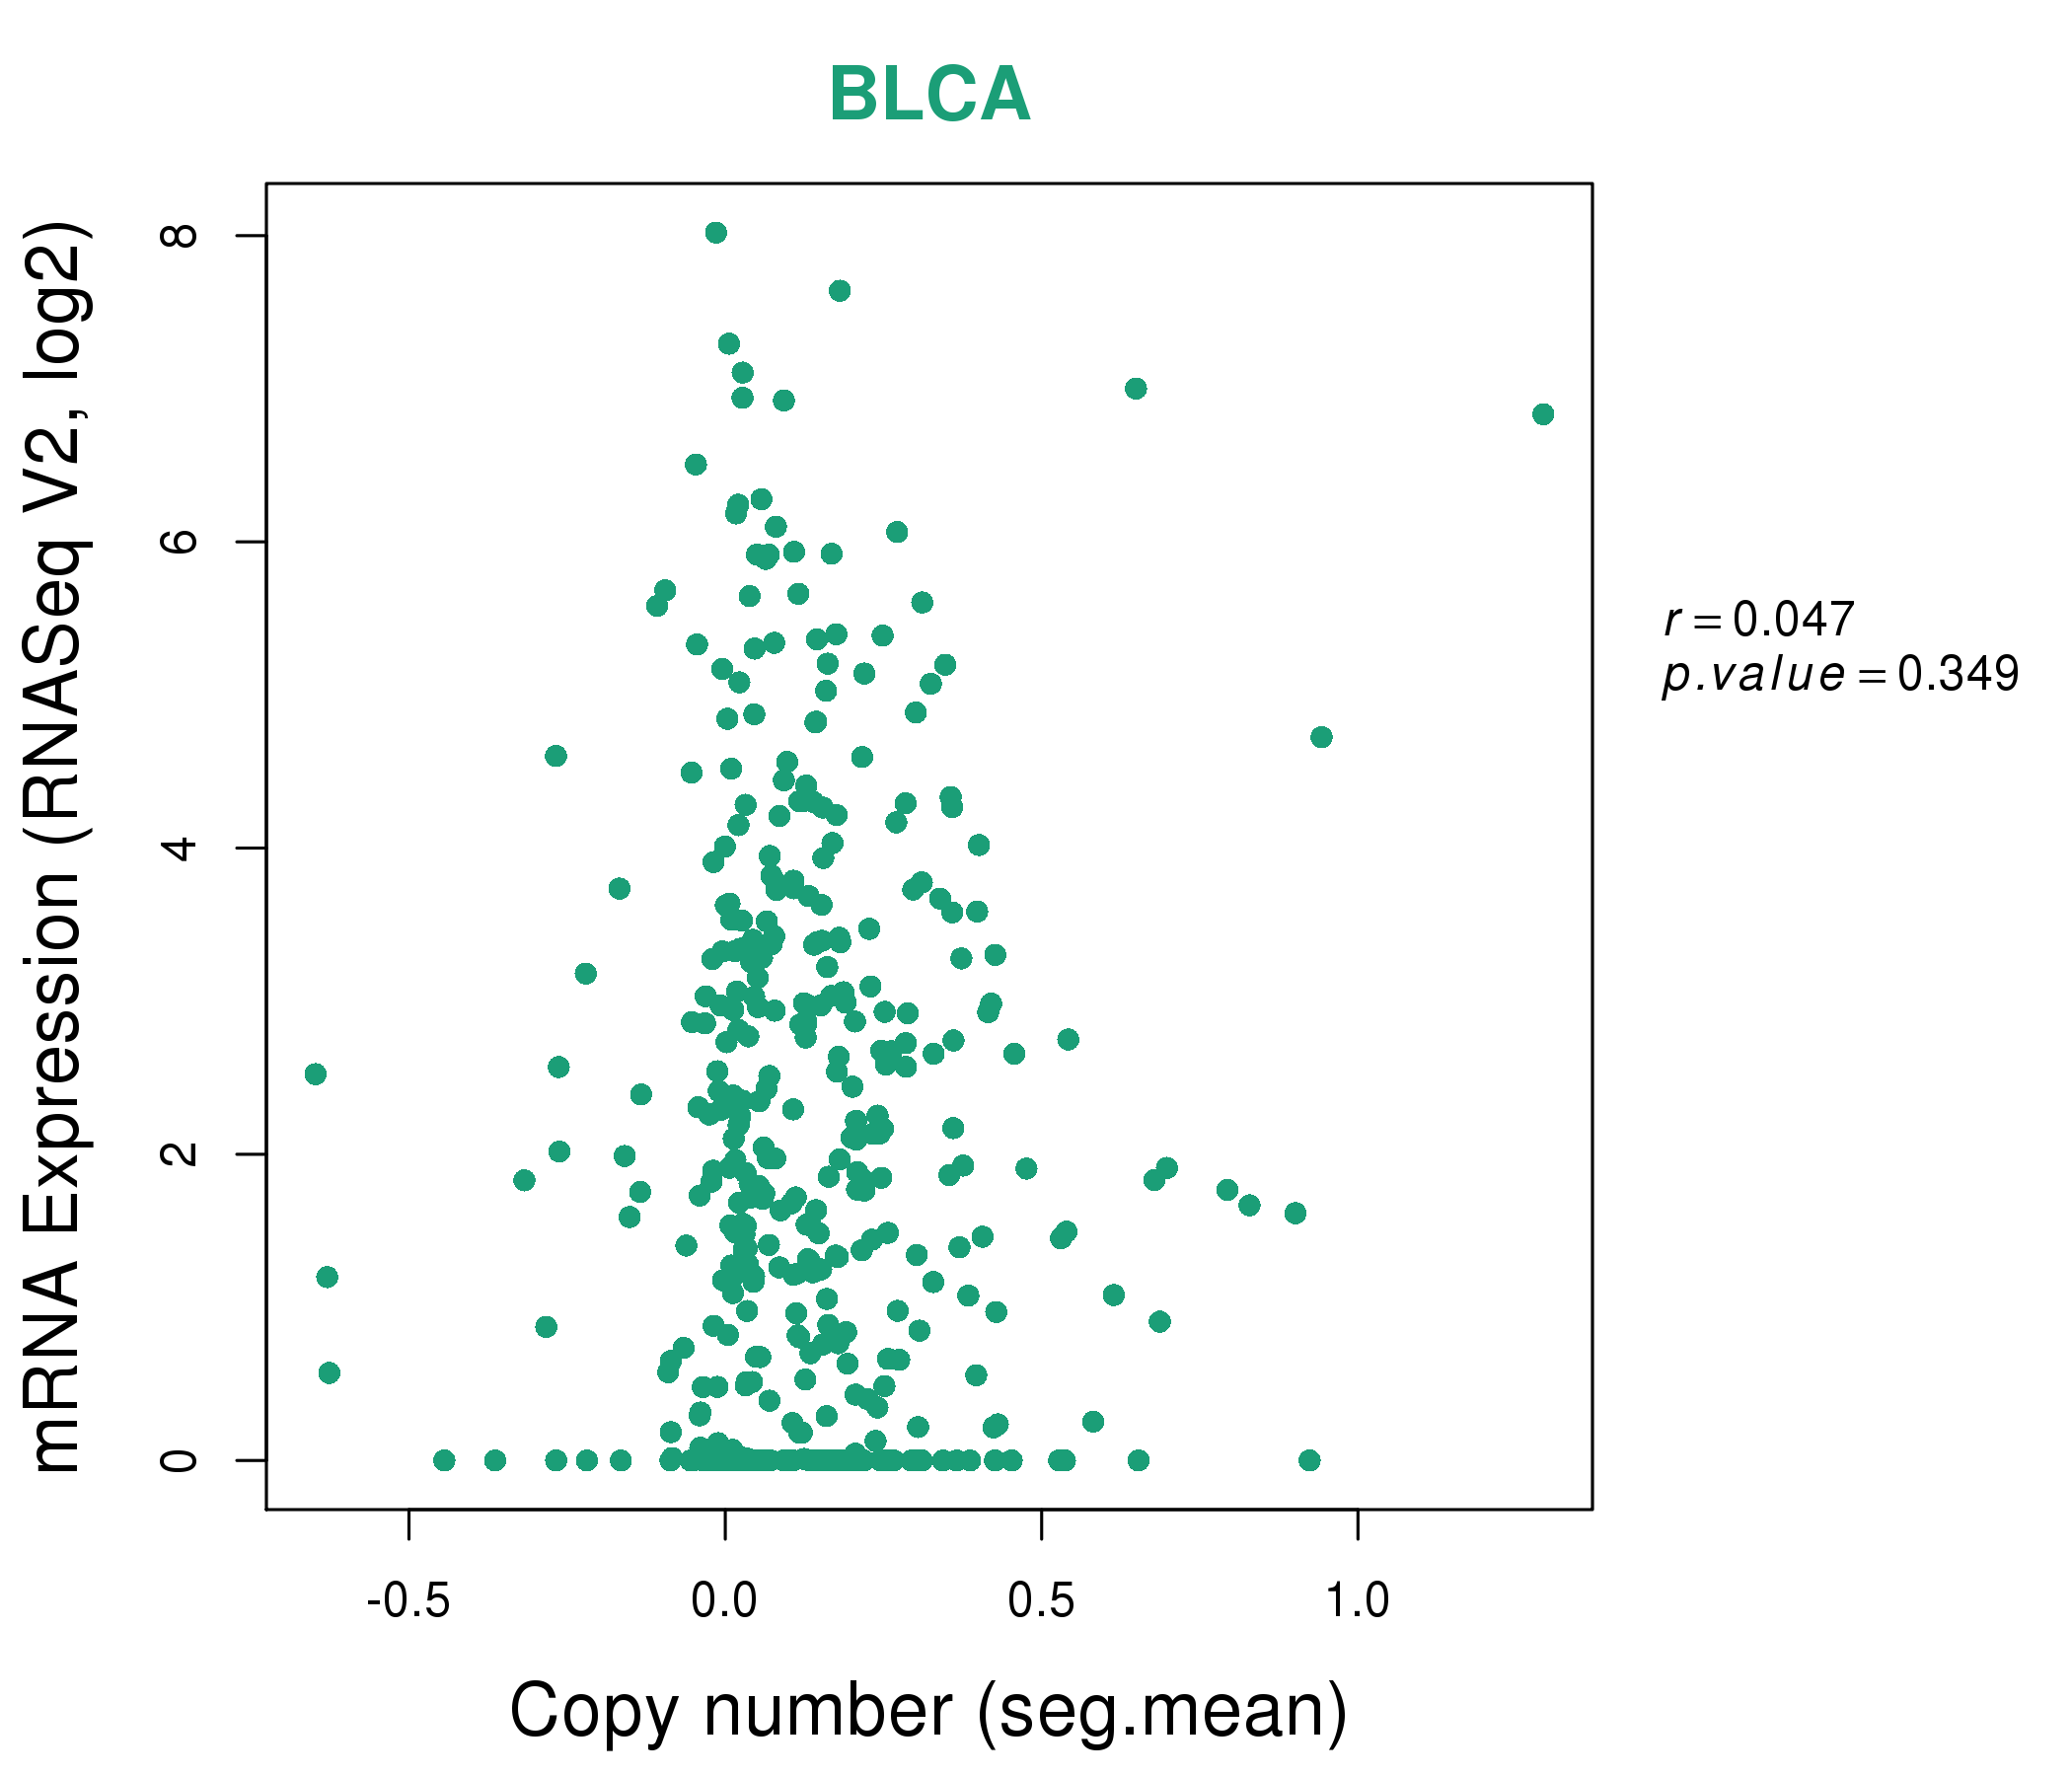
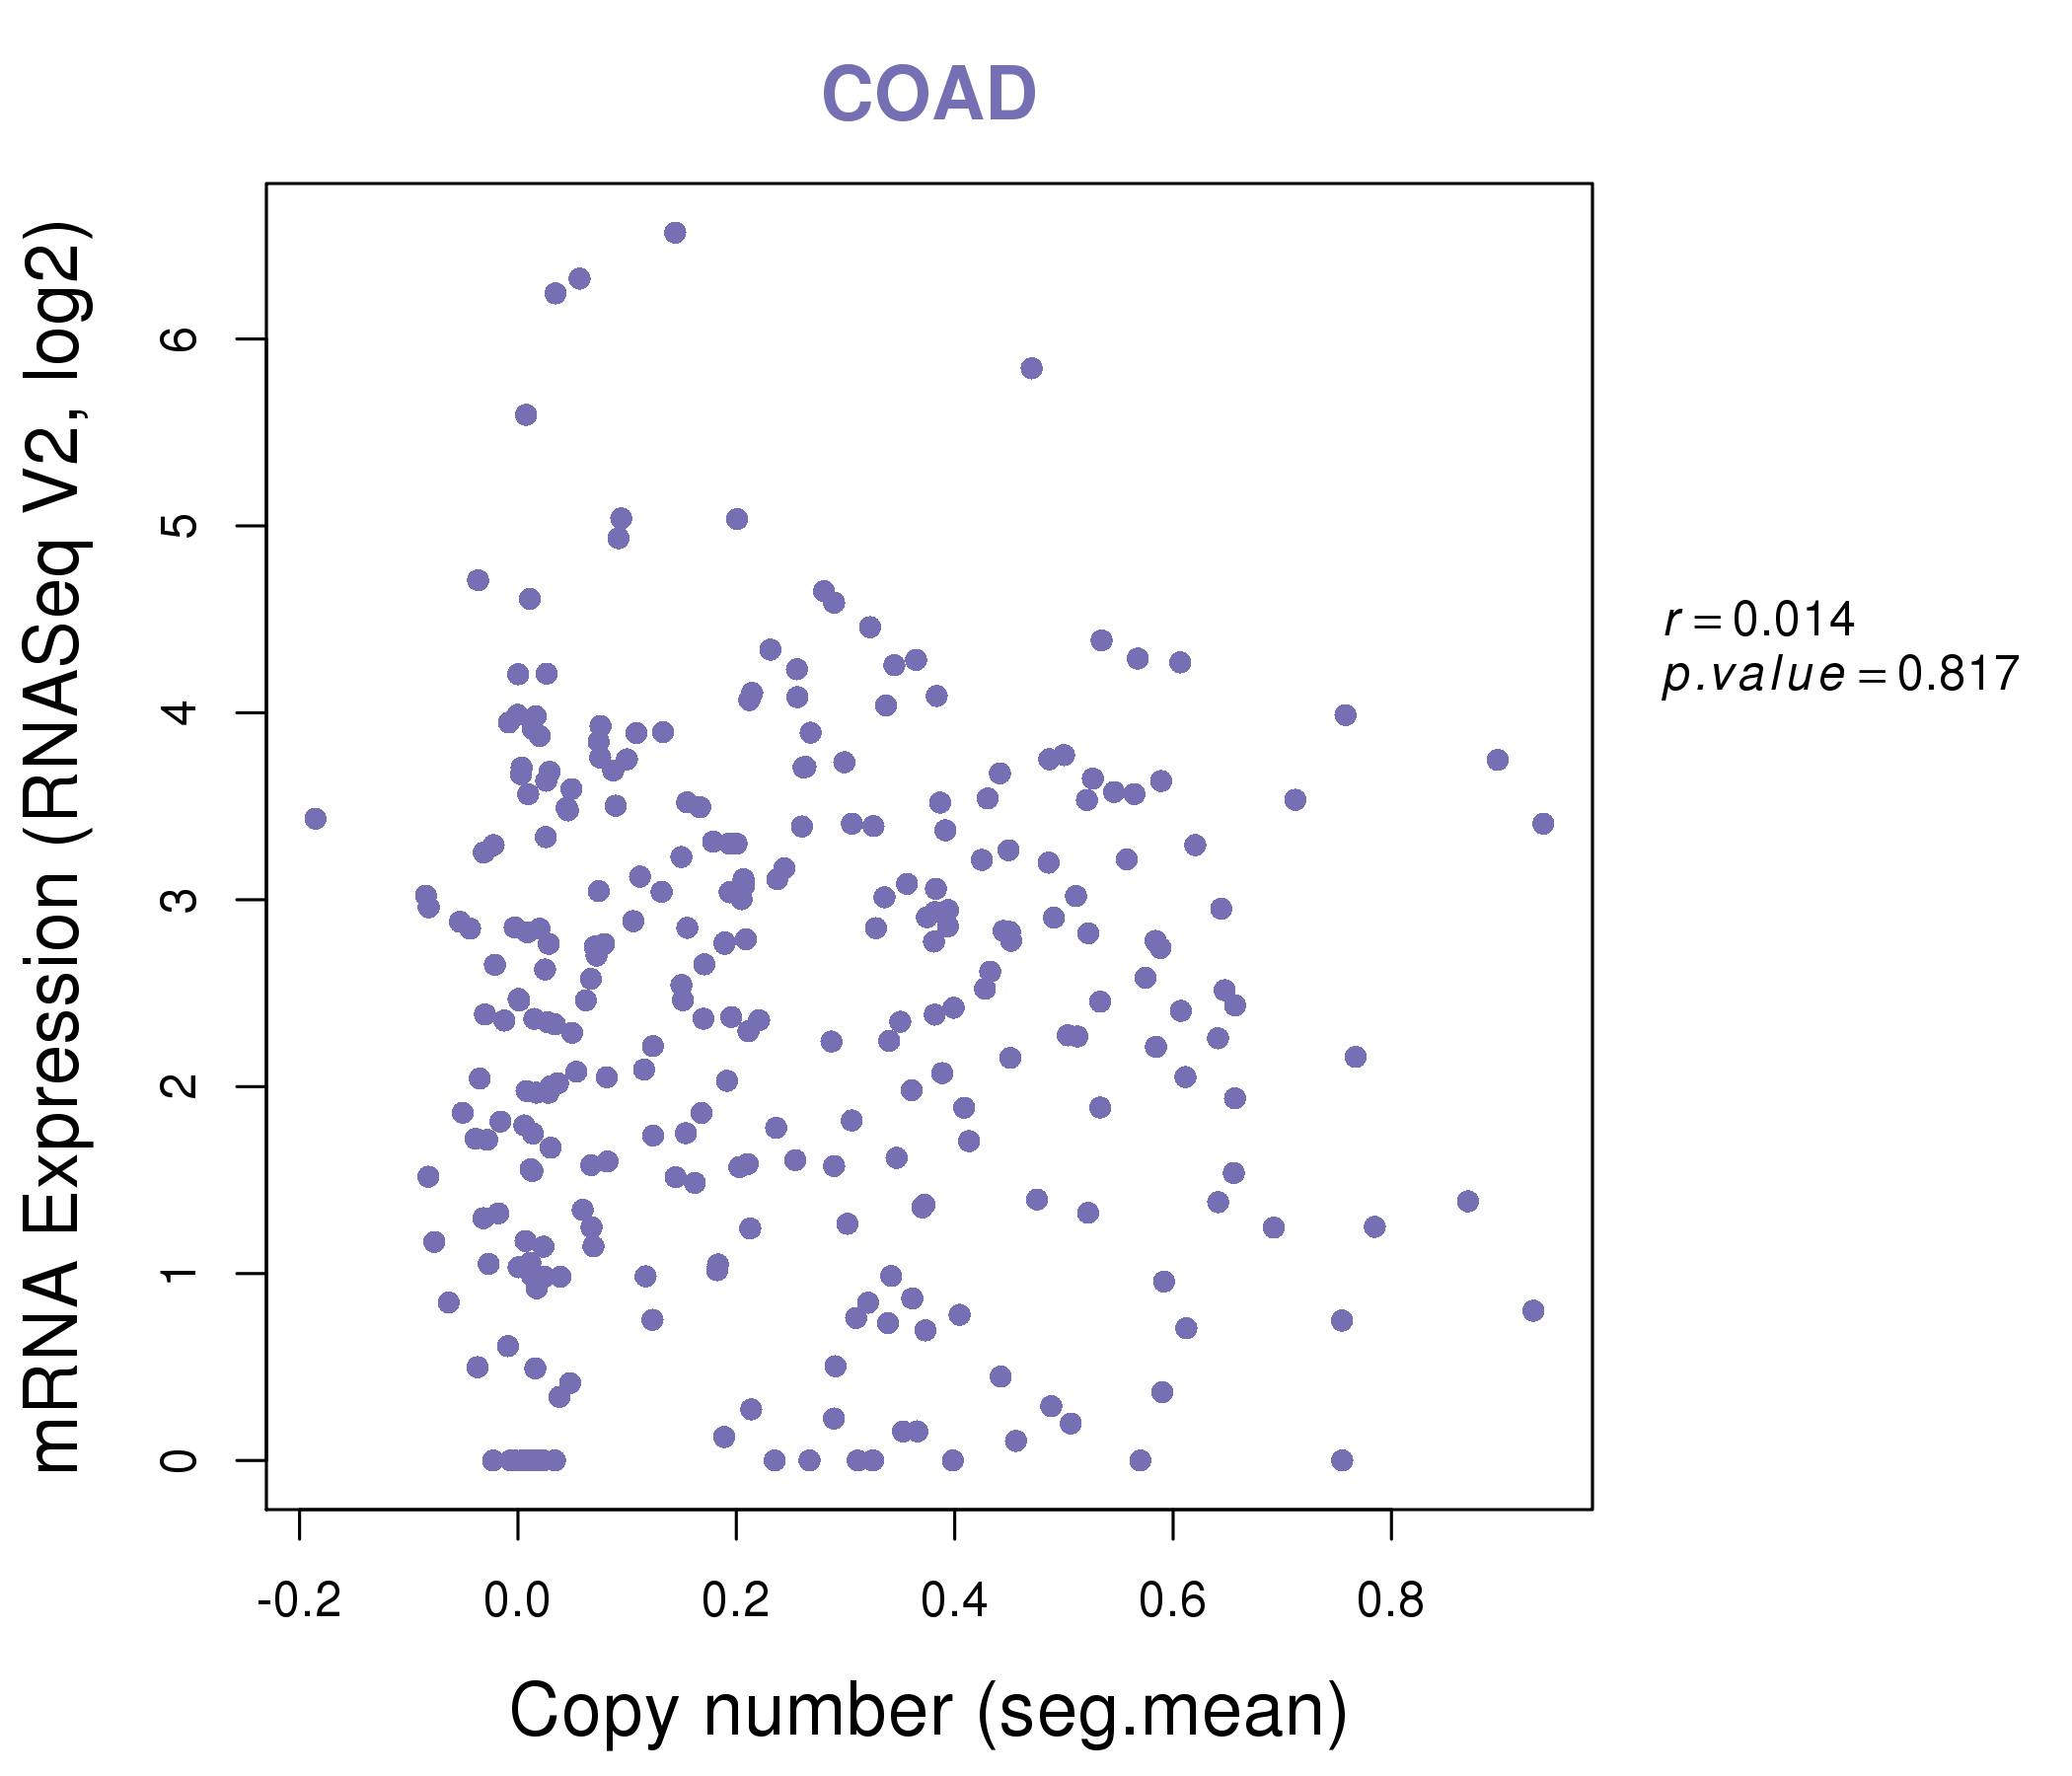
| * This plots show the correlation between CNV and gene expression. |
: Open all plots for all cancer types
 |
|
 |
|


| Top |
| Gene-Gene Network Information |
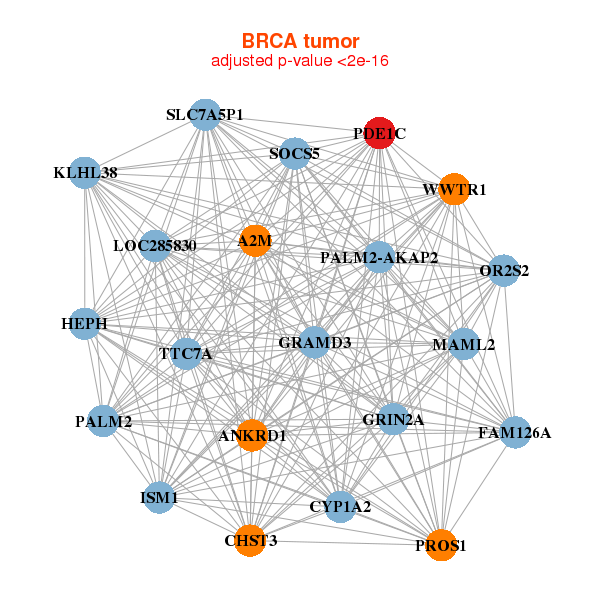
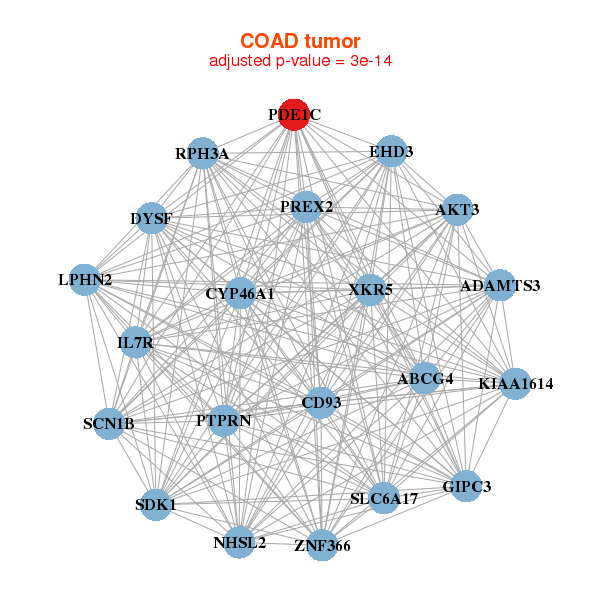
| * Co-Expression network figures were drawn using R package igraph. Only the top 20 genes with the highest correlations were shown. Red circle: input gene, orange circle: cell metabolism gene, sky circle: other gene |
: Open all plots for all cancer types
 |
| ||||
| A2M,ANKRD1,CHST3,CYP1A2,FAM126A,GRAMD3,GRIN2A, HEPH,ISM1,KLHL38,LOC285830,MAML2,OR2S2,PALM2, PALM2-AKAP2,PDE1C,PROS1,SLC7A5P1,SOCS5,TTC7A,WWTR1 | ABI2,ARHGAP19,CACNA1C,ESYT3,FAM83B,FAT2,GPR75, GTF3C4,ITGA2,KIAA1217,LY75,NFASC,PAK3,PAK7, PAWR,PCNXL2,PDE1C,SEMA5A,SIPA1L1,ZNF37BP,ZNF618 | ||||
 |
| ||||
| ABCG4,ADAMTS3,AKT3,CD93,CYP46A1,DYSF,EHD3, GIPC3,IL7R,KIAA1614,LPHN2,NHSL2,PDE1C,PREX2, PTPRN,RPH3A,SCN1B,SDK1,SLC6A17,XKR5,ZNF366 | ABCA8,BMPER,PCNXL4,DIEXF,TRMT44,ERCC6L2,EIF2AK4, FMNL2,IRAK3,KIAA0355,LOX,MYH13,PDE1C,PREX2, PRLHR,RCAN2,SDK2,SHPRH,TGFBRAP1,TTC37,TXLNG |
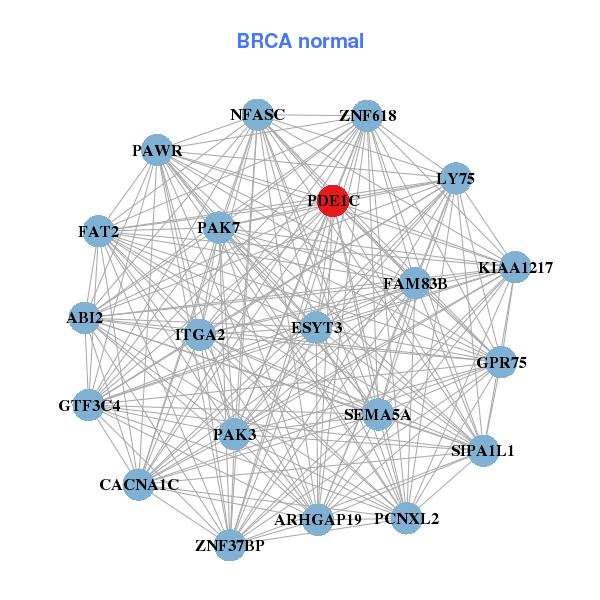
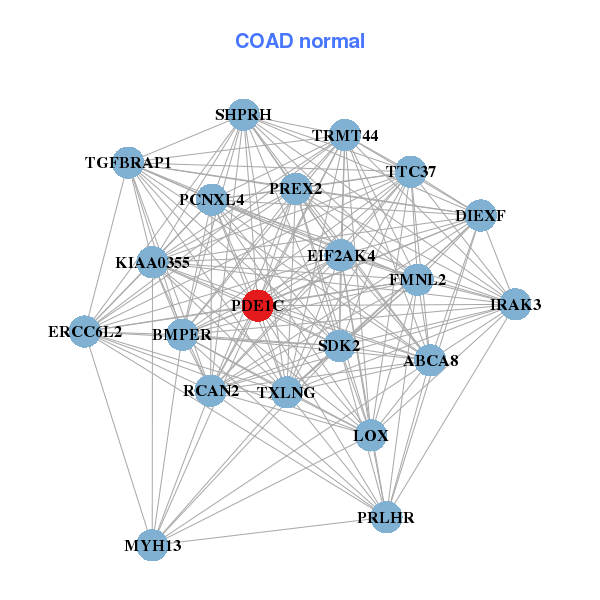
| * Co-Expression network figures were drawn using R package igraph. Only the top 20 genes with the highest correlations were shown. Red circle: input gene, orange circle: cell metabolism gene, sky circle: other gene |
: Open all plots for all cancer types
| Top |
: Open all interacting genes' information including KEGG pathway for all interacting genes from DAVID
| Top |
| Pharmacological Information for PDE1C |
| DB Category | DB Name | DB's ID and Url link |
| * Gene Centered Interaction Network. |
 |
| * Drug Centered Interaction Network. |
| DrugBank ID | Target Name | Drug Groups | Generic Name | Drug Centered Network | Drug Structure |
| DB01151 | phosphodiesterase 1C, calmodulin-dependent 70kDa | approved | Desipramine | 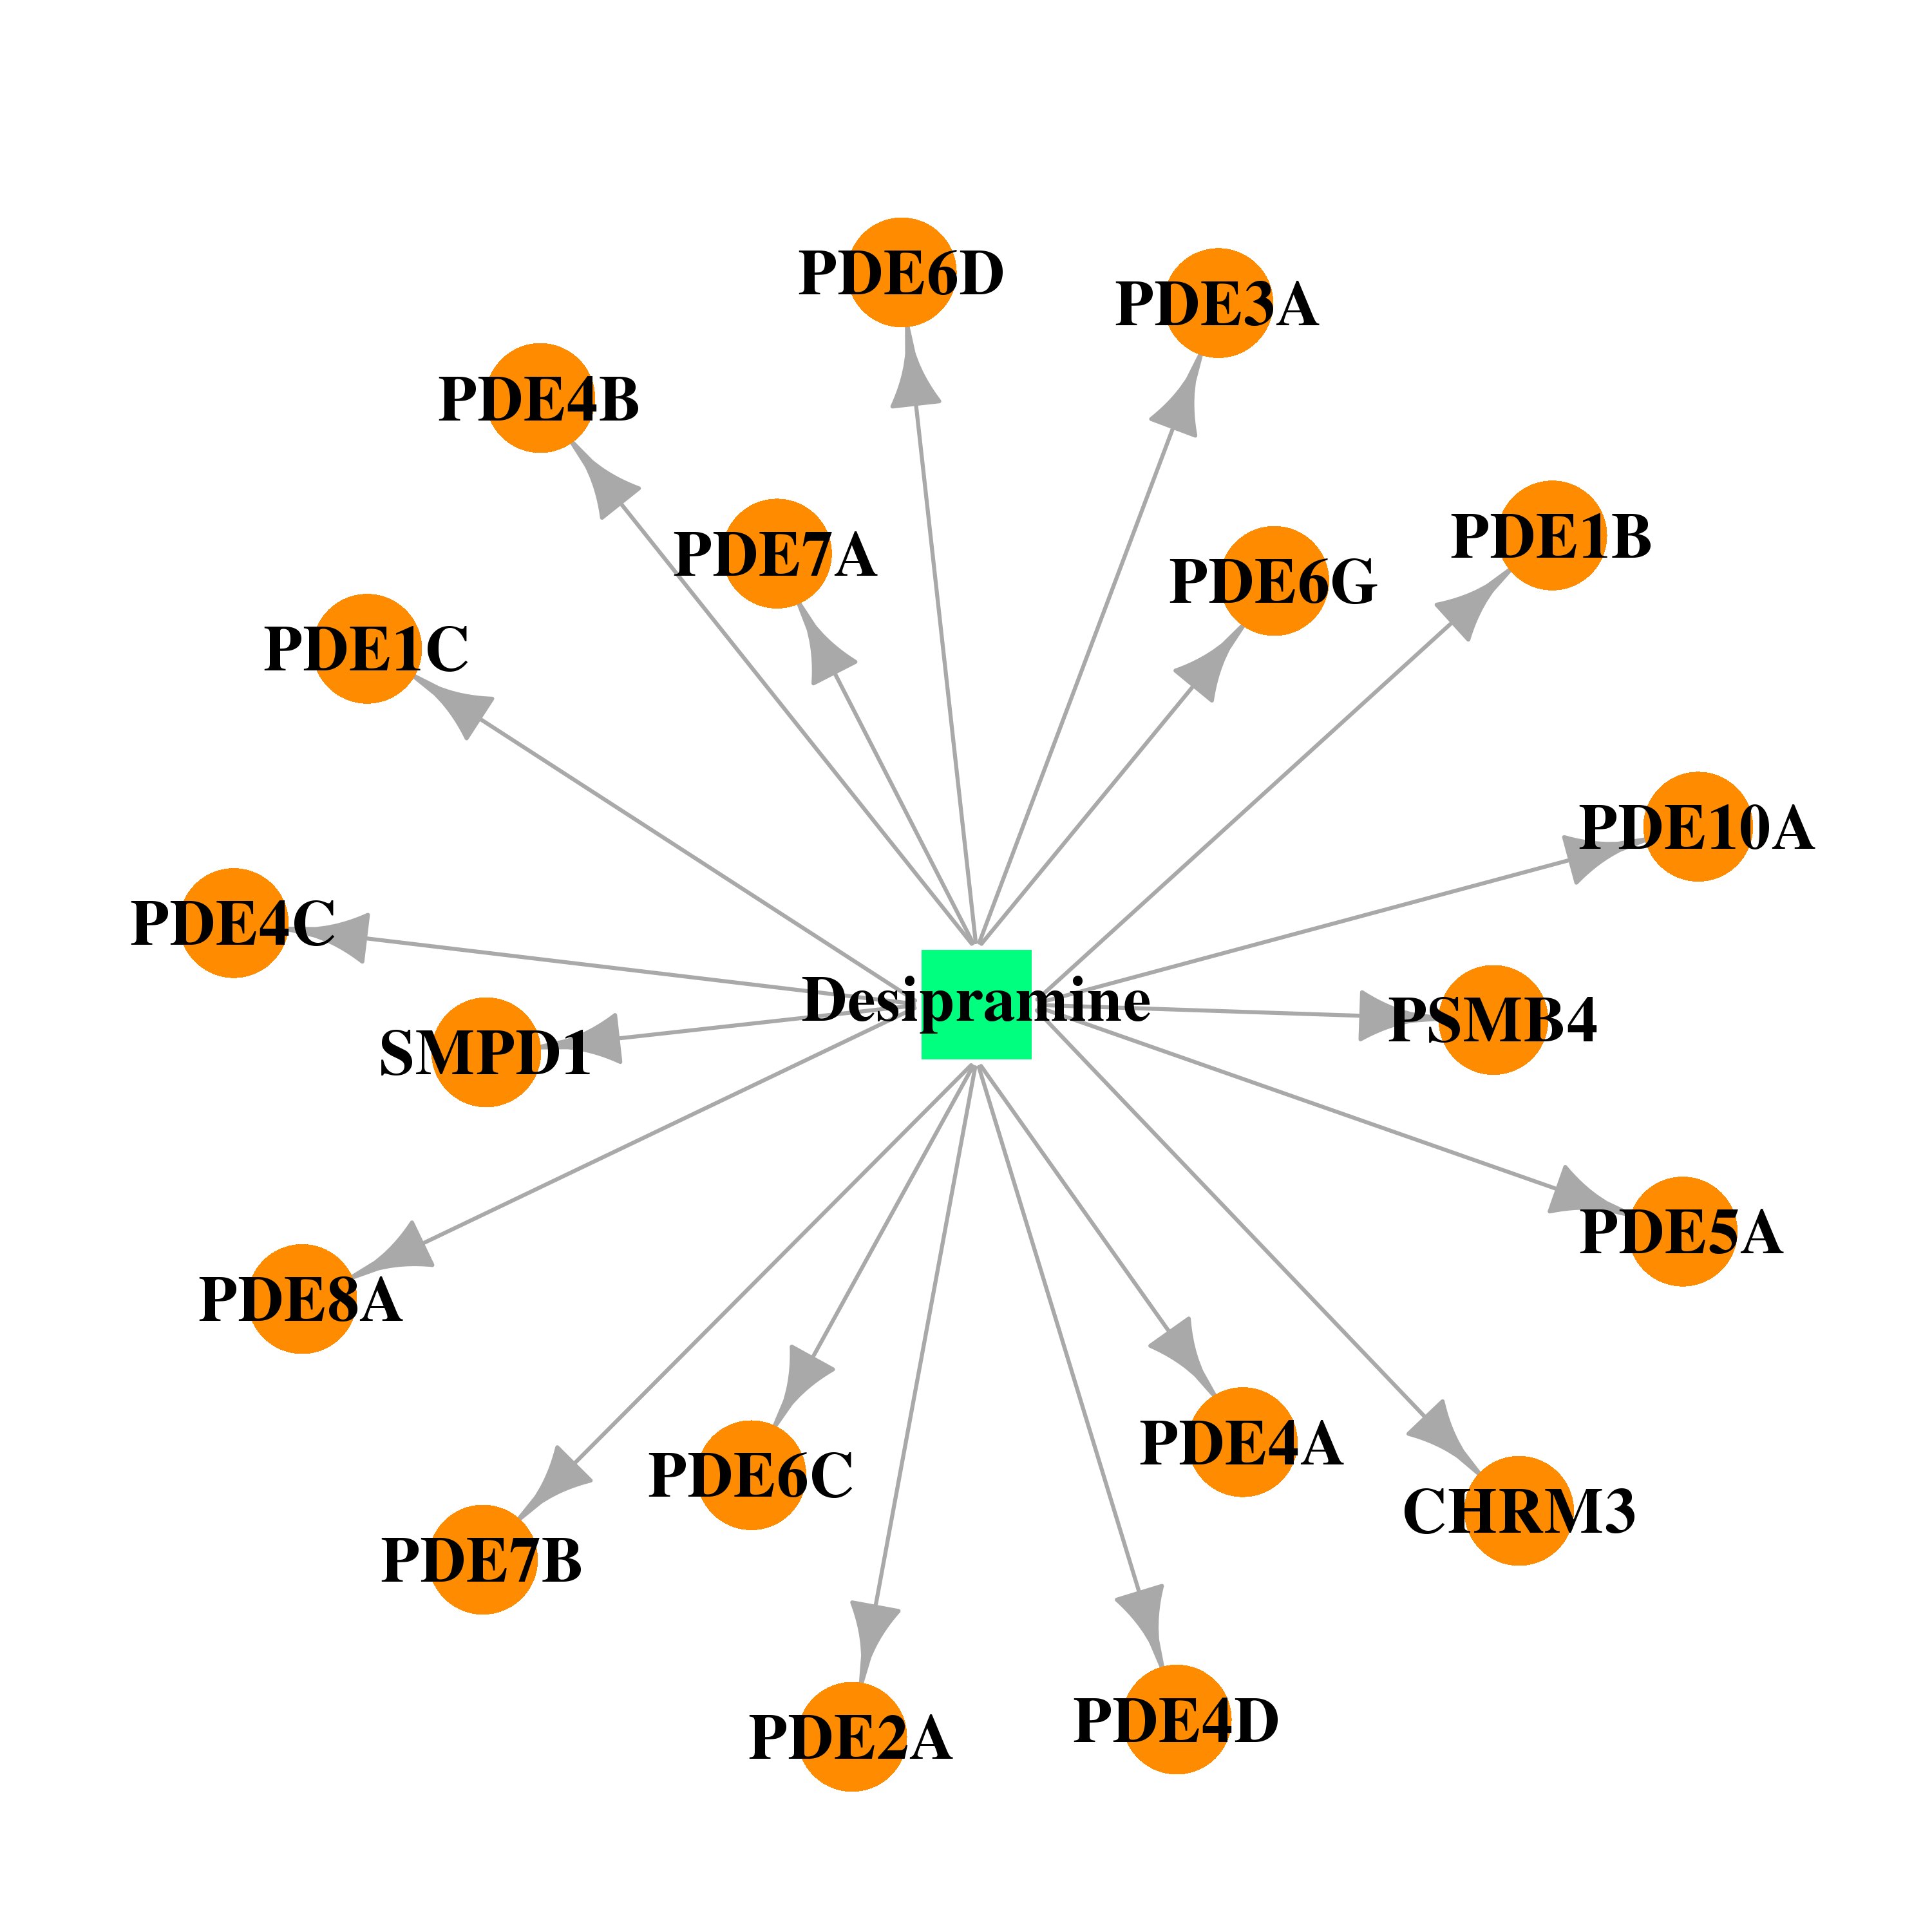 | 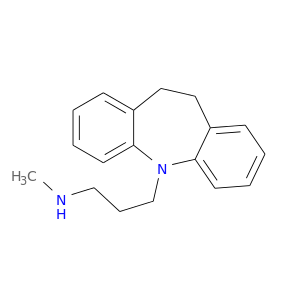 |
| Top |
| Cross referenced IDs for PDE1C |
| * We obtained these cross-references from Uniprot database. It covers 150 different DBs, 18 categories. http://www.uniprot.org/help/cross_references_section |
: Open all cross reference information
|
Copyright © 2016-Present - The Univsersity of Texas Health Science Center at Houston @ |