|
||||||||||||||||||||||||||||||||||||||||||||||||||||||||||||||||||||||||||||||||||||||||||||||||||||||||||||||||||||||||||||||||||||||||||||||||||||||||||||||||||||||||||||||||||||||||||||||||||||||||||||||||||||||||||||||||||||||||||||||||||||||||||||||||||||||||||||||||||||||||||||||||||||||||||||||||||||||||||
| |
| Phenotypic Information (metabolism pathway, cancer, disease, phenome) |
| |
| |
| Gene-Gene Network Information: Co-Expression Network, Interacting Genes & KEGG |
| |
|


| Gene Summary for ENPP2 |
| Basic gene info. | Gene symbol | ENPP2 |
| Gene name | ectonucleotide pyrophosphatase/phosphodiesterase 2 | |
| Synonyms | ATX|ATX-X|AUTOTAXIN|LysoPLD|NPP2|PD-IALPHA|PDNP2 | |
| Cytomap | UCSC genome browser: 8q24.1 | |
| Genomic location | chr8 :120569316-120605248 | |
| Type of gene | protein-coding | |
| RefGenes | NM_001040092.2, NM_001130863.2,NM_006209.4,NR_045555.1, | |
| Ensembl id | ENSG00000136960 | |
| Description | E-NPP 2autotaxin-tectonucleotide pyrophosphatase/phosphodiesterase family member 2extracellular lysophospholipase Dphosphodiesterase I/nucleotide pyrophosphatase 2plasma lysophospholipase D | |
| Modification date | 20141222 | |
| dbXrefs | MIM : 601060 | |
| HGNC : HGNC | ||
| Ensembl : ENSG00000136960 | ||
| HPRD : 03037 | ||
| Vega : OTTHUMG00000164995 | ||
| Protein | UniProt: go to UniProt's Cross Reference DB Table | |
| Expression | CleanEX: HS_ENPP2 | |
| BioGPS: 5168 | ||
| Gene Expression Atlas: ENSG00000136960 | ||
| The Human Protein Atlas: ENSG00000136960 | ||
| Pathway | NCI Pathway Interaction Database: ENPP2 | |
| KEGG: ENPP2 | ||
| REACTOME: ENPP2 | ||
| ConsensusPathDB | ||
| Pathway Commons: ENPP2 | ||
| Metabolism | MetaCyc: ENPP2 | |
| HUMANCyc: ENPP2 | ||
| Regulation | Ensembl's Regulation: ENSG00000136960 | |
| miRBase: chr8 :120,569,316-120,605,248 | ||
| TargetScan: NM_001040092 | ||
| cisRED: ENSG00000136960 | ||
| Context | iHOP: ENPP2 | |
| cancer metabolism search in PubMed: ENPP2 | ||
| UCL Cancer Institute: ENPP2 | ||
| Assigned class in ccmGDB | C | |
| Top |
| Phenotypic Information for ENPP2(metabolism pathway, cancer, disease, phenome) |
| Cancer | CGAP: ENPP2 |
| Familial Cancer Database: ENPP2 | |
| * This gene is included in those cancer gene databases. |
|
|
|
|
|
| . | ||||||||||||||||||||||||||||||||||||||||||||||||||||||||||||||||||||||||||||||||||||||||||||||||||||||||||||||||||||||||||||||||||||||||||||||||||||||||||||||||||||||||||||||||||||||||||||||||||||||||||||||||||||||||||||||||||||||||||||||||||||||||||||||||||||||||||||||||||||||||||||||||||||||||||||||||||||
Oncogene 1 | Significant driver gene in | |||||||||||||||||||||||||||||||||||||||||||||||||||||||||||||||||||||||||||||||||||||||||||||||||||||||||||||||||||||||||||||||||||||||||||||||||||||||||||||||||||||||||||||||||||||||||||||||||||||||||||||||||||||||||||||||||||||||||||||||||||||||||||||||||||||||||||||||||||||||||||||||||||||||||||||||||||||||||
| cf) number; DB name 1 Oncogene; http://nar.oxfordjournals.org/content/35/suppl_1/D721.long, 2 Tumor Suppressor gene; https://bioinfo.uth.edu/TSGene/, 3 Cancer Gene Census; http://www.nature.com/nrc/journal/v4/n3/abs/nrc1299.html, 4 CancerGenes; http://nar.oxfordjournals.org/content/35/suppl_1/D721.long, 5 Network of Cancer Gene; http://ncg.kcl.ac.uk/index.php, 1Therapeutic Vulnerabilities in Cancer; http://cbio.mskcc.org/cancergenomics/statius/ |
| Nat Rev Drug Discovery, 2013, 12: 829, doi: 10.1038/nrd4145 | |
| OMIM | |
| Orphanet | |
| Disease | KEGG Disease: ENPP2 |
| MedGen: ENPP2 (Human Medical Genetics with Condition) | |
| ClinVar: ENPP2 | |
| Phenotype | MGI: ENPP2 (International Mouse Phenotyping Consortium) |
| PhenomicDB: ENPP2 | |
| Mutations for ENPP2 |
| * Under tables are showing count per each tissue to give us broad intuition about tissue specific mutation patterns.You can go to the detailed page for each mutation database's web site. |
| There's no structural variation information in COSMIC data for this gene. |
| * From mRNA Sanger sequences, Chitars2.0 arranged chimeric transcripts. This table shows ENPP2 related fusion information. |
| ID | Head Gene | Tail Gene | Accession | Gene_a | qStart_a | qEnd_a | Chromosome_a | tStart_a | tEnd_a | Gene_a | qStart_a | qEnd_a | Chromosome_a | tStart_a | tEnd_a |
| AV754461 | AUTS2 | 1 | 234 | 7 | 69813214 | 69813447 | ENPP2 | 225 | 625 | 8 | 120600141 | 120600550 | |
| AI718737 | ENPP2 | 9 | 363 | 8 | 120620029 | 120620382 | MALAT1 | 357 | 495 | 11 | 65271001 | 65271139 | |
| AK022268 | TBL1XR1 | 1 | 1532 | 3 | 176902489 | 176904018 | ENPP2 | 1530 | 2256 | 8 | 120643145 | 120643871 | |
| BM508959 | ENPP2 | 24 | 131 | 8 | 120569350 | 120569457 | C5orf55 | 131 | 536 | 5 | 442697 | 443102 | |
| BE061136 | ENPP2 | 5 | 80 | 8 | 120609938 | 120610015 | ETNK1 | 73 | 599 | 12 | 22787799 | 22788325 | |
| Top |
| Mutation type/ Tissue ID | brca | cns | cerv | endome | haematopo | kidn | Lintest | liver | lung | ns | ovary | pancre | prost | skin | stoma | thyro | urina | |||
| Total # sample | 2 | 1 | 3 | |||||||||||||||||
| GAIN (# sample) | 2 | 1 | 3 | |||||||||||||||||
| LOSS (# sample) |
| cf) Tissue ID; Tissue type (1; Breast, 2; Central_nervous_system, 3; Cervix, 4; Endometrium, 5; Haematopoietic_and_lymphoid_tissue, 6; Kidney, 7; Large_intestine, 8; Liver, 9; Lung, 10; NS, 11; Ovary, 12; Pancreas, 13; Prostate, 14; Skin, 15; Stomach, 16; Thyroid, 17; Urinary_tract) |
| Top |
|
 |
| Top |
| Stat. for Non-Synonymous SNVs (# total SNVs=129) | (# total SNVs=41) |
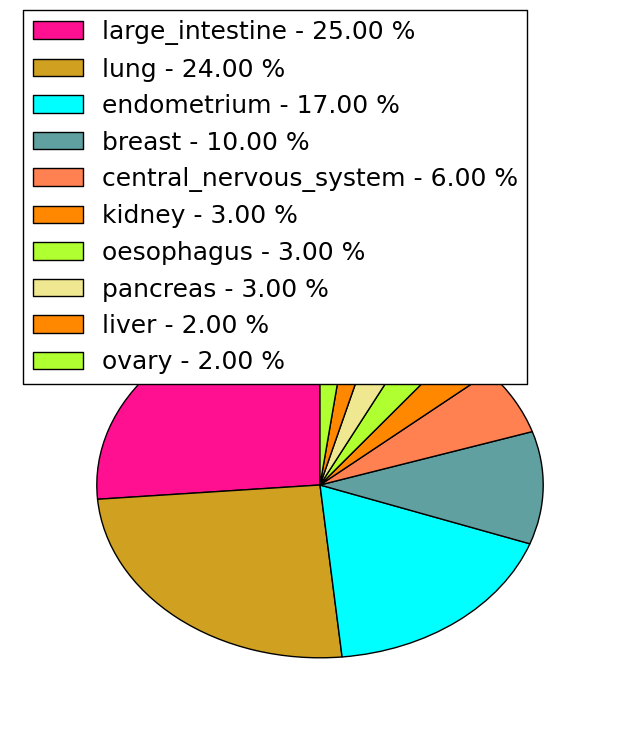 | 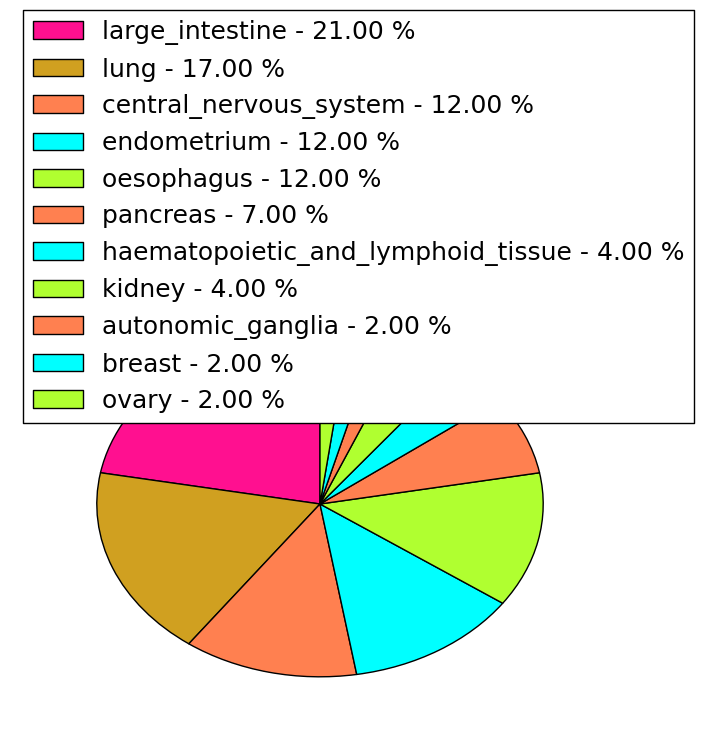 |
(# total SNVs=1) | (# total SNVs=0) |
 |
| Top |
| * When you move the cursor on each content, you can see more deailed mutation information on the Tooltip. Those are primary_site,primary_histology,mutation(aa),pubmedID. |
| GRCh37 position | Mutation(aa) | Unique sampleID count |
| chr8:120575112-120575112 | p.N854K | 4 |
| chr8:120602772-120602772 | p.R446* | 3 |
| chr8:120577158-120577158 | p.K775N | 3 |
| chr8:120613690-120613690 | p.H282H | 3 |
| chr8:120631537-120631537 | p.S142S | 3 |
| chr8:120608142-120608142 | p.R358I | 3 |
| chr8:120608098-120608098 | p.R373S | 2 |
| chr8:120650706-120650706 | p.R32Q | 2 |
| chr8:120602777-120602777 | p.R444I | 2 |
| chr8:120629796-120629796 | p.R163C | 2 |
| Top |
|
 |
| Point Mutation/ Tissue ID | 1 | 2 | 3 | 4 | 5 | 6 | 7 | 8 | 9 | 10 | 11 | 12 | 13 | 14 | 15 | 16 | 17 | 18 | 19 | 20 |
| # sample | 2 | 9 | 1 | 26 | 6 | 5 | 1 | 5 | 16 | 12 | 4 | 1 | 2 | 4 | 4 | 17 | ||||
| # mutation | 2 | 9 | 1 | 25 | 6 | 5 | 1 | 5 | 20 | 13 | 4 | 1 | 2 | 4 | 4 | 22 | ||||
| nonsynonymous SNV | 1 | 8 | 1 | 23 | 4 | 4 | 1 | 3 | 14 | 9 | 3 | 1 | 1 | 3 | 3 | 19 | ||||
| synonymous SNV | 1 | 1 | 2 | 2 | 1 | 2 | 6 | 4 | 1 | 1 | 1 | 1 | 3 |
| cf) Tissue ID; Tissue type (1; BLCA[Bladder Urothelial Carcinoma], 2; BRCA[Breast invasive carcinoma], 3; CESC[Cervical squamous cell carcinoma and endocervical adenocarcinoma], 4; COAD[Colon adenocarcinoma], 5; GBM[Glioblastoma multiforme], 6; Glioma Low Grade, 7; HNSC[Head and Neck squamous cell carcinoma], 8; KICH[Kidney Chromophobe], 9; KIRC[Kidney renal clear cell carcinoma], 10; KIRP[Kidney renal papillary cell carcinoma], 11; LAML[Acute Myeloid Leukemia], 12; LUAD[Lung adenocarcinoma], 13; LUSC[Lung squamous cell carcinoma], 14; OV[Ovarian serous cystadenocarcinoma ], 15; PAAD[Pancreatic adenocarcinoma], 16; PRAD[Prostate adenocarcinoma], 17; SKCM[Skin Cutaneous Melanoma], 18:STAD[Stomach adenocarcinoma], 19:THCA[Thyroid carcinoma], 20:UCEC[Uterine Corpus Endometrial Carcinoma]) |
| Top |
| * We represented just top 10 SNVs. When you move the cursor on each content, you can see more deailed mutation information on the Tooltip. Those are primary_site, primary_histology, mutation(aa), pubmedID. |
| Genomic Position | Mutation(aa) | Unique sampleID count |
| chr8:120631537 | p.S142S,ENPP2 | 3 |
| chr8:120575114 | p.S395F,ENPP2 | 2 |
| chr8:120575154 | p.R392I,ENPP2 | 2 |
| chr8:120608098 | p.R373C | 2 |
| chr8:120598544 | p.V461V,ENPP2 | 2 |
| chr8:120596274 | p.R358I | 2 |
| chr8:120608142 | p.K357R | 2 |
| chr8:120602768 | p.N802D,ENPP2 | 2 |
| chr8:120608145 | p.P417S,ENPP2 | 2 |
| chr8:120602777 | p.P788P,ENPP2 | 2 |
| * Copy number data were extracted from TCGA using R package TCGA-Assembler. The URLs of all public data files on TCGA DCC data server were gathered on Jan-05-2015. Function ProcessCNAData in TCGA-Assembler package was used to obtain gene-level copy number value which is calculated as the average copy number of the genomic region of a gene. |
 |
| cf) Tissue ID[Tissue type]: BLCA[Bladder Urothelial Carcinoma], BRCA[Breast invasive carcinoma], CESC[Cervical squamous cell carcinoma and endocervical adenocarcinoma], COAD[Colon adenocarcinoma], GBM[Glioblastoma multiforme], Glioma Low Grade, HNSC[Head and Neck squamous cell carcinoma], KICH[Kidney Chromophobe], KIRC[Kidney renal clear cell carcinoma], KIRP[Kidney renal papillary cell carcinoma], LAML[Acute Myeloid Leukemia], LUAD[Lung adenocarcinoma], LUSC[Lung squamous cell carcinoma], OV[Ovarian serous cystadenocarcinoma ], PAAD[Pancreatic adenocarcinoma], PRAD[Prostate adenocarcinoma], SKCM[Skin Cutaneous Melanoma], STAD[Stomach adenocarcinoma], THCA[Thyroid carcinoma], UCEC[Uterine Corpus Endometrial Carcinoma] |
| Top |
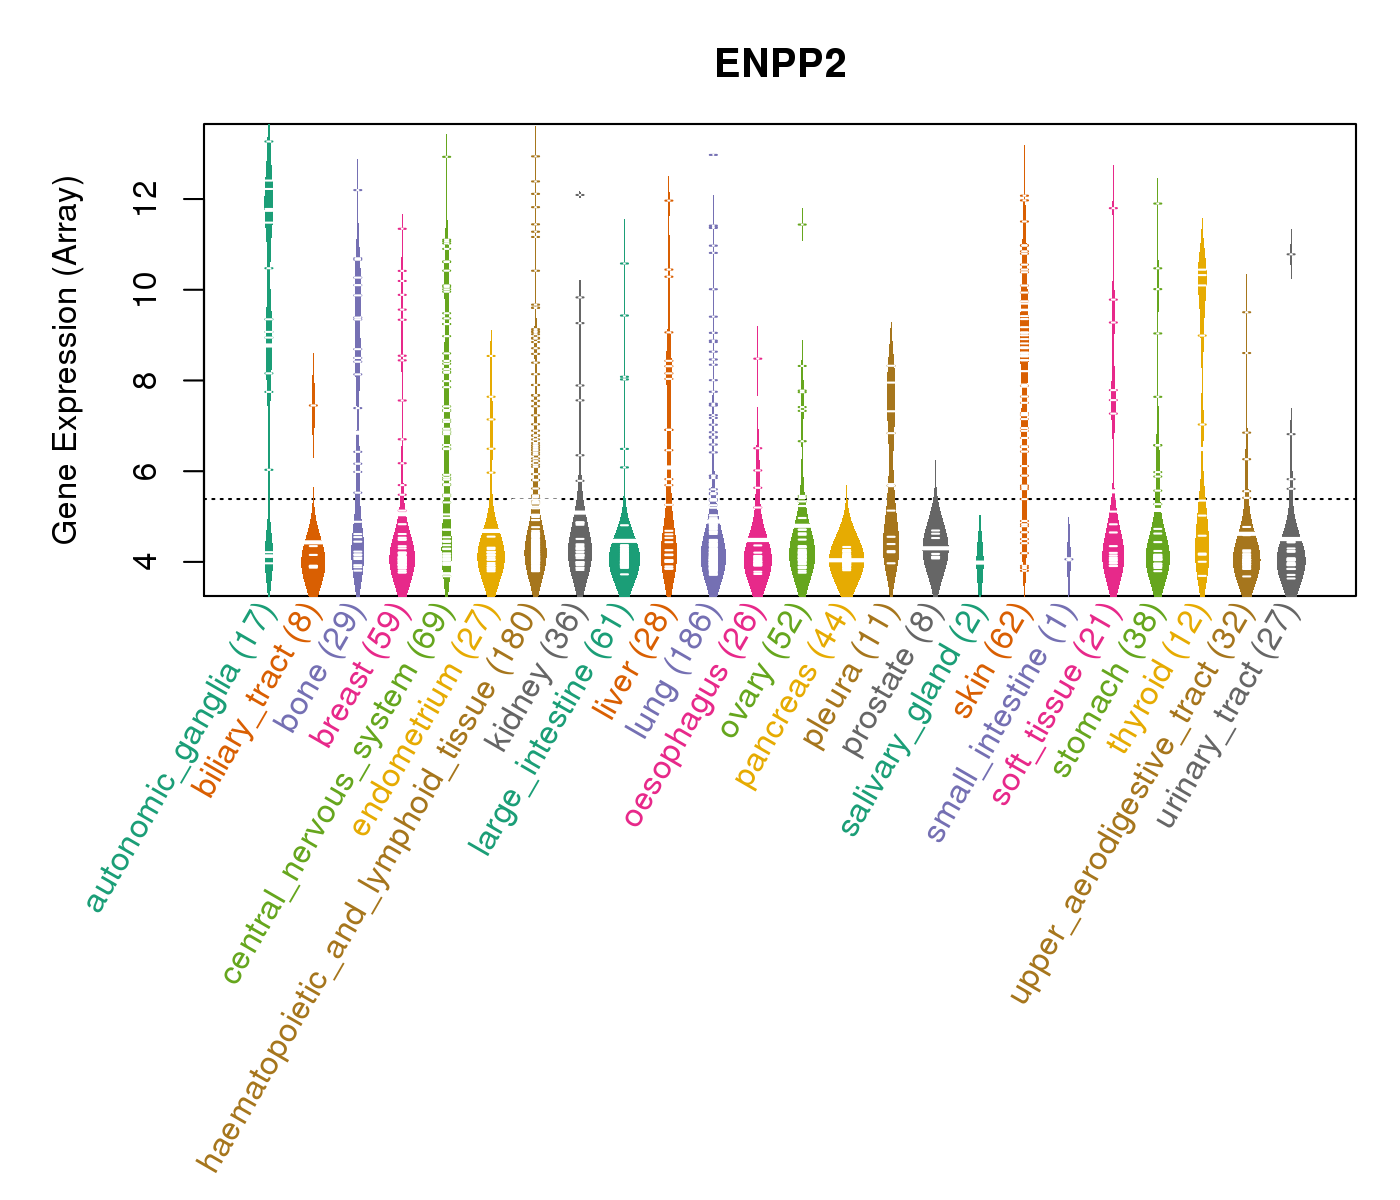
| Gene Expression for ENPP2 |
| * CCLE gene expression data were extracted from CCLE_Expression_Entrez_2012-10-18.res: Gene-centric RMA-normalized mRNA expression data. |
 |
| * Normalized gene expression data of RNASeqV2 was extracted from TCGA using R package TCGA-Assembler. The URLs of all public data files on TCGA DCC data server were gathered at Jan-05-2015. Only eight cancer types have enough normal control samples for differential expression analysis. (t test, adjusted p<0.05 (using Benjamini-Hochberg FDR)) |
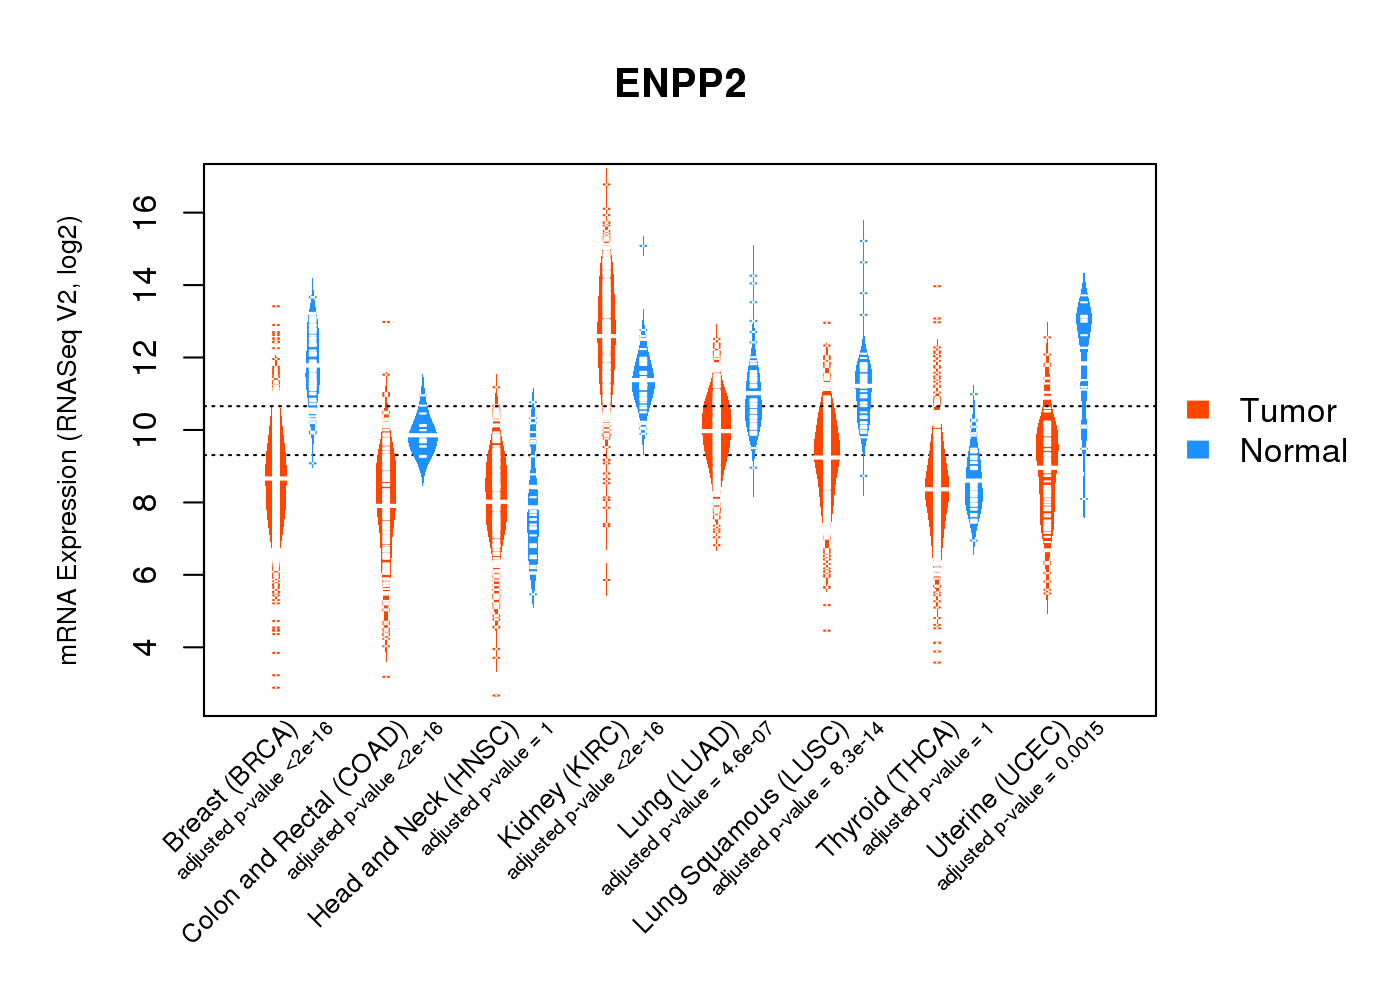 |
| Top |
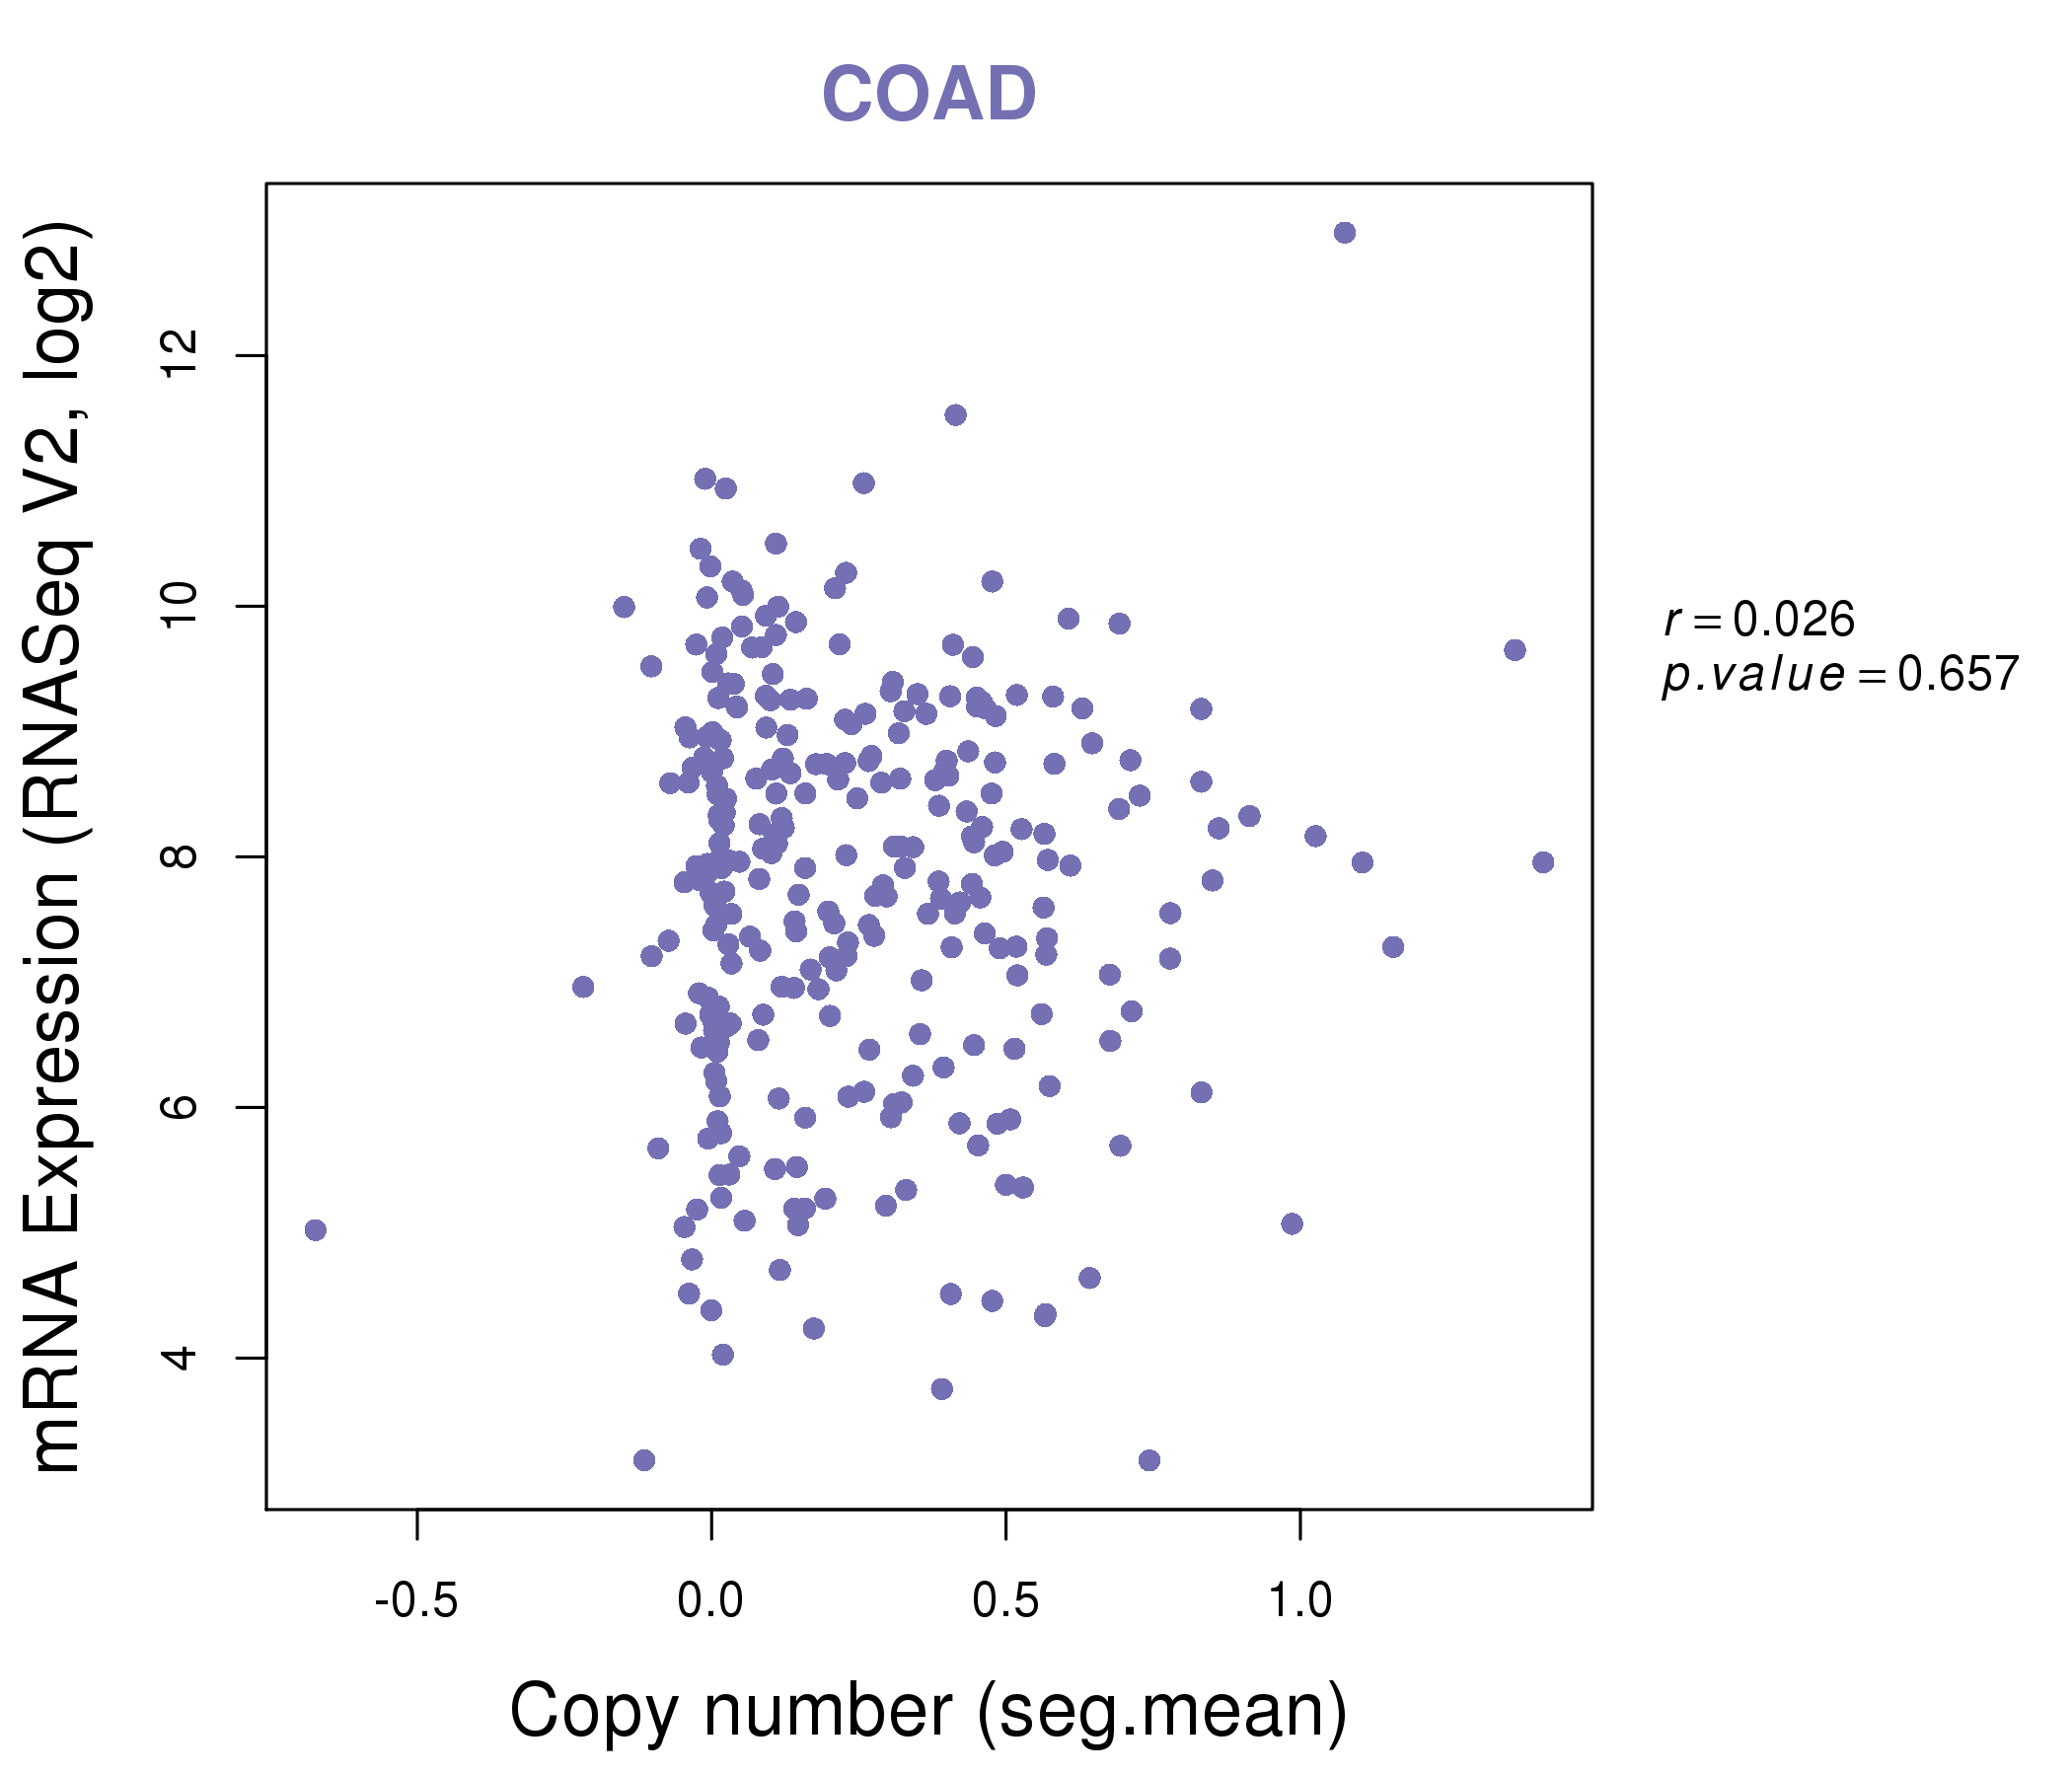
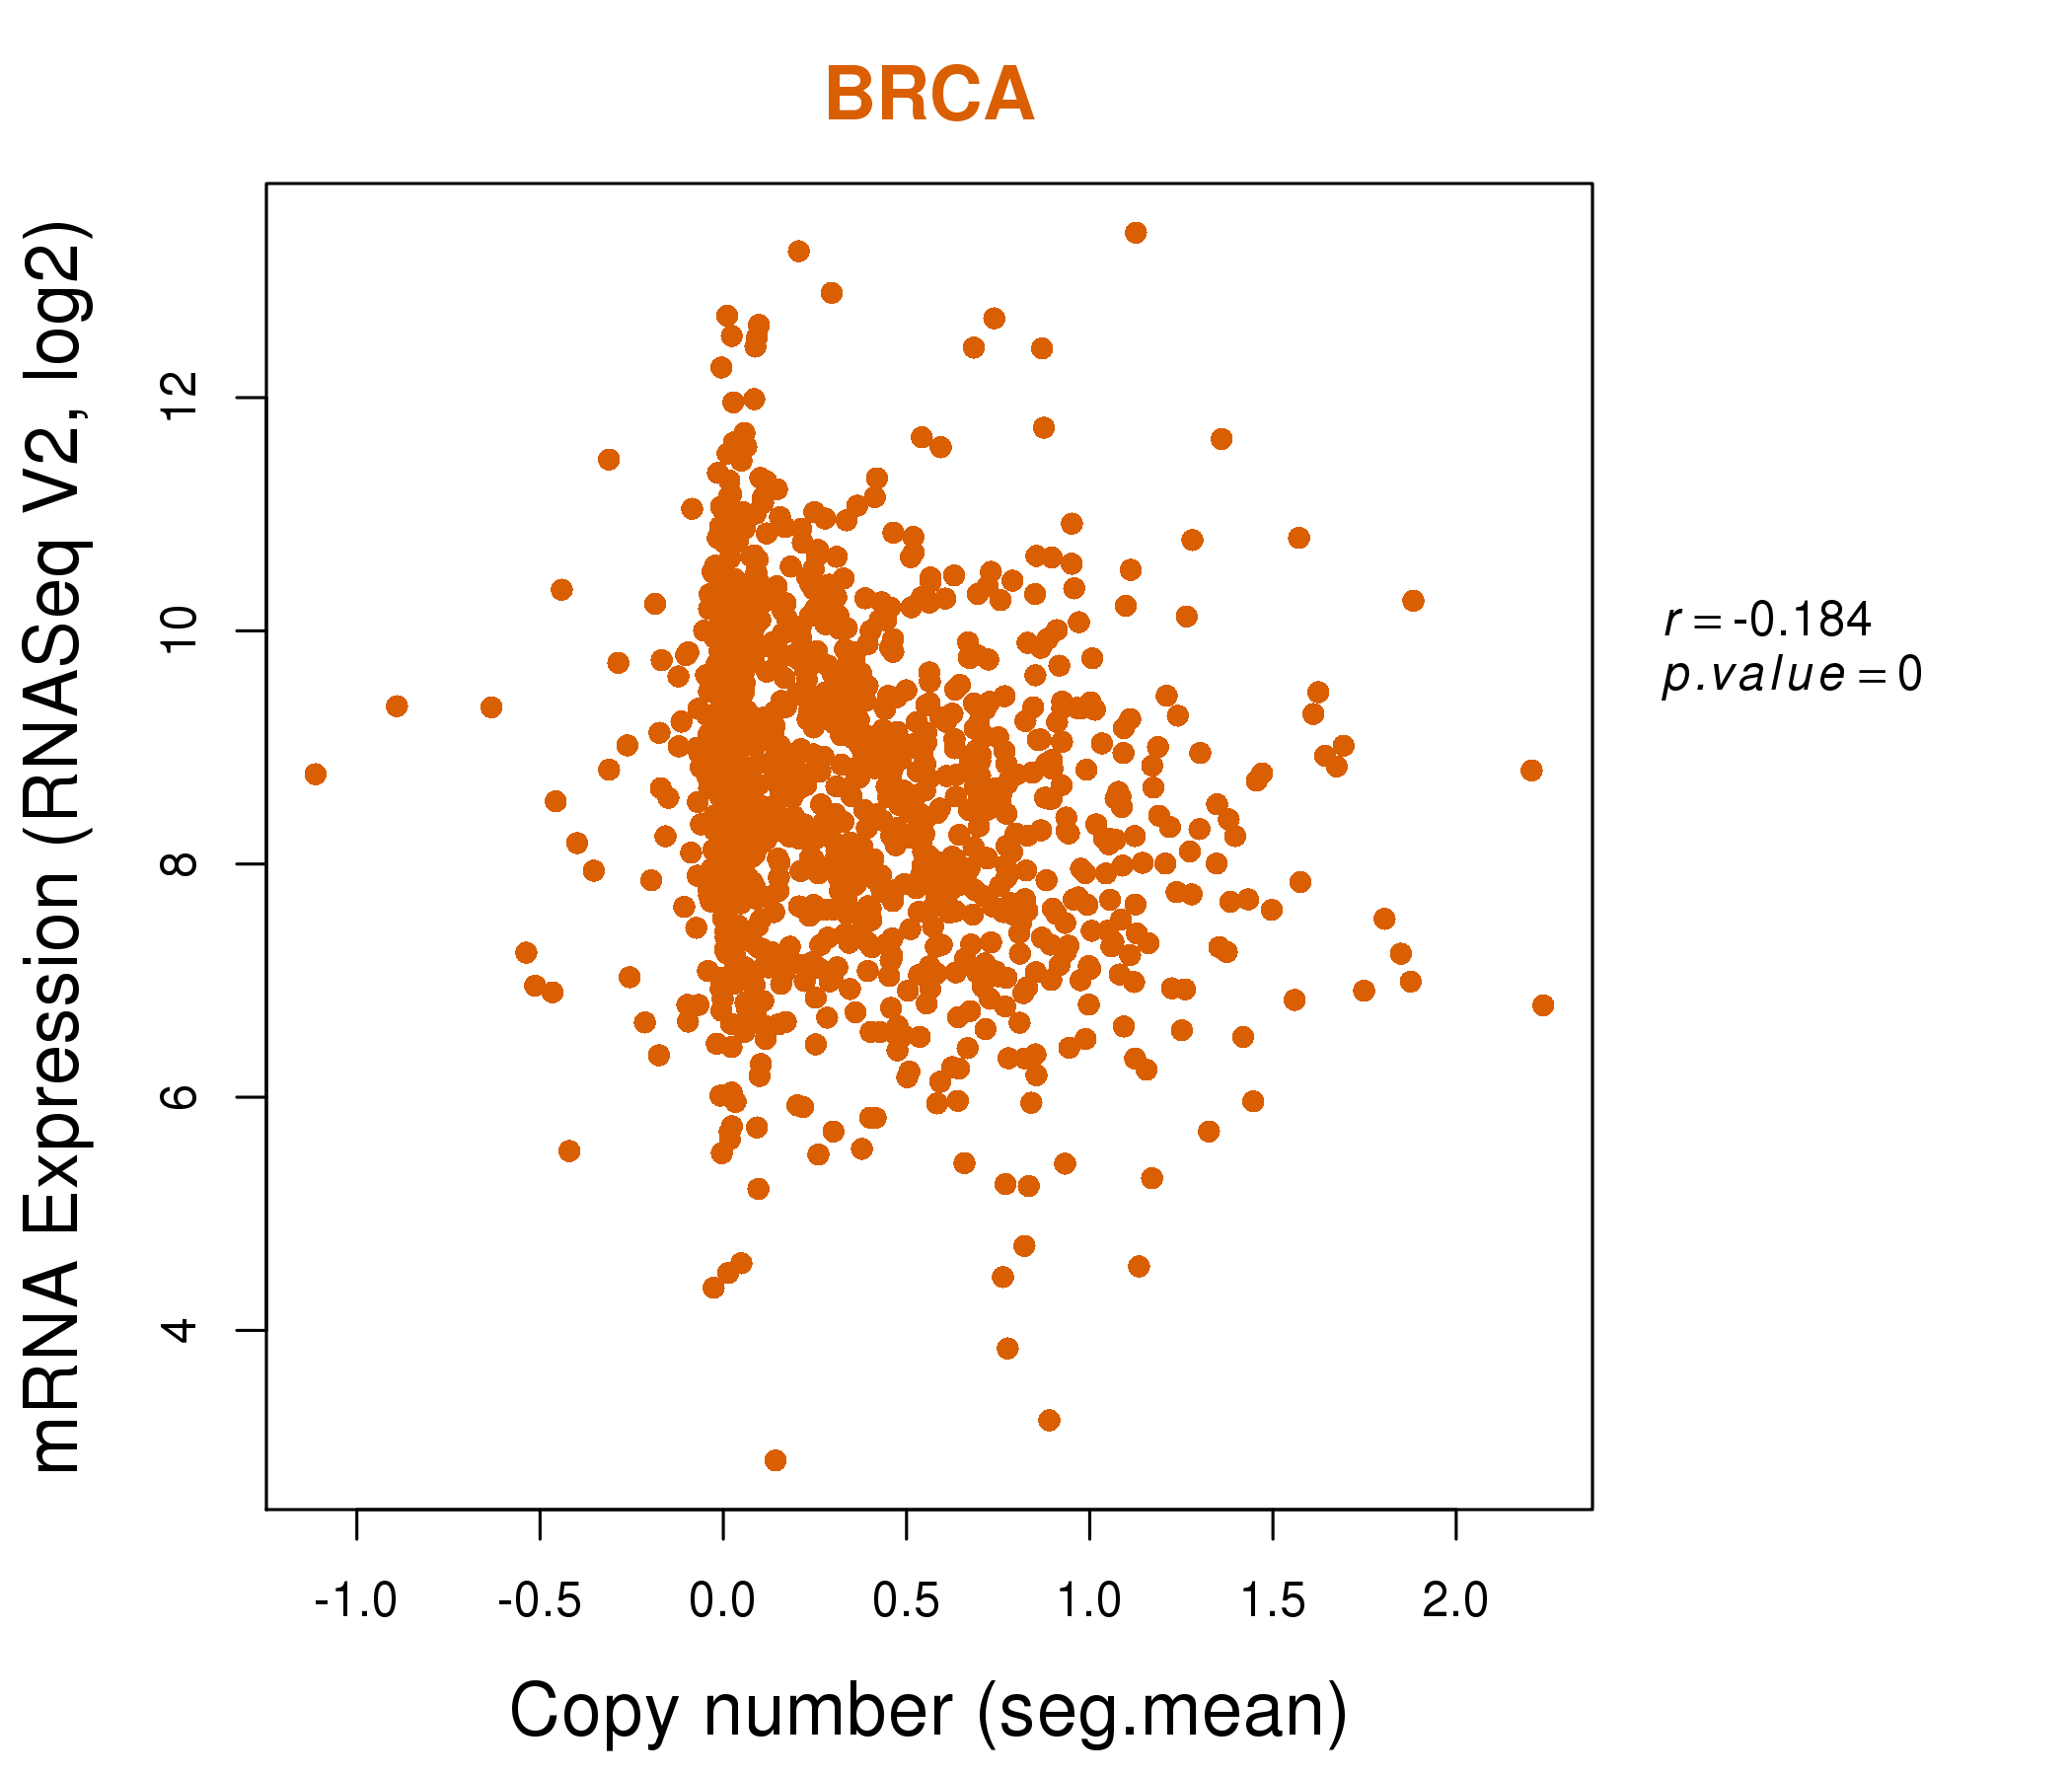
| * This plots show the correlation between CNV and gene expression. |
: Open all plots for all cancer types
 |
|
 |
|

| Top |
| Gene-Gene Network Information |
| * Co-Expression network figures were drawn using R package igraph. Only the top 20 genes with the highest correlations were shown. Red circle: input gene, orange circle: cell metabolism gene, sky circle: other gene |
: Open all plots for all cancer types
 |
|
| ABCA6,CAV1,CCDC69,CFH,CHRDL1,CLEC1A,EBF1, ENPP2,FAM43A,FLI1,GIMAP6,GIMAP8,GNG2,KCTD12, MEF2C,NPR1,PDE7B,S1PR1,SLC9A9,VWF,ZEB2 | BAALC,BMP6,C10orf128,CEP112,ELTD1,ENPP2,EPS8, ERG,LRRC8C,MCTP1,MECOM,NRP1,NUAK1,PDE2A, PTPRB,SHE,SNRK,STX2,TCF4,TGFBR2,TLR4 |
 |
|
| AKR1C4,BST1,CRHBP,CSGALNACT2,CST1,CST4,DEFB104A, DTHD1,ENPP2,GIMAP6,HAO2,LRRC69,N6AMT2,NR3C1, OR10X1,S100Z,SLC12A1,TEKT3,TMEM47,UNC5D,WIPF1 | ARHGAP28,ASCL3,BMX,CCDC129,CDH26,CHAT,COLEC12, ENPP2,FAM179B,HMHB1,HMX2,ID4,INHBB,MCTP1, MKL2,NOL8,OGDHL,PDGFRA,SCARA5,SHE,TMEM88B |
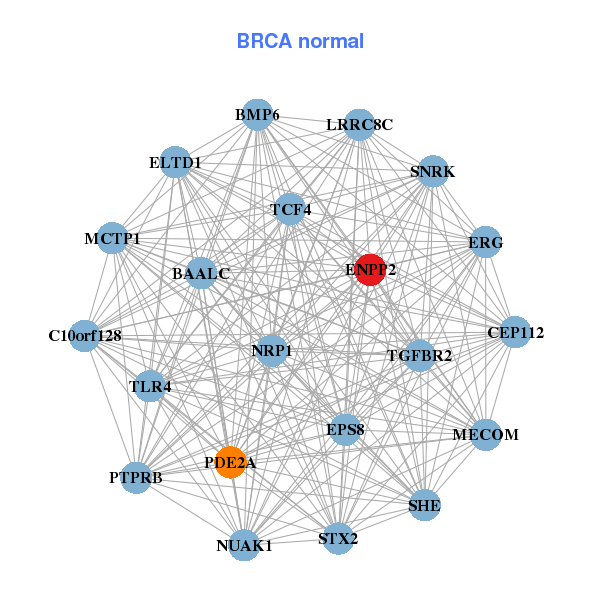
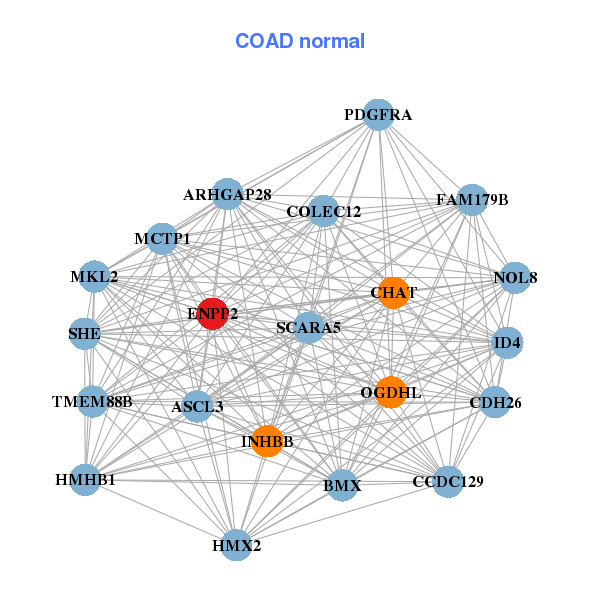
| * Co-Expression network figures were drawn using R package igraph. Only the top 20 genes with the highest correlations were shown. Red circle: input gene, orange circle: cell metabolism gene, sky circle: other gene |
: Open all plots for all cancer types
| Top |
: Open all interacting genes' information including KEGG pathway for all interacting genes from DAVID
| Top |
| Pharmacological Information for ENPP2 |
| There's no related Drug. |
| Top |
| Cross referenced IDs for ENPP2 |
| * We obtained these cross-references from Uniprot database. It covers 150 different DBs, 18 categories. http://www.uniprot.org/help/cross_references_section |
: Open all cross reference information
|
Copyright © 2016-Present - The Univsersity of Texas Health Science Center at Houston @ |