|
||||||||||||||||||||||||||||||||||||||||||||||||||||||||||||||||||||||||||||||||||||||||||||||||||||||||||||||||||||||||||||||||||||||||||||||||||||||||||||||||||||||||||||||||||||||||||||||||||||||||||||||||||||||||||||||||||||||||||||||||||||||||||||||||||||||||||||||||||||||||||||||||||||||||||||||||||||||||||
| |
| Phenotypic Information (metabolism pathway, cancer, disease, phenome) |
| |
| |
| Gene-Gene Network Information: Co-Expression Network, Interacting Genes & KEGG |
| |
|


| Gene Summary for PIK3C2A |
| Basic gene info. | Gene symbol | PIK3C2A |
| Gene name | phosphatidylinositol-4-phosphate 3-kinase, catalytic subunit type 2 alpha | |
| Synonyms | CPK|PI3-K-C2(ALPHA)|PI3-K-C2A | |
| Cytomap | UCSC genome browser: 11p15.5-p14 | |
| Genomic location | chr11 :17108123-17191354 | |
| Type of gene | protein-coding | |
| RefGenes | NM_002645.2, | |
| Ensembl id | ENSG00000011405 | |
| Description | C2-containing phosphatidylinositol kinasePI3K-C2-alphaPI3K-C2alphaphosphatidylinositol 4-phosphate 3-kinase C2 domain-containing subunit alphaphosphatidylinositol-4-phosphate 3-kinase C2 domain-containing subunit alphaphosphoinositide 3-kinase-C2-alp | |
| Modification date | 20141207 | |
| dbXrefs | MIM : 603601 | |
| HGNC : HGNC | ||
| Ensembl : ENSG00000011405 | ||
| HPRD : 04672 | ||
| Vega : OTTHUMG00000166036 | ||
| Protein | UniProt: go to UniProt's Cross Reference DB Table | |
| Expression | CleanEX: HS_PIK3C2A | |
| BioGPS: 5286 | ||
| Gene Expression Atlas: ENSG00000011405 | ||
| The Human Protein Atlas: ENSG00000011405 | ||
| Pathway | NCI Pathway Interaction Database: PIK3C2A | |
| KEGG: PIK3C2A | ||
| REACTOME: PIK3C2A | ||
| ConsensusPathDB | ||
| Pathway Commons: PIK3C2A | ||
| Metabolism | MetaCyc: PIK3C2A | |
| HUMANCyc: PIK3C2A | ||
| Regulation | Ensembl's Regulation: ENSG00000011405 | |
| miRBase: chr11 :17,108,123-17,191,354 | ||
| TargetScan: NM_002645 | ||
| cisRED: ENSG00000011405 | ||
| Context | iHOP: PIK3C2A | |
| cancer metabolism search in PubMed: PIK3C2A | ||
| UCL Cancer Institute: PIK3C2A | ||
| Assigned class in ccmGDB | C | |
| Top |
| Phenotypic Information for PIK3C2A(metabolism pathway, cancer, disease, phenome) |
| Cancer | CGAP: PIK3C2A |
| Familial Cancer Database: PIK3C2A | |
| * This gene is included in those cancer gene databases. |
|
|
|
|
|
|
| ||||||||||||||||||||||||||||||||||||||||||||||||||||||||||||||||||||||||||||||||||||||||||||||||||||||||||||||||||||||||||||||||||||||||||||||||||||||||||||||||||||||||||||||||||||||||||||||||||||||||||||||||||||||||||||||||||||||||||||||||||||||||||||||||||||||||||||||||||||||||||||||||||||||||||||||||||||
Oncogene 1 | Significant driver gene in | |||||||||||||||||||||||||||||||||||||||||||||||||||||||||||||||||||||||||||||||||||||||||||||||||||||||||||||||||||||||||||||||||||||||||||||||||||||||||||||||||||||||||||||||||||||||||||||||||||||||||||||||||||||||||||||||||||||||||||||||||||||||||||||||||||||||||||||||||||||||||||||||||||||||||||||||||||||||||
| cf) number; DB name 1 Oncogene; http://nar.oxfordjournals.org/content/35/suppl_1/D721.long, 2 Tumor Suppressor gene; https://bioinfo.uth.edu/TSGene/, 3 Cancer Gene Census; http://www.nature.com/nrc/journal/v4/n3/abs/nrc1299.html, 4 CancerGenes; http://nar.oxfordjournals.org/content/35/suppl_1/D721.long, 5 Network of Cancer Gene; http://ncg.kcl.ac.uk/index.php, 1Therapeutic Vulnerabilities in Cancer; http://cbio.mskcc.org/cancergenomics/statius/ |
| KEGG_INOSITOL_PHOSPHATE_METABOLISM REACTOME_PHOSPHOLIPID_METABOLISM REACTOME_PI_METABOLISM REACTOME_METABOLISM_OF_LIPIDS_AND_LIPOPROTEINS | |
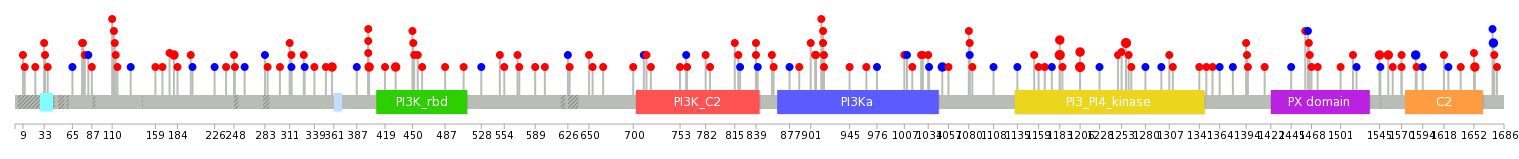
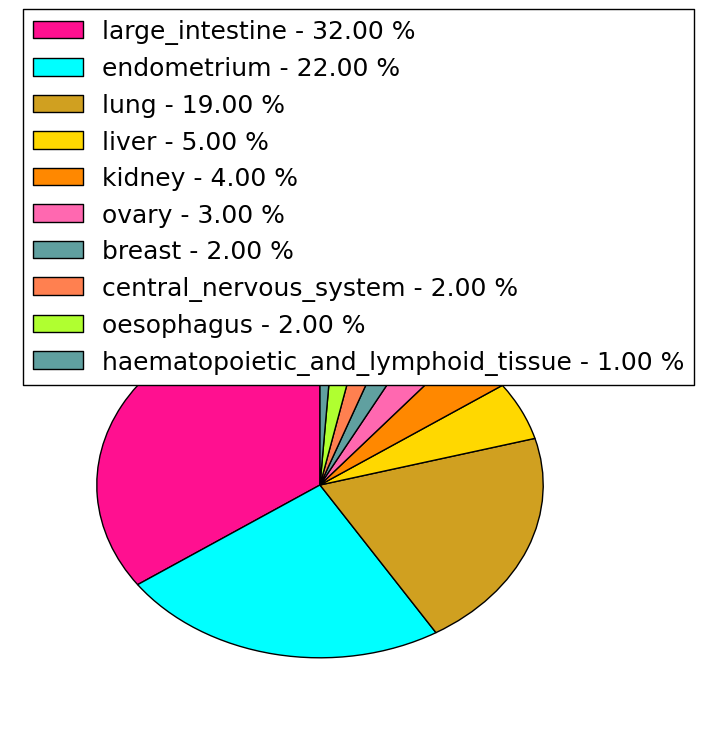
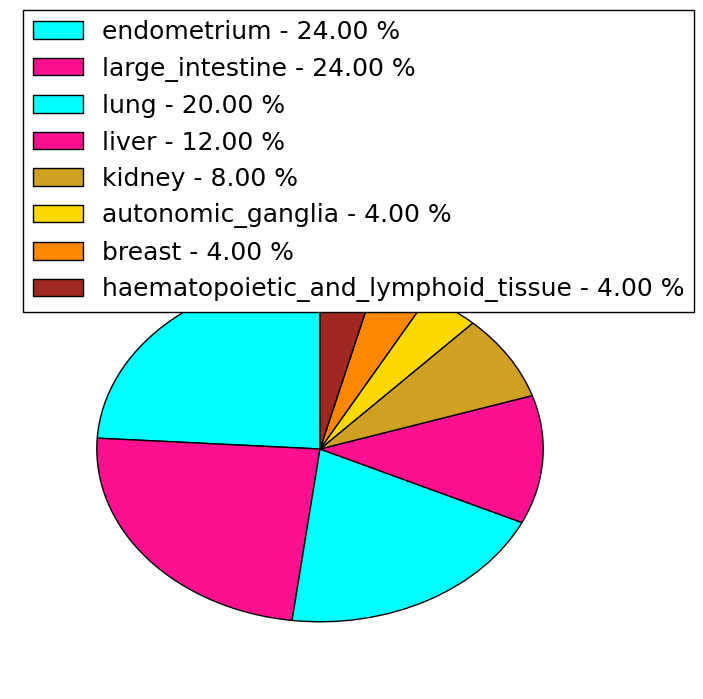
| Mutations for PIK3C2A |
| * Under tables are showing count per each tissue to give us broad intuition about tissue specific mutation patterns.You can go to the detailed page for each mutation database's web site. |
| - Statistics for Tissue and Mutation type | Top |
 |
| - For Inter-chromosomal Variations |
| There's no inter-chromosomal structural variation. |
| - For Intra-chromosomal Variations |
| * Intra-chromosomal variantions includes 'intrachromosomal amplicon to amplicon', 'intrachromosomal amplicon to non-amplified dna', 'intrachromosomal deletion', 'intrachromosomal fold-back inversion', 'intrachromosomal inversion', 'intrachromosomal tandem duplication', 'Intrachromosomal unknown type', 'intrachromosomal with inverted orientation', 'intrachromosomal with non-inverted orientation'. |
 |
| Sample | Symbol_a | Chr_a | Start_a | End_a | Symbol_b | Chr_b | Start_b | End_b |
| ovary | PIK3C2A | chr11 | 17139746 | 17139766 | PLEKHA7 | chr11 | 17035259 | 17035279 |
| cf) Tissue number; Tissue name (1;Breast, 2;Central_nervous_system, 3;Haematopoietic_and_lymphoid_tissue, 4;Large_intestine, 5;Liver, 6;Lung, 7;Ovary, 8;Pancreas, 9;Prostate, 10;Skin, 11;Soft_tissue, 12;Upper_aerodigestive_tract) |
| * From mRNA Sanger sequences, Chitars2.0 arranged chimeric transcripts. This table shows PIK3C2A related fusion information. |
| ID | Head Gene | Tail Gene | Accession | Gene_a | qStart_a | qEnd_a | Chromosome_a | tStart_a | tEnd_a | Gene_a | qStart_a | qEnd_a | Chromosome_a | tStart_a | tEnd_a |
| BM461728 | PIK3C2A | 1 | 312 | 11 | 17110033 | 17110344 | CNN2 | 307 | 606 | 19 | 1038327 | 1038624 | |
| Top |
| Mutation type/ Tissue ID | brca | cns | cerv | endome | haematopo | kidn | Lintest | liver | lung | ns | ovary | pancre | prost | skin | stoma | thyro | urina | |||
| Total # sample | 1 | |||||||||||||||||||
| GAIN (# sample) | 1 | |||||||||||||||||||
| LOSS (# sample) |
| cf) Tissue ID; Tissue type (1; Breast, 2; Central_nervous_system, 3; Cervix, 4; Endometrium, 5; Haematopoietic_and_lymphoid_tissue, 6; Kidney, 7; Large_intestine, 8; Liver, 9; Lung, 10; NS, 11; Ovary, 12; Pancreas, 13; Prostate, 14; Skin, 15; Stomach, 16; Thyroid, 17; Urinary_tract) |
| Top |
|
 |
| Top |
| Stat. for Non-Synonymous SNVs (# total SNVs=106) | (# total SNVs=25) |
 |  |
(# total SNVs=2) | (# total SNVs=2) |
 |  |
| Top |
| * When you move the cursor on each content, you can see more deailed mutation information on the Tooltip. Those are primary_site,primary_histology,mutation(aa),pubmedID. |
| GRCh37 position | Mutation(aa) | Unique sampleID count |
| chr11:17126781-17126781 | p.F1206L | 3 |
| chr11:17124287-17124287 | p.L1258R | 3 |
| chr11:17126850-17126850 | p.M1183V | 3 |
| chr11:17143877-17143877 | p.D839H | 2 |
| chr11:17141435-17141435 | p.S915I | 2 |
| chr11:17134214-17134214 | p.? | 2 |
| chr11:17113001-17113001 | p.T1586T | 2 |
| chr11:17190751-17190751 | p.P180S | 2 |
| chr11:17111324-17111324 | p.T1674T | 2 |
| chr11:17113137-17113137 | p.R1570Q | 2 |
| Top |
|
 |
| Point Mutation/ Tissue ID | 1 | 2 | 3 | 4 | 5 | 6 | 7 | 8 | 9 | 10 | 11 | 12 | 13 | 14 | 15 | 16 | 17 | 18 | 19 | 20 |
| # sample | 6 | 4 | 25 | 6 | 4 | 4 | 2 | 10 | 7 | 3 | 10 | 12 | 2 | 19 | ||||||
| # mutation | 6 | 4 | 21 | 5 | 4 | 4 | 2 | 12 | 9 | 3 | 10 | 13 | 2 | 30 | ||||||
| nonsynonymous SNV | 5 | 3 | 18 | 4 | 3 | 2 | 2 | 12 | 8 | 3 | 5 | 6 | 1 | 24 | ||||||
| synonymous SNV | 1 | 1 | 3 | 2 | 1 | 2 | 1 | 5 | 7 | 1 | 6 |
| cf) Tissue ID; Tissue type (1; BLCA[Bladder Urothelial Carcinoma], 2; BRCA[Breast invasive carcinoma], 3; CESC[Cervical squamous cell carcinoma and endocervical adenocarcinoma], 4; COAD[Colon adenocarcinoma], 5; GBM[Glioblastoma multiforme], 6; Glioma Low Grade, 7; HNSC[Head and Neck squamous cell carcinoma], 8; KICH[Kidney Chromophobe], 9; KIRC[Kidney renal clear cell carcinoma], 10; KIRP[Kidney renal papillary cell carcinoma], 11; LAML[Acute Myeloid Leukemia], 12; LUAD[Lung adenocarcinoma], 13; LUSC[Lung squamous cell carcinoma], 14; OV[Ovarian serous cystadenocarcinoma ], 15; PAAD[Pancreatic adenocarcinoma], 16; PRAD[Prostate adenocarcinoma], 17; SKCM[Skin Cutaneous Melanoma], 18:STAD[Stomach adenocarcinoma], 19:THCA[Thyroid carcinoma], 20:UCEC[Uterine Corpus Endometrial Carcinoma]) |
| Top |
| * We represented just top 10 SNVs. When you move the cursor on each content, you can see more deailed mutation information on the Tooltip. Those are primary_site, primary_histology, mutation(aa), pubmedID. |
| Genomic Position | Mutation(aa) | Unique sampleID count |
| chr11:17141433 | p.A916T | 3 |
| chr11:17126780 | p.F1206S | 2 |
| chr11:17126781 | p.F1206L | 2 |
| chr11:17126848 | p.T1050T | 2 |
| chr11:17126850 | p.M1183I | 2 |
| chr11:17172170 | p.M1183V | 2 |
| chr11:17139104 | p.L1018M | 2 |
| chr11:17124220 | p.R1570L | 2 |
| chr11:17113137 | p.T1555A | 2 |
| chr11:17113183 | p.P199L | 2 |
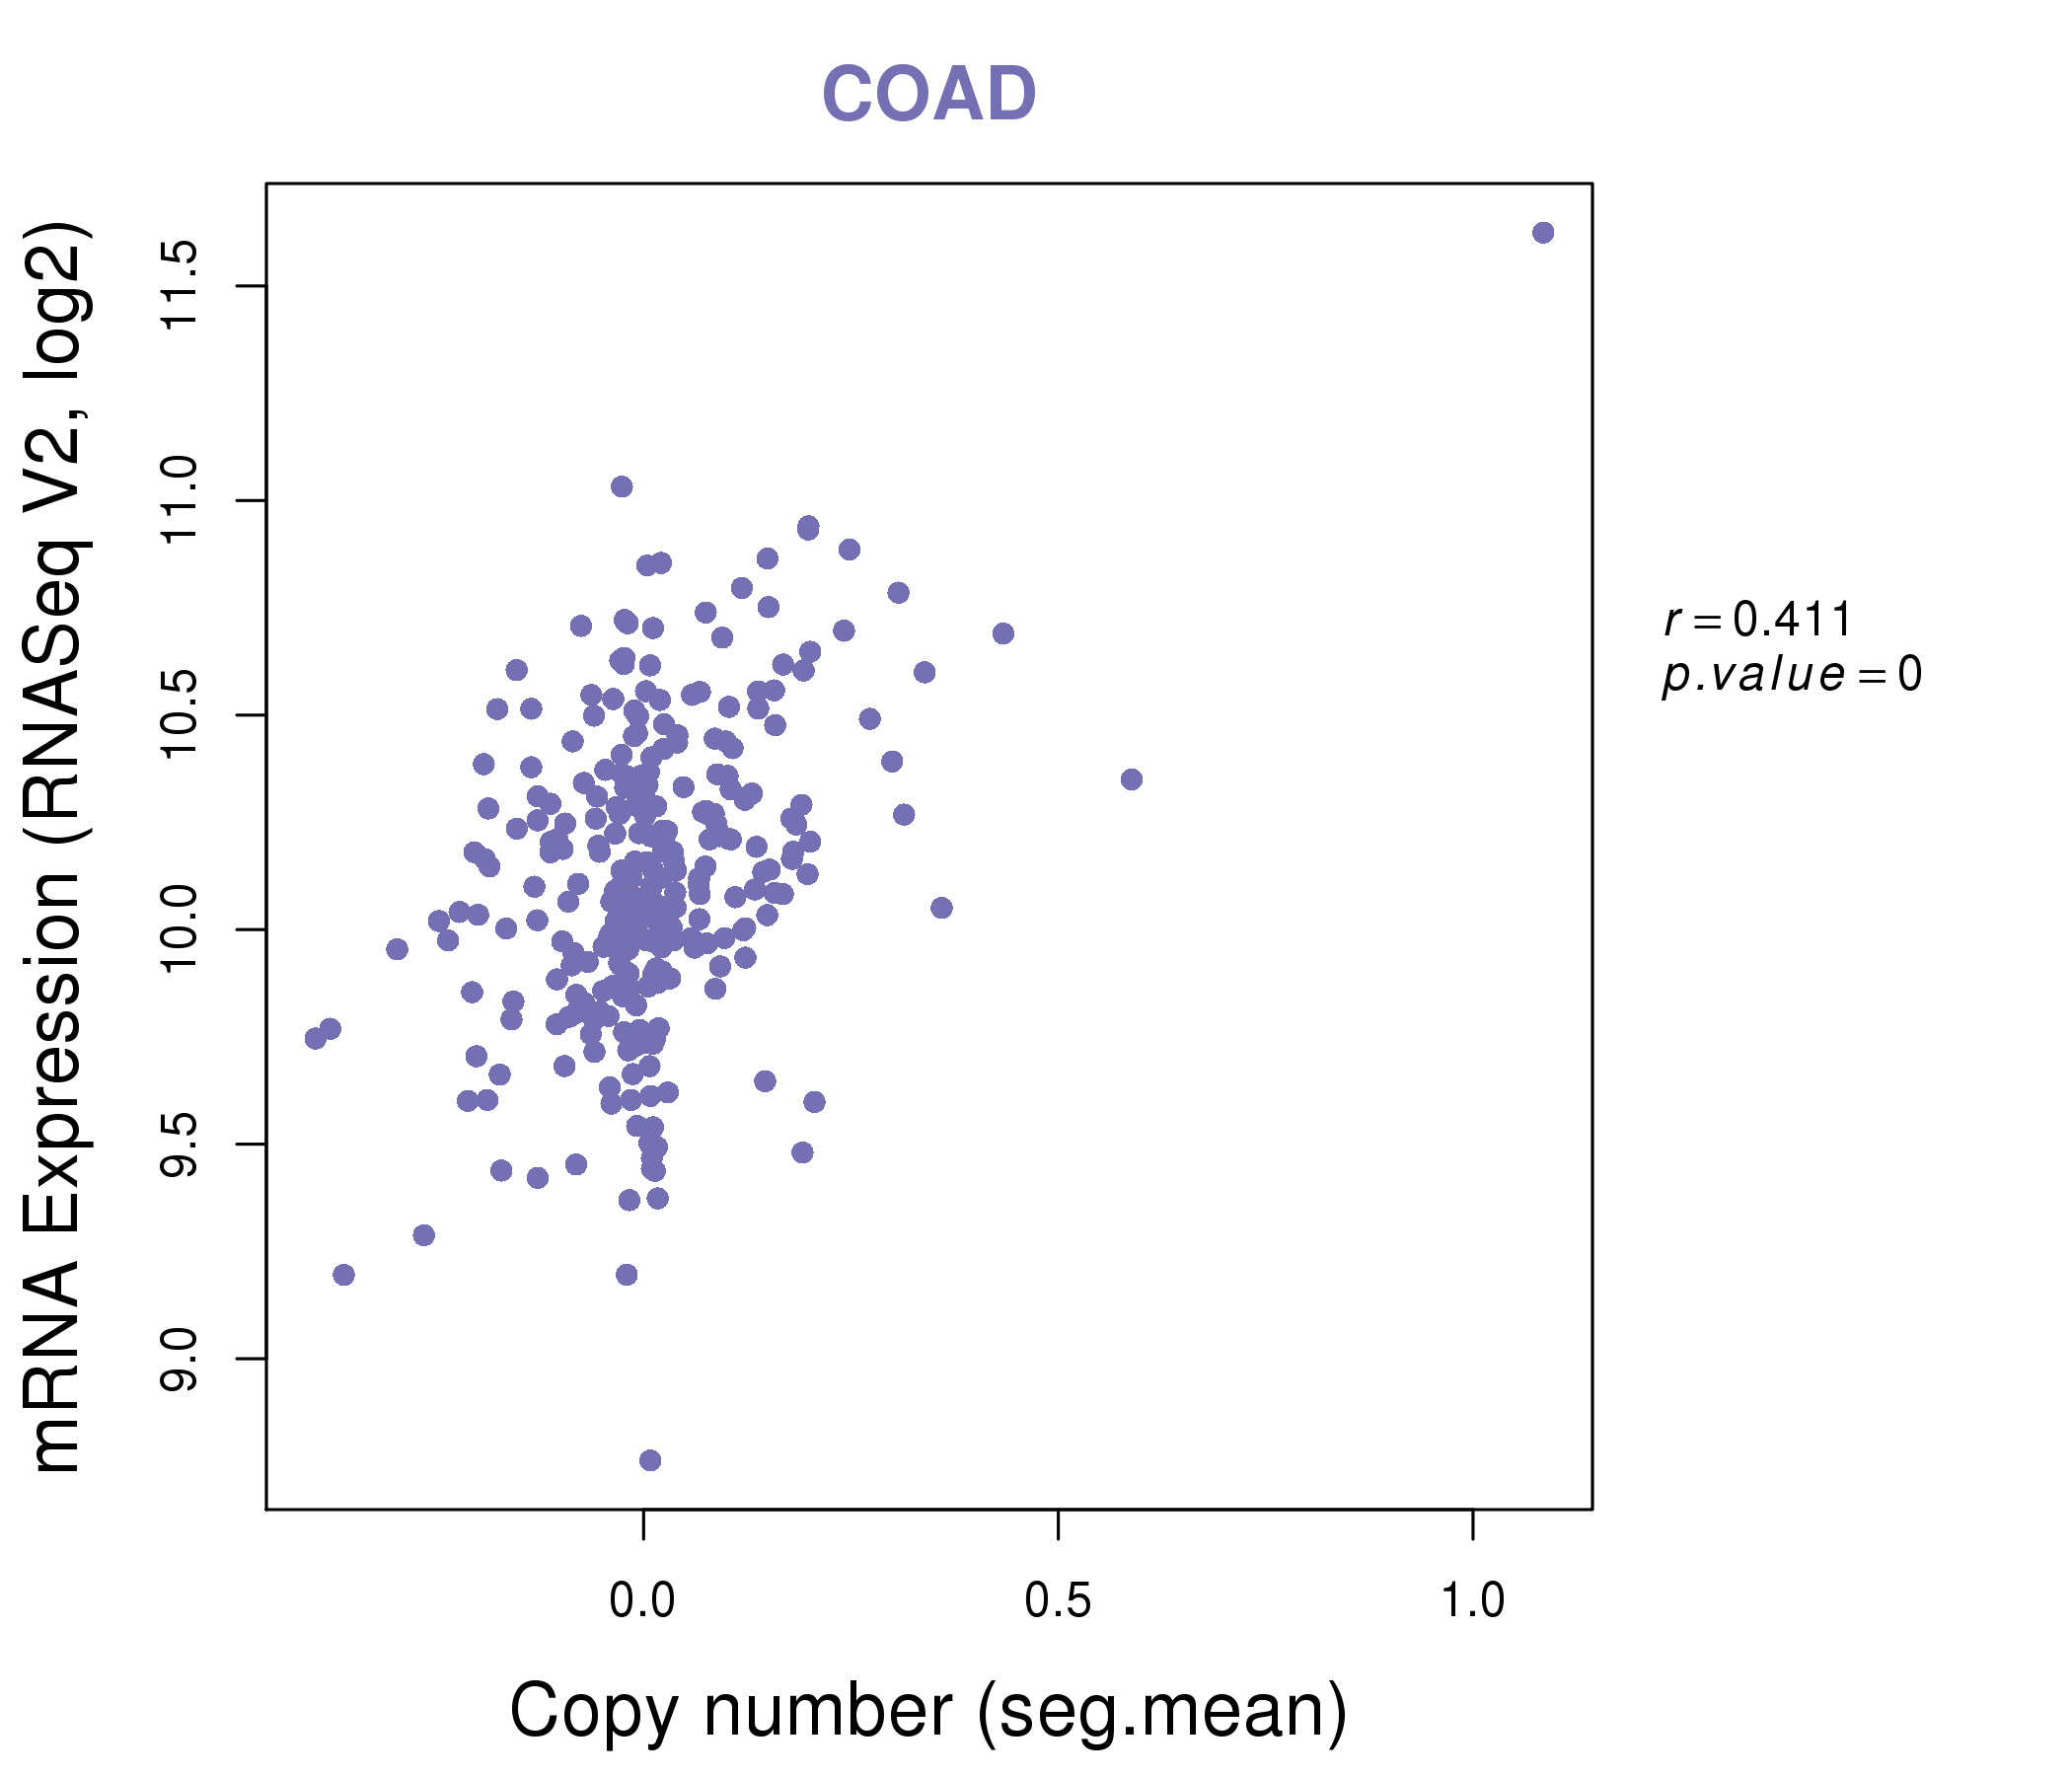
| * Copy number data were extracted from TCGA using R package TCGA-Assembler. The URLs of all public data files on TCGA DCC data server were gathered on Jan-05-2015. Function ProcessCNAData in TCGA-Assembler package was used to obtain gene-level copy number value which is calculated as the average copy number of the genomic region of a gene. |
 |
| cf) Tissue ID[Tissue type]: BLCA[Bladder Urothelial Carcinoma], BRCA[Breast invasive carcinoma], CESC[Cervical squamous cell carcinoma and endocervical adenocarcinoma], COAD[Colon adenocarcinoma], GBM[Glioblastoma multiforme], Glioma Low Grade, HNSC[Head and Neck squamous cell carcinoma], KICH[Kidney Chromophobe], KIRC[Kidney renal clear cell carcinoma], KIRP[Kidney renal papillary cell carcinoma], LAML[Acute Myeloid Leukemia], LUAD[Lung adenocarcinoma], LUSC[Lung squamous cell carcinoma], OV[Ovarian serous cystadenocarcinoma ], PAAD[Pancreatic adenocarcinoma], PRAD[Prostate adenocarcinoma], SKCM[Skin Cutaneous Melanoma], STAD[Stomach adenocarcinoma], THCA[Thyroid carcinoma], UCEC[Uterine Corpus Endometrial Carcinoma] |
| Top |
| Gene Expression for PIK3C2A |
| * CCLE gene expression data were extracted from CCLE_Expression_Entrez_2012-10-18.res: Gene-centric RMA-normalized mRNA expression data. |
 |
| * Normalized gene expression data of RNASeqV2 was extracted from TCGA using R package TCGA-Assembler. The URLs of all public data files on TCGA DCC data server were gathered at Jan-05-2015. Only eight cancer types have enough normal control samples for differential expression analysis. (t test, adjusted p<0.05 (using Benjamini-Hochberg FDR)) |
 |
| Top |
| * This plots show the correlation between CNV and gene expression. |
: Open all plots for all cancer types
 |
|
 |
|


| Top |
| Gene-Gene Network Information |
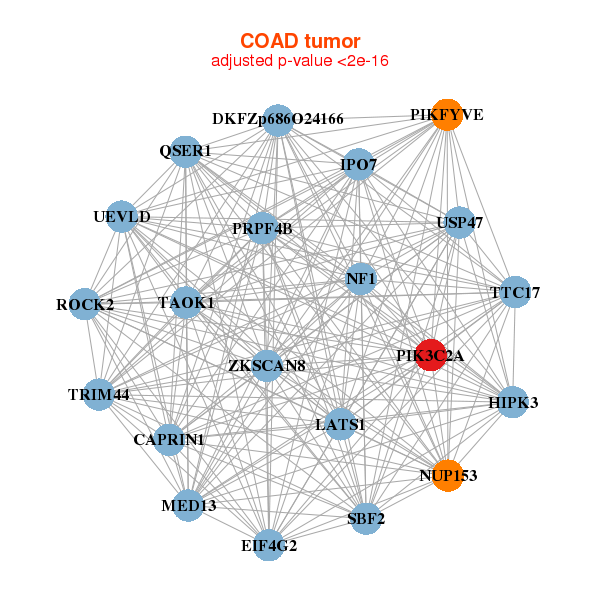
| * Co-Expression network figures were drawn using R package igraph. Only the top 20 genes with the highest correlations were shown. Red circle: input gene, orange circle: cell metabolism gene, sky circle: other gene |
: Open all plots for all cancer types
 |
|
| AFF4,APC,ATRX,BOD1L1,ERCC6L2,CCNT1,CLOCK, DMXL1,DNAJB14,DPP8,HIPK3,KIAA1109,LATS1,LCOR, MAP3K2,PIK3C2A,REST,SPTY2D1,TTBK2,UEVLD,USP47 | ACAP2,AKAP11,ANKIB1,ATRX,BMPR2,CAMSAP2,DENND4C, DICER1,DMXL1,DNAJB14,FRYL,HIPK1,ITCH,RIC1, MAP3K2,MKLN1,PIK3C2A,PIKFYVE,POLK,TRPM7,VPS13C |
 |
|
| CAPRIN1,DKFZp686O24166,EIF4G2,HIPK3,IPO7,LATS1,MED13, NF1,NUP153,PIK3C2A,PIKFYVE,PRPF4B,QSER1,ROCK2, SBF2,TAOK1,TRIM44,TTC17,UEVLD,USP47,ZKSCAN8 | AKAP11,ASH1L,ATRX,DICER1,LRP6,LYST,MAN1A2, MIB1,PBRM1,PHIP,PIK3C2A,PTPRG,ROCK1,NEMF, SNTB2,TANC1,TAOK1,TRIM33,UBR1,UBR3,WDFY3 |
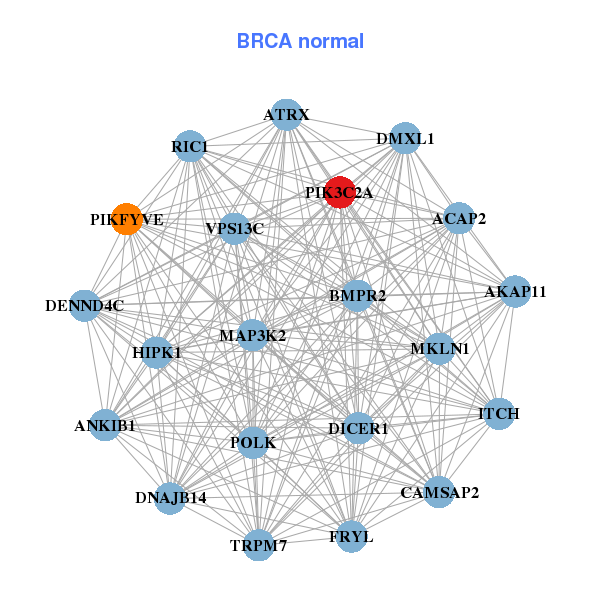
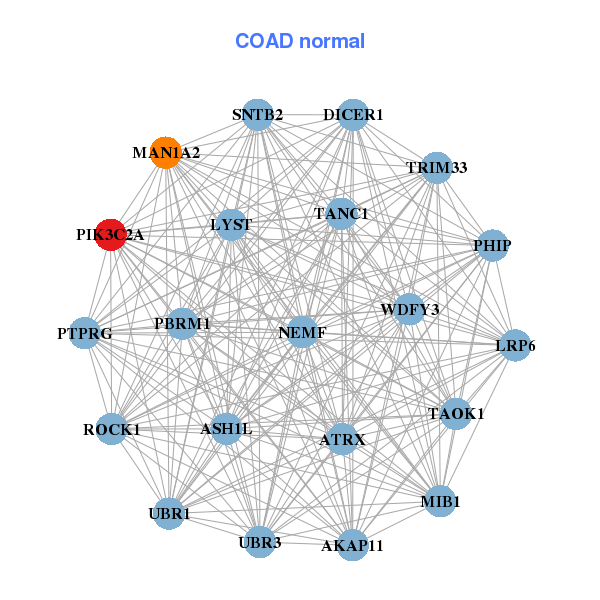
| * Co-Expression network figures were drawn using R package igraph. Only the top 20 genes with the highest correlations were shown. Red circle: input gene, orange circle: cell metabolism gene, sky circle: other gene |
: Open all plots for all cancer types
| Top |
: Open all interacting genes' information including KEGG pathway for all interacting genes from DAVID
| Top |
| Pharmacological Information for PIK3C2A |
| There's no related Drug. |
| Top |
| Cross referenced IDs for PIK3C2A |
| * We obtained these cross-references from Uniprot database. It covers 150 different DBs, 18 categories. http://www.uniprot.org/help/cross_references_section |
: Open all cross reference information
|
Copyright © 2016-Present - The Univsersity of Texas Health Science Center at Houston @ |