|
||||||||||||||||||||
| |
| Phenotypic Information (metabolism pathway, cancer, disease, phenome) |
| |
| |
| Gene-Gene Network Information: Co-Expression Network, Interacting Genes & KEGG |
| |
|


| Gene Summary for UGGT1 |
| Top |
| Phenotypic Information for UGGT1(metabolism pathway, cancer, disease, phenome) |
| Cancer | CGAP: UGGT1 |
| Familial Cancer Database: UGGT1 | |
| * This gene is included in those cancer gene databases. |
|
|
|
|
|
| . | ||||||||||||||
Oncogene 1 | Significant driver gene in | |||||||||||||||||||
| cf) number; DB name 1 Oncogene; http://nar.oxfordjournals.org/content/35/suppl_1/D721.long, 2 Tumor Suppressor gene; https://bioinfo.uth.edu/TSGene/, 3 Cancer Gene Census; http://www.nature.com/nrc/journal/v4/n3/abs/nrc1299.html, 4 CancerGenes; http://nar.oxfordjournals.org/content/35/suppl_1/D721.long, 5 Network of Cancer Gene; http://ncg.kcl.ac.uk/index.php, 1Therapeutic Vulnerabilities in Cancer; http://cbio.mskcc.org/cancergenomics/statius/ |
| REACTOME_METABOLISM_OF_PROTEINS | |
| OMIM | |
| Orphanet | |
| Disease | KEGG Disease: UGGT1 |
| MedGen: UGGT1 (Human Medical Genetics with Condition) | |
| ClinVar: UGGT1 | |
| Phenotype | MGI: UGGT1 (International Mouse Phenotyping Consortium) |
| PhenomicDB: UGGT1 | |
| Mutations for UGGT1 |
| * Under tables are showing count per each tissue to give us broad intuition about tissue specific mutation patterns.You can go to the detailed page for each mutation database's web site. |
| There's no structural variation information in COSMIC data for this gene. |
| * From mRNA Sanger sequences, Chitars2.0 arranged chimeric transcripts. This table shows UGGT1 related fusion information. |
| ID | Head Gene | Tail Gene | Accession | Gene_a | qStart_a | qEnd_a | Chromosome_a | tStart_a | tEnd_a | Gene_a | qStart_a | qEnd_a | Chromosome_a | tStart_a | tEnd_a |
| BE930748 | ISM1 | 1 | 69 | 20 | 13275832 | 13275932 | UGGT1 | 66 | 305 | 2 | 128939832 | 128944349 | |
| BI041241 | VASH1 | 1 | 145 | 14 | 77249194 | 77249339 | UGGT1 | 131 | 207 | 2 | 128950162 | 128950238 | |
| BE881501 | UGGT1 | 1 | 449 | 2 | 128947371 | 128947822 | RPL36 | 442 | 485 | 19 | 5691635 | 5691678 | |
| BM463172 | UGGT1 | 8 | 193 | 2 | 128951479 | 128951664 | UGGT1 | 189 | 872 | 2 | 128949366 | 128950040 | |
| AI148255 | SLC30A6 | 7 | 303 | 2 | 32446512 | 32446808 | UGGT1 | 302 | 395 | 2 | 128948993 | 128949086 | |
| AK025416 | C10orf99 | 1 | 575 | 10 | 85933494 | 85944737 | UGGT1 | 571 | 2042 | 2 | 128951780 | 128953251 | |
| Top |
| There's no copy number variation information in COSMIC data for this gene. |
| Top |
|
 |
| Top |
| Stat. for Non-Synonymous SNVs (# total SNVs=114) | (# total SNVs=26) |
 |  |
(# total SNVs=1) | (# total SNVs=0) |
 |
| Top |
| * When you move the cursor on each content, you can see more deailed mutation information on the Tooltip. Those are primary_site,primary_histology,mutation(aa),pubmedID. |
| GRCh37 position | Mutation(aa) | Unique sampleID count |
| chr2:128936143-128936143 | p.R1272H | 3 |
| chr2:128886622-128886622 | p.N416D | 3 |
| chr2:128945049-128945049 | p.P1501P | 3 |
| chr2:128944281-128944281 | p.Q1462* | 2 |
| chr2:128927915-128927915 | p.V992G | 2 |
| chr2:128913089-128913089 | p.R722G | 2 |
| chr2:128886624-128886624 | p.N416N | 2 |
| chr2:128934401-128934401 | p.D1185N | 2 |
| chr2:128867254-128867254 | p.S152L | 2 |
| chr2:128867271-128867271 | p.T158A | 2 |
| Top |
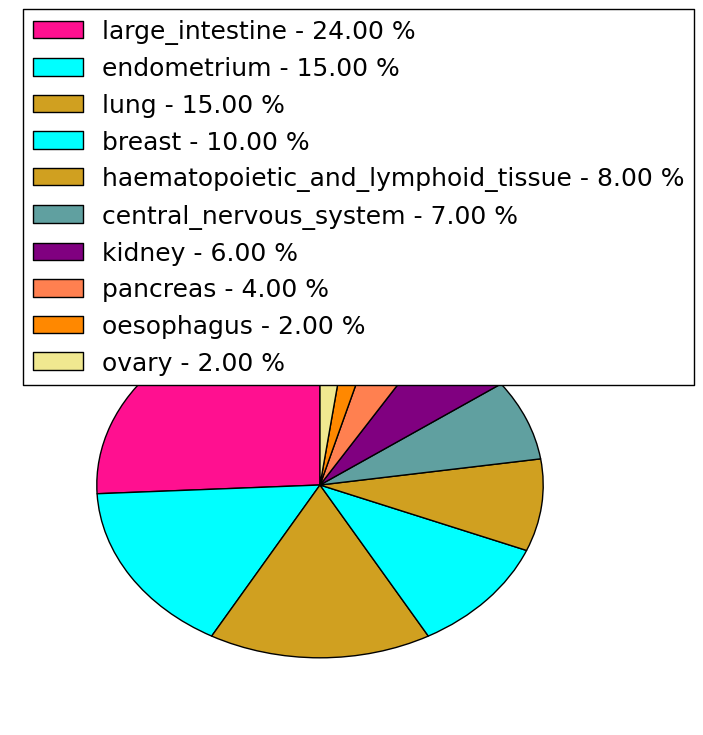
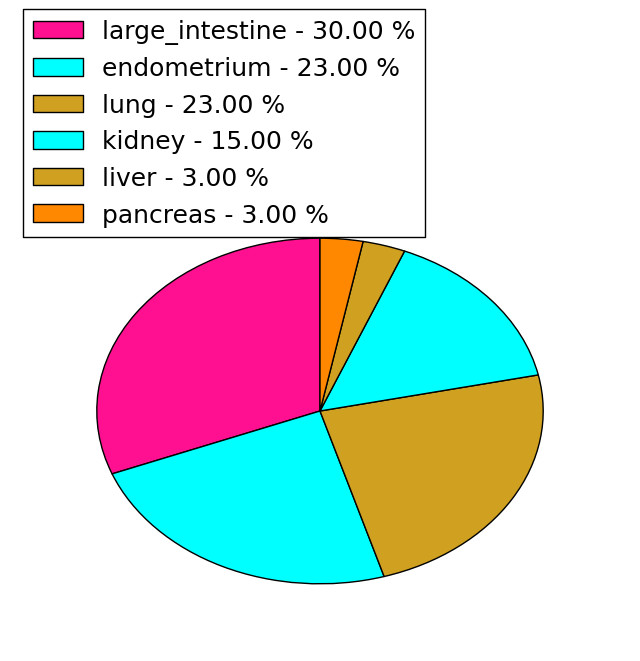
|
 |
| Point Mutation/ Tissue ID | 1 | 2 | 3 | 4 | 5 | 6 | 7 | 8 | 9 | 10 | 11 | 12 | 13 | 14 | 15 | 16 | 17 | 18 | 19 | 20 |
| # sample | 6 | 2 | 1 | 25 | 3 | 3 | 7 | 1 | 11 | 6 | 2 | 12 | 8 | 17 | ||||||
| # mutation | 6 | 2 | 1 | 26 | 3 | 3 | 8 | 1 | 11 | 6 | 2 | 13 | 9 | 24 | ||||||
| nonsynonymous SNV | 5 | 2 | 1 | 21 | 3 | 1 | 4 | 8 | 4 | 2 | 9 | 8 | 18 | |||||||
| synonymous SNV | 1 | 5 | 2 | 4 | 1 | 3 | 2 | 4 | 1 | 6 |
| cf) Tissue ID; Tissue type (1; BLCA[Bladder Urothelial Carcinoma], 2; BRCA[Breast invasive carcinoma], 3; CESC[Cervical squamous cell carcinoma and endocervical adenocarcinoma], 4; COAD[Colon adenocarcinoma], 5; GBM[Glioblastoma multiforme], 6; Glioma Low Grade, 7; HNSC[Head and Neck squamous cell carcinoma], 8; KICH[Kidney Chromophobe], 9; KIRC[Kidney renal clear cell carcinoma], 10; KIRP[Kidney renal papillary cell carcinoma], 11; LAML[Acute Myeloid Leukemia], 12; LUAD[Lung adenocarcinoma], 13; LUSC[Lung squamous cell carcinoma], 14; OV[Ovarian serous cystadenocarcinoma ], 15; PAAD[Pancreatic adenocarcinoma], 16; PRAD[Prostate adenocarcinoma], 17; SKCM[Skin Cutaneous Melanoma], 18:STAD[Stomach adenocarcinoma], 19:THCA[Thyroid carcinoma], 20:UCEC[Uterine Corpus Endometrial Carcinoma]) |
| Top |
| * We represented just top 10 SNVs. When you move the cursor on each content, you can see more deailed mutation information on the Tooltip. Those are primary_site, primary_histology, mutation(aa), pubmedID. |
| Genomic Position | Mutation(aa) | Unique sampleID count |
| chr2:128886622 | p.N416D | 4 |
| chr2:128867254 | p.S152L | 2 |
| chr2:128886624 | p.N416N | 2 |
| chr2:128922363 | p.A554T | 1 |
| chr2:128939716 | p.T822T | 1 |
| chr2:128865573 | p.G983G | 1 |
| chr2:128890754 | p.Q1210H | 1 |
| chr2:128930222 | p.P142H | 1 |
| chr2:128947294 | p.L1417L | 1 |
| chr2:128870740 | p.L301L | 1 |
| * Copy number data were extracted from TCGA using R package TCGA-Assembler. The URLs of all public data files on TCGA DCC data server were gathered on Jan-05-2015. Function ProcessCNAData in TCGA-Assembler package was used to obtain gene-level copy number value which is calculated as the average copy number of the genomic region of a gene. |
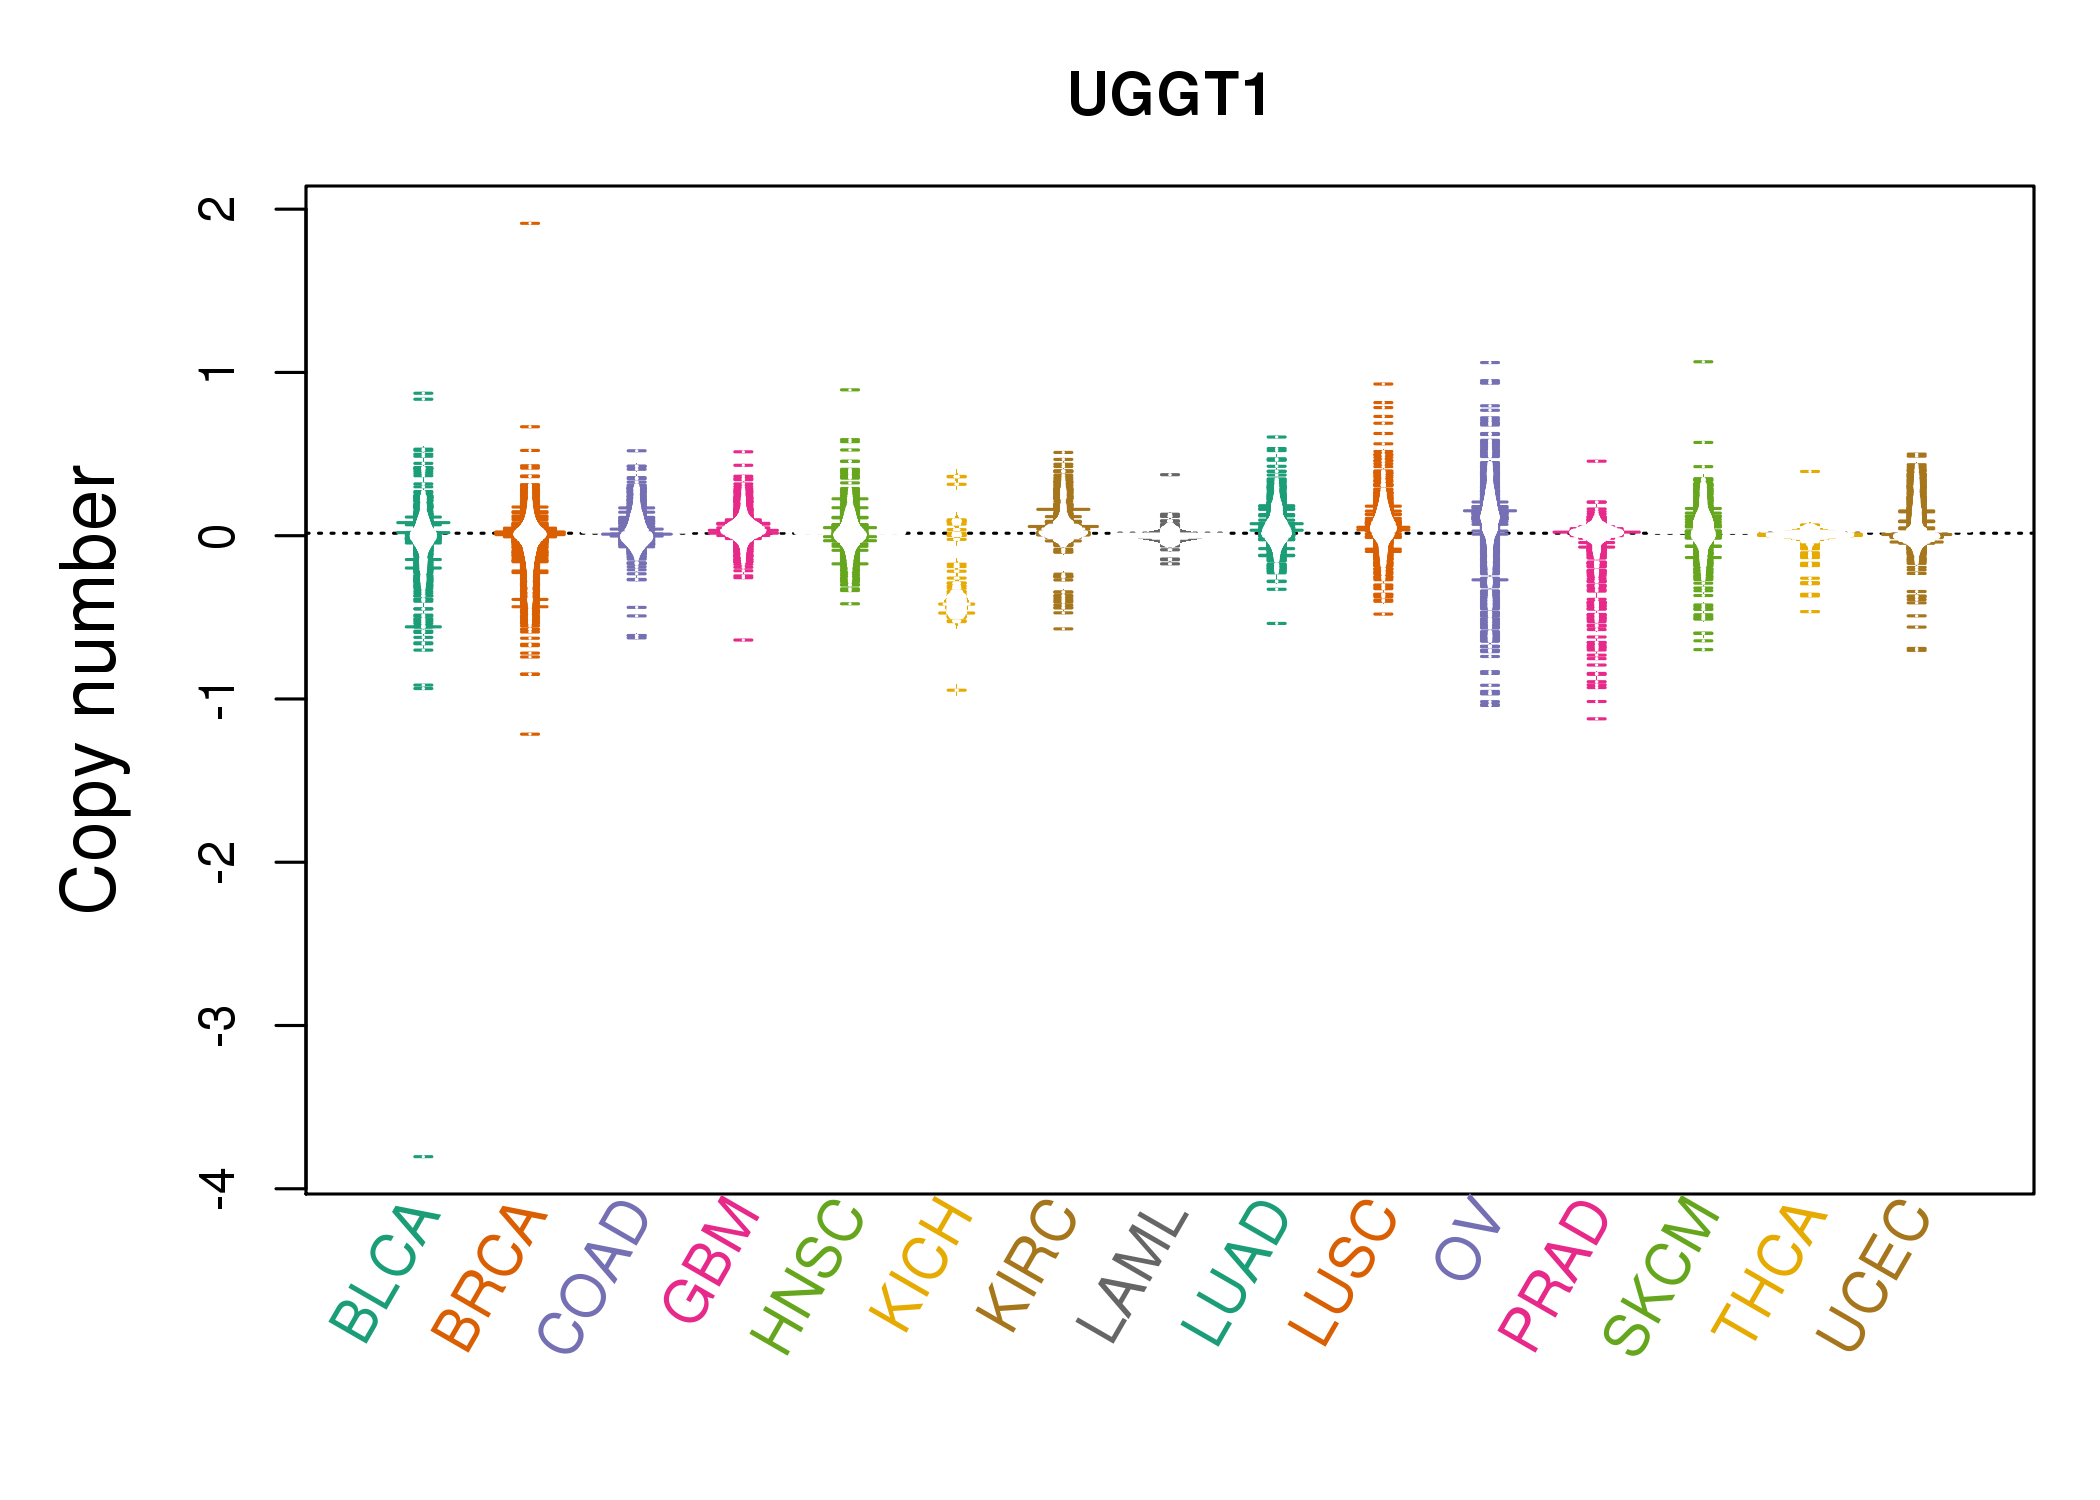 |
| cf) Tissue ID[Tissue type]: BLCA[Bladder Urothelial Carcinoma], BRCA[Breast invasive carcinoma], CESC[Cervical squamous cell carcinoma and endocervical adenocarcinoma], COAD[Colon adenocarcinoma], GBM[Glioblastoma multiforme], Glioma Low Grade, HNSC[Head and Neck squamous cell carcinoma], KICH[Kidney Chromophobe], KIRC[Kidney renal clear cell carcinoma], KIRP[Kidney renal papillary cell carcinoma], LAML[Acute Myeloid Leukemia], LUAD[Lung adenocarcinoma], LUSC[Lung squamous cell carcinoma], OV[Ovarian serous cystadenocarcinoma ], PAAD[Pancreatic adenocarcinoma], PRAD[Prostate adenocarcinoma], SKCM[Skin Cutaneous Melanoma], STAD[Stomach adenocarcinoma], THCA[Thyroid carcinoma], UCEC[Uterine Corpus Endometrial Carcinoma] |
| Top |
| Gene Expression for UGGT1 |
| * CCLE gene expression data were extracted from CCLE_Expression_Entrez_2012-10-18.res: Gene-centric RMA-normalized mRNA expression data. |
 |
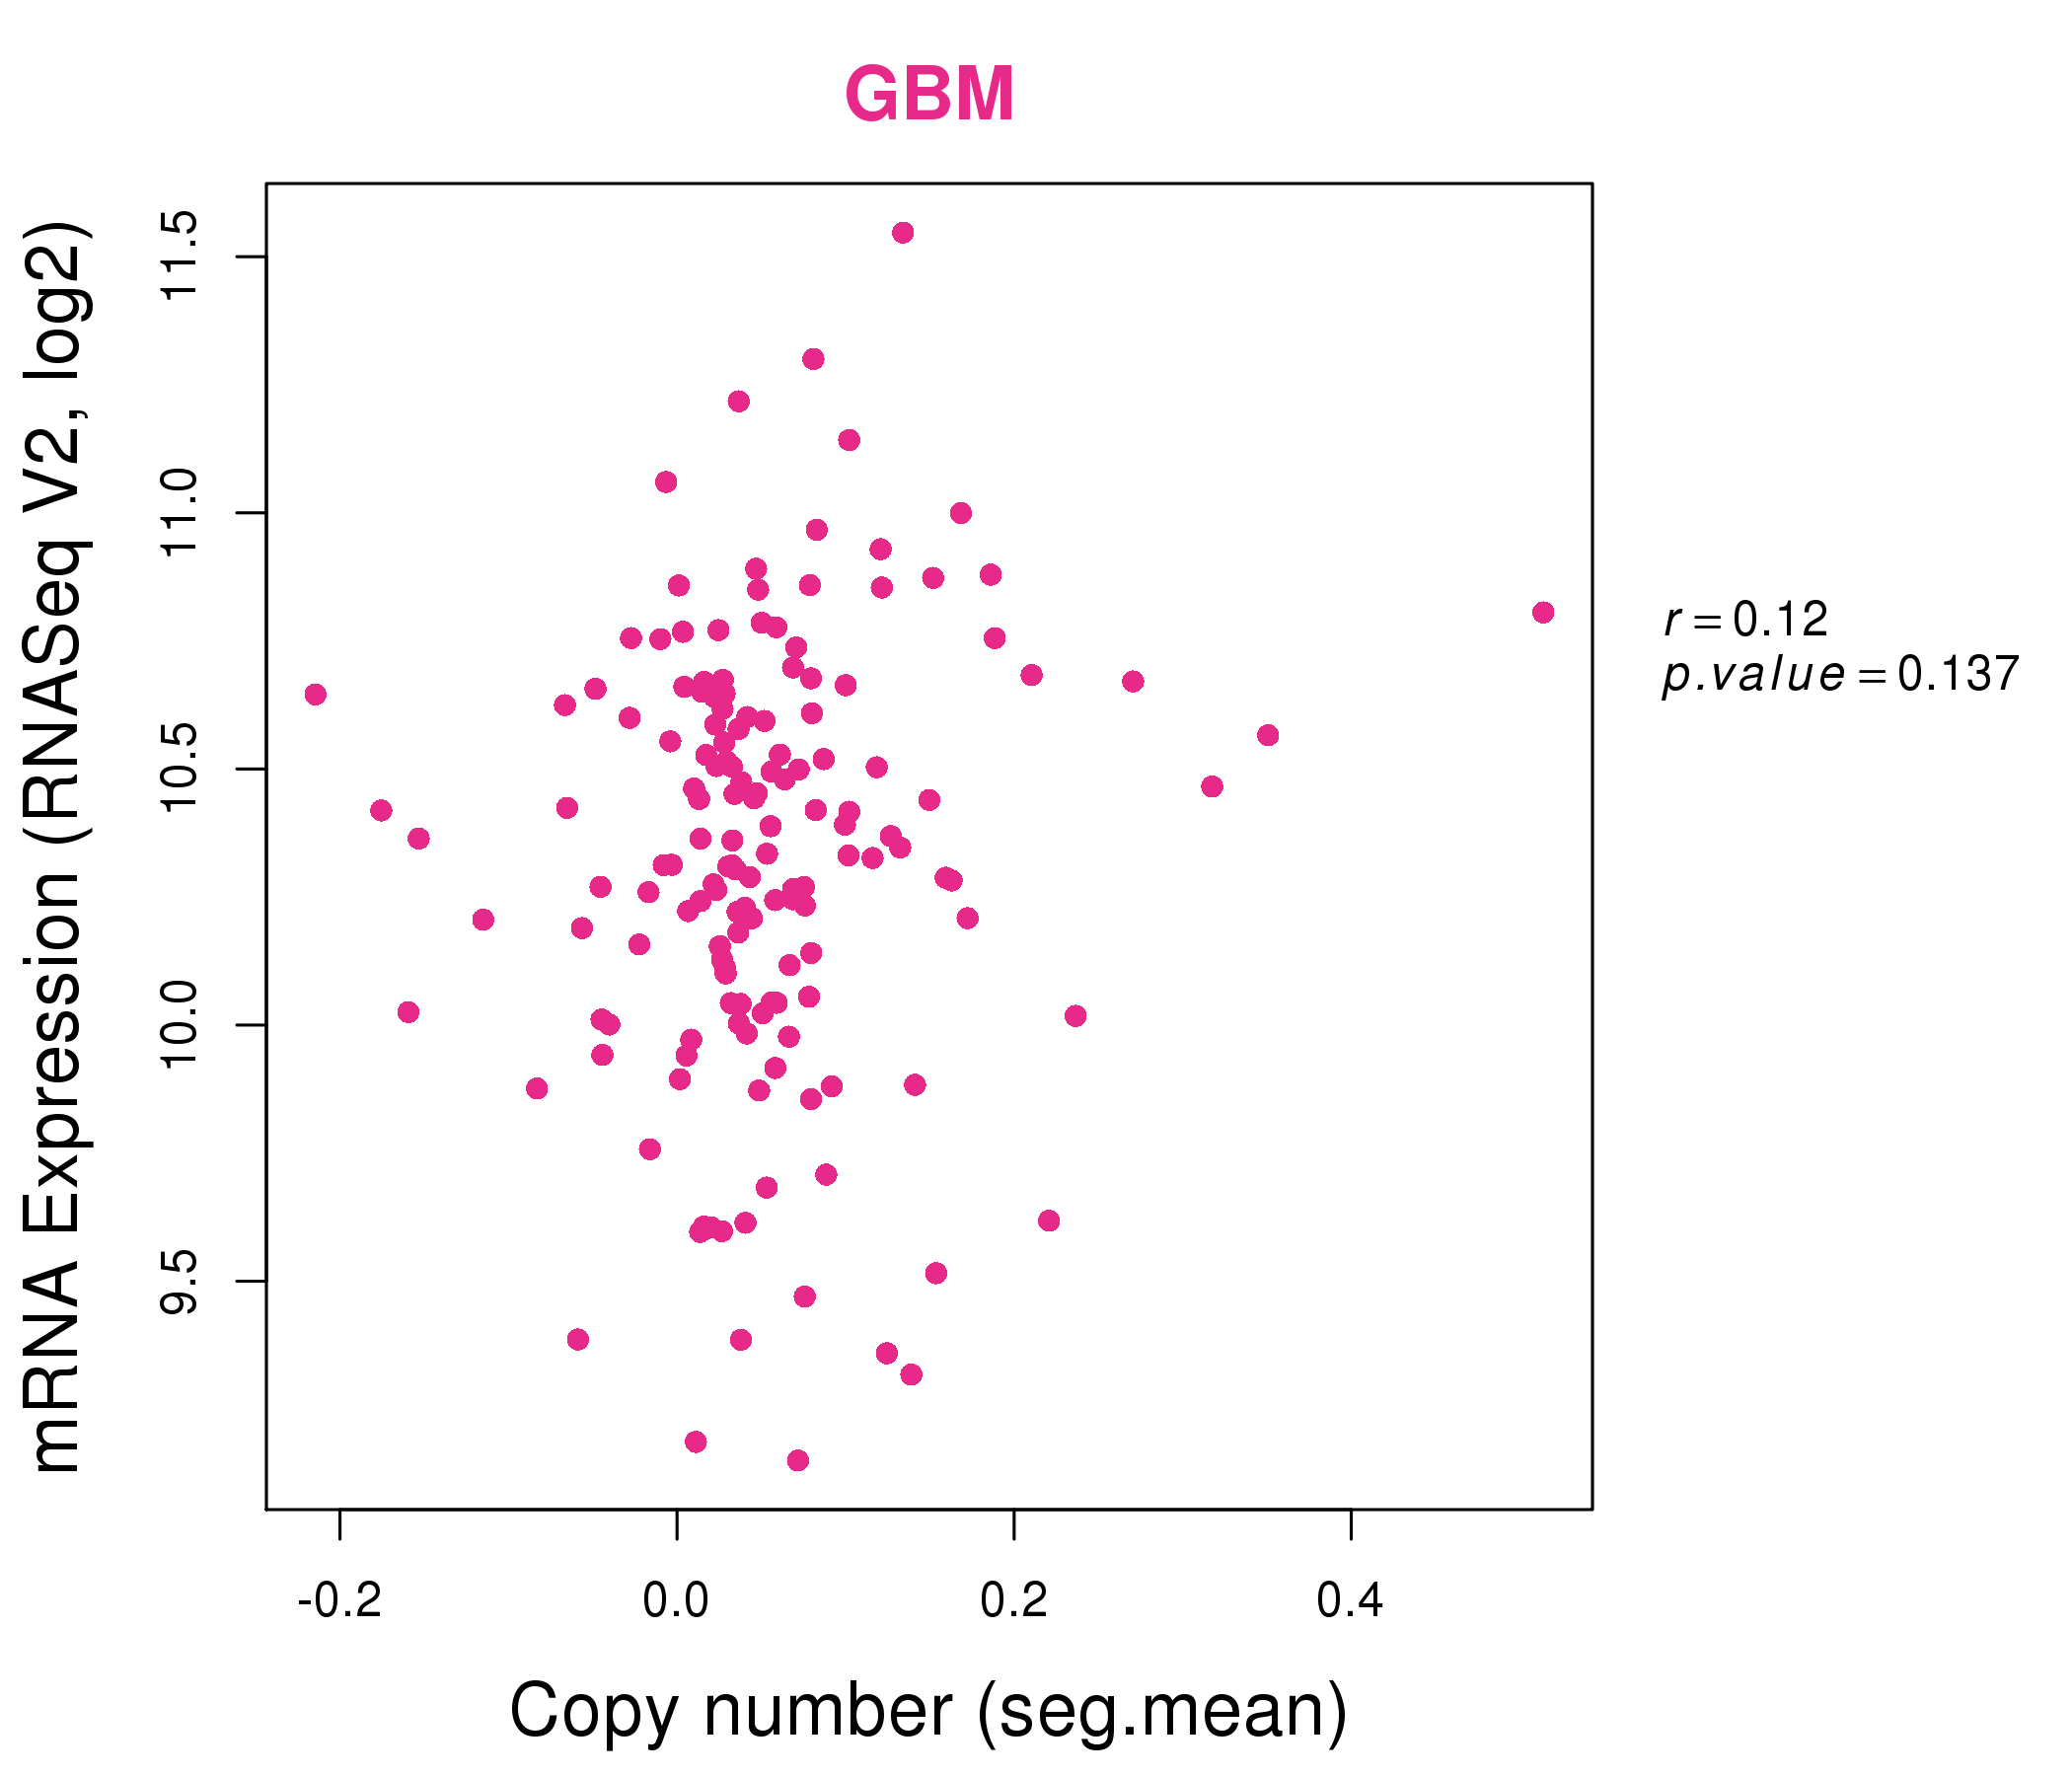
| * Normalized gene expression data of RNASeqV2 was extracted from TCGA using R package TCGA-Assembler. The URLs of all public data files on TCGA DCC data server were gathered at Jan-05-2015. Only eight cancer types have enough normal control samples for differential expression analysis. (t test, adjusted p<0.05 (using Benjamini-Hochberg FDR)) |
 |
| Top |
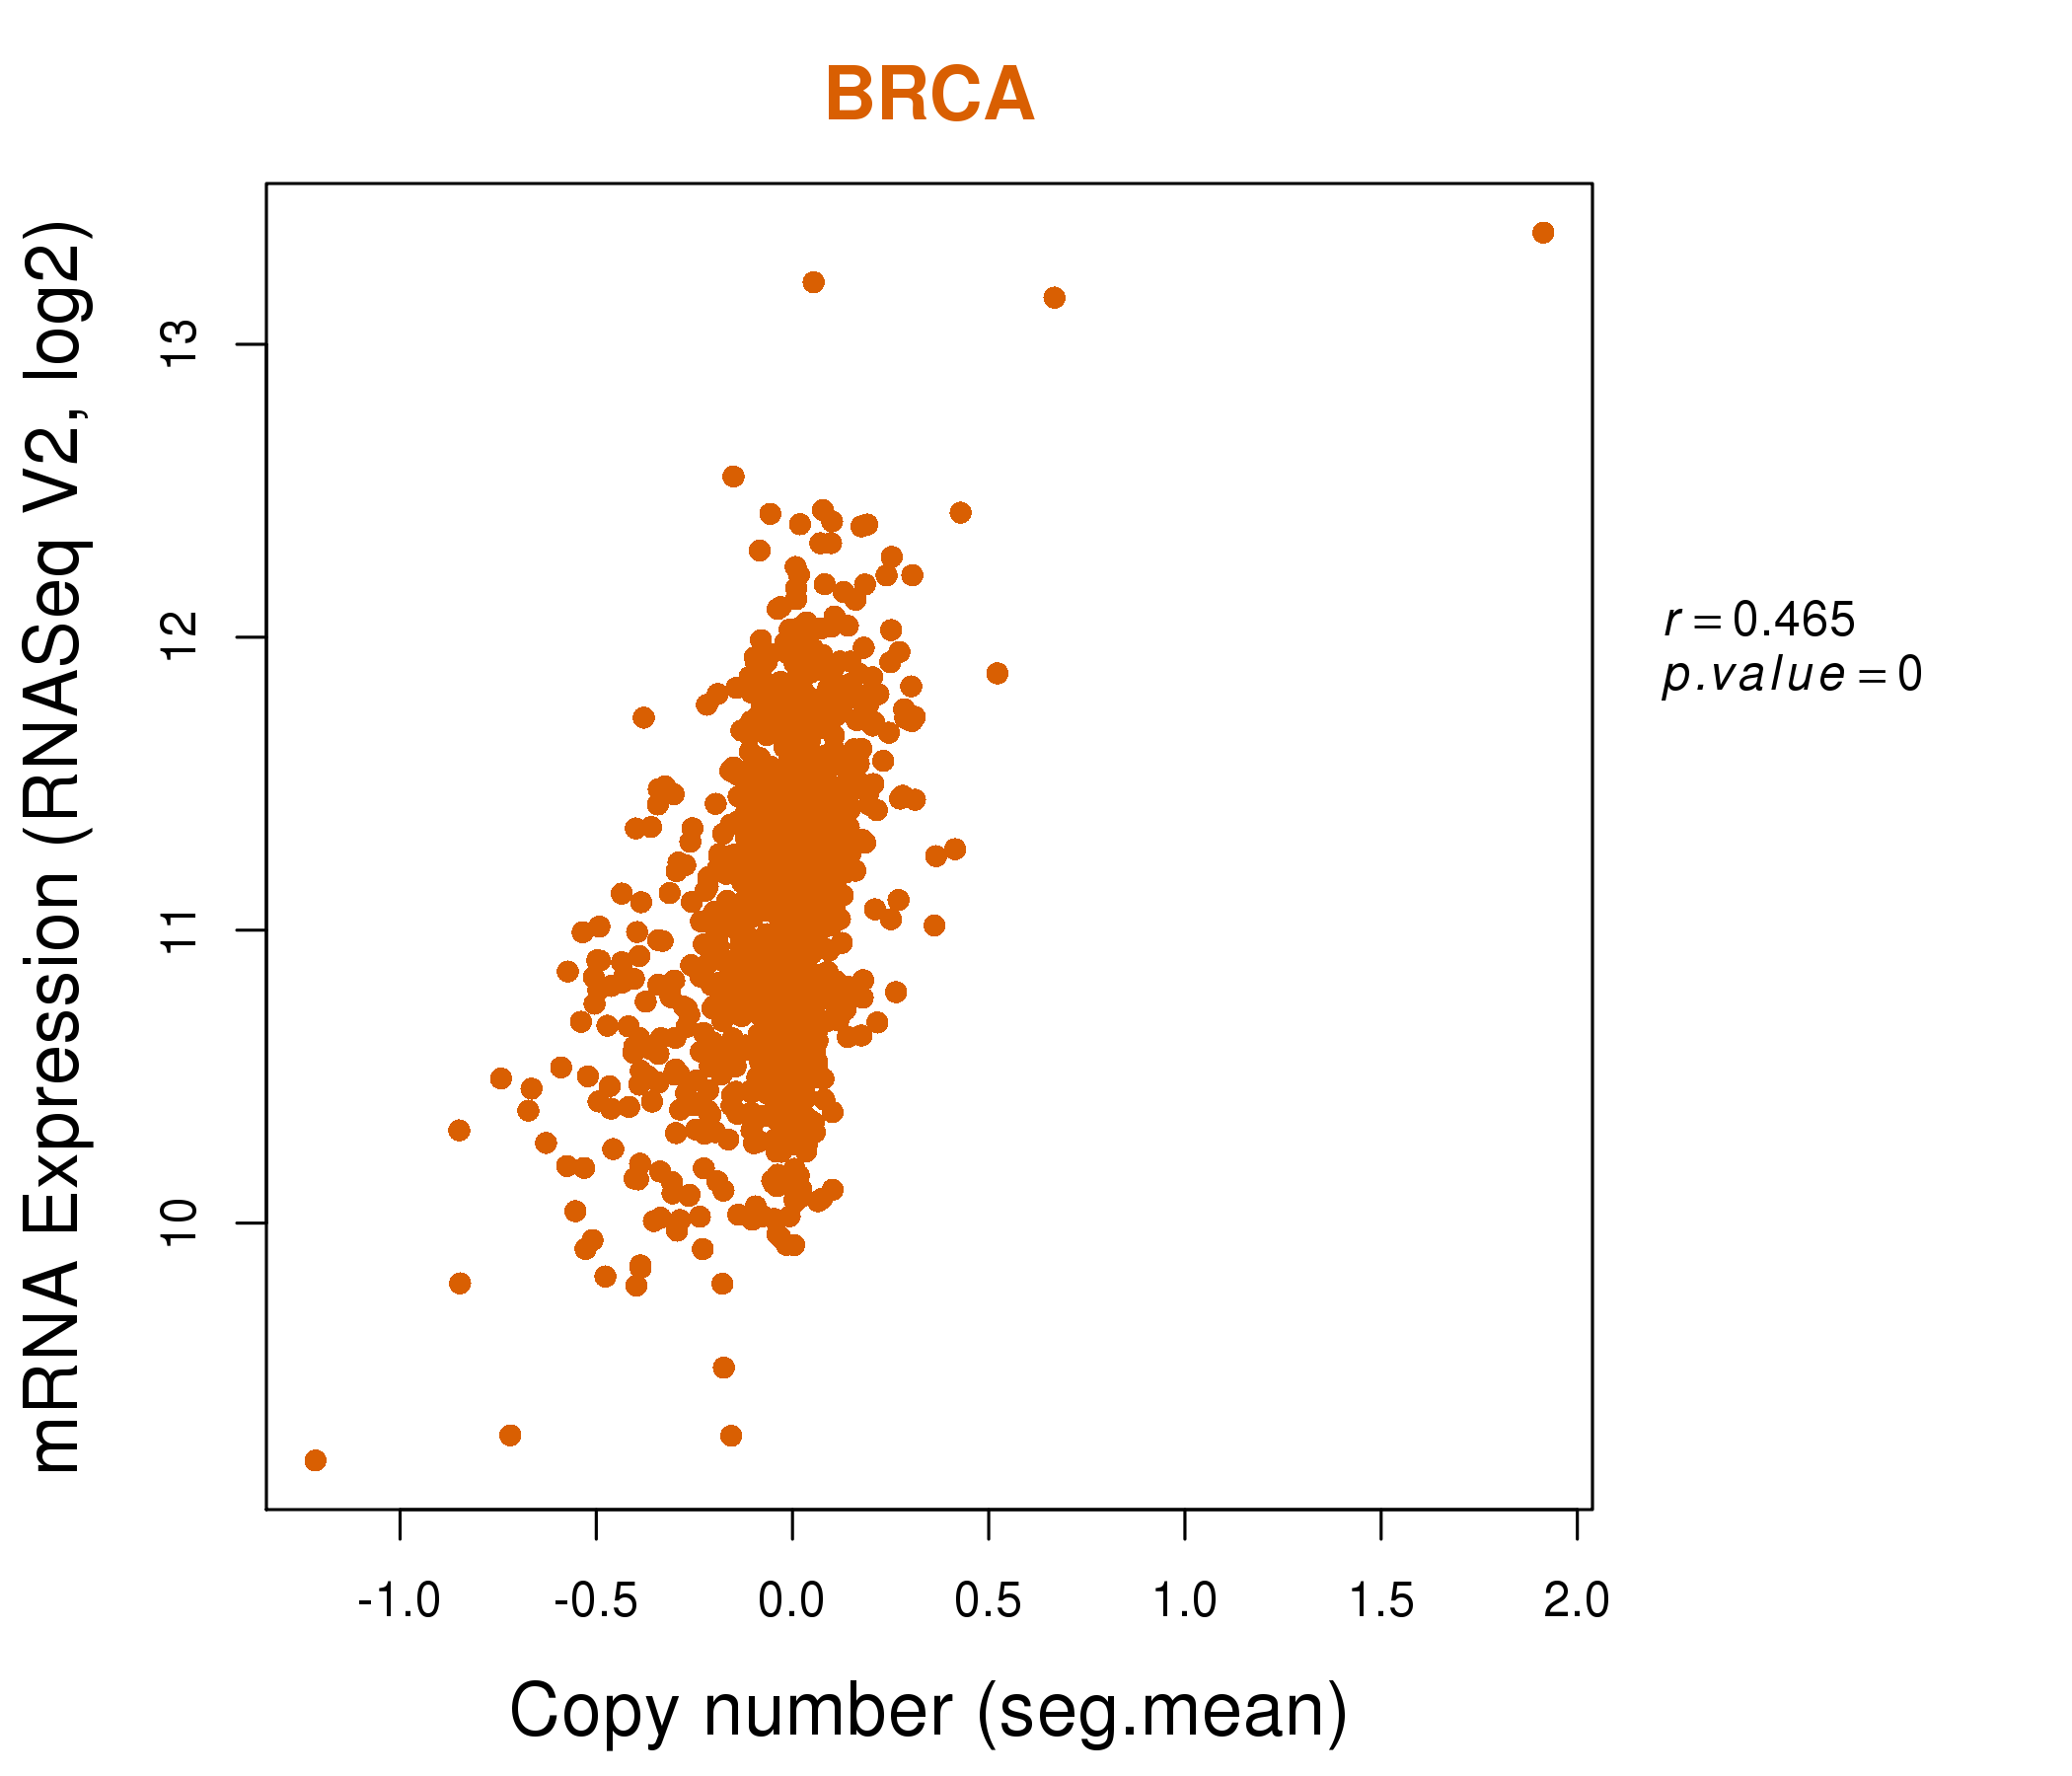
| * This plots show the correlation between CNV and gene expression. |
: Open all plots for all cancer types
 |
|
 |
|
| Top |
| Gene-Gene Network Information |
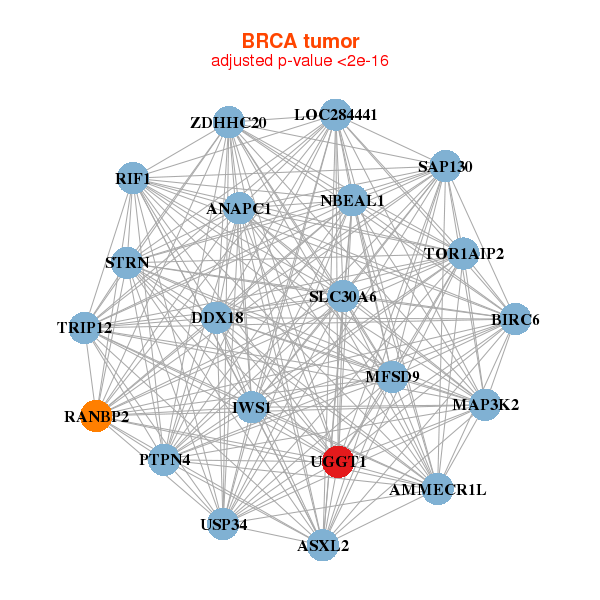
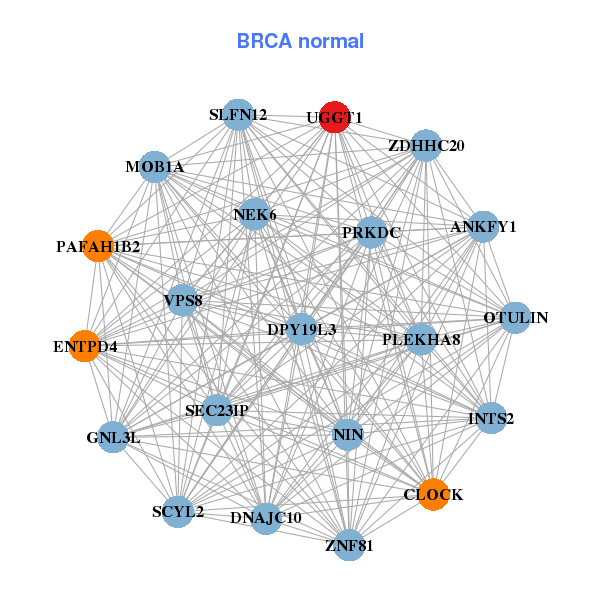
| * Co-Expression network figures were drawn using R package igraph. Only the top 20 genes with the highest correlations were shown. Red circle: input gene, orange circle: cell metabolism gene, sky circle: other gene |
: Open all plots for all cancer types
 |
|
| AMMECR1L,ANAPC1,ASXL2,BIRC6,DDX18,IWS1,LOC284441, MAP3K2,MFSD9,NBEAL1,PTPN4,RANBP2,RIF1,SAP130, SLC30A6,STRN,TOR1AIP2,TRIP12,UGGT1,USP34,ZDHHC20 | ANKFY1,CLOCK,DNAJC10,DPY19L3,ENTPD4,OTULIN,GNL3L, INTS2,MOB1A,NEK6,NIN,PAFAH1B2,PLEKHA8,PRKDC, SCYL2,SEC23IP,SLFN12,UGGT1,VPS8,ZDHHC20,ZNF81 |
 |
|
| ANAPC1,ARID1A,ASXL2,PRRC2C,CLASP1,DNAJC10,FAM168B, GIGYF2,NSD1,POLR1A,RIF1,SAP130,SNRNP200,TAOK1, TET3,TGFBRAP1,TRIP12,TTLL4,UBR3,UGGT1,USP34 | AQR,ASCC3,ATR,PRRC2C,CDK12,DHX9,EIF4G1, EPRS,GANAB,HNRNPU,LARP1,LMNB2,MKI67,PRKDC, RFWD3,SBNO1,TAF15,TRIP11,UGGT1,VPRBP,XPO5 |

| * Co-Expression network figures were drawn using R package igraph. Only the top 20 genes with the highest correlations were shown. Red circle: input gene, orange circle: cell metabolism gene, sky circle: other gene |
: Open all plots for all cancer types
| Top |
: Open all interacting genes' information including KEGG pathway for all interacting genes from DAVID
| Top |
| Pharmacological Information for UGGT1 |
| There's no related Drug. |
| Top |
| Cross referenced IDs for UGGT1 |
| * We obtained these cross-references from Uniprot database. It covers 150 different DBs, 18 categories. http://www.uniprot.org/help/cross_references_section |
: Open all cross reference information
|
Copyright © 2016-Present - The Univsersity of Texas Health Science Center at Houston @ |