|
||||||||||||||||||||
| |
| Phenotypic Information (metabolism pathway, cancer, disease, phenome) |
| |
| |
| Gene-Gene Network Information: Co-Expression Network, Interacting Genes & KEGG |
| |
|


| Gene Summary for RPLP2 |
| Basic gene info. | Gene symbol | RPLP2 |
| Gene name | ribosomal protein, large, P2 | |
| Synonyms | D11S2243E|LP2|P2|RPP2 | |
| Cytomap | UCSC genome browser: 11p15.5 | |
| Genomic location | chr11 :809935-812876 | |
| Type of gene | protein-coding | |
| RefGenes | NM_001004.3, | |
| Ensembl id | ENSG00000177600 | |
| Description | 60S acidic ribosomal protein P2acidic ribosomal phosphoprotein P2renal carcinoma antigen NY-REN-44 | |
| Modification date | 20141207 | |
| dbXrefs | MIM : 180530 | |
| HGNC : HGNC | ||
| HPRD : 01612 | ||
| Protein | UniProt: go to UniProt's Cross Reference DB Table | |
| Expression | CleanEX: HS_RPLP2 | |
| BioGPS: 6181 | ||
| Gene Expression Atlas: ENSG00000177600 | ||
| The Human Protein Atlas: ENSG00000177600 | ||
| Pathway | NCI Pathway Interaction Database: RPLP2 | |
| KEGG: RPLP2 | ||
| REACTOME: RPLP2 | ||
| ConsensusPathDB | ||
| Pathway Commons: RPLP2 | ||
| Metabolism | MetaCyc: RPLP2 | |
| HUMANCyc: RPLP2 | ||
| Regulation | Ensembl's Regulation: ENSG00000177600 | |
| miRBase: chr11 :809,935-812,876 | ||
| TargetScan: NM_001004 | ||
| cisRED: ENSG00000177600 | ||
| Context | iHOP: RPLP2 | |
| cancer metabolism search in PubMed: RPLP2 | ||
| UCL Cancer Institute: RPLP2 | ||
| Assigned class in ccmGDB | C | |
| Top |
| Phenotypic Information for RPLP2(metabolism pathway, cancer, disease, phenome) |
| Cancer | CGAP: RPLP2 |
| Familial Cancer Database: RPLP2 | |
| * This gene is included in those cancer gene databases. |
|
|
|
|
|
| . | ||||||||||||||
Oncogene 1 | Significant driver gene in | |||||||||||||||||||
| cf) number; DB name 1 Oncogene; http://nar.oxfordjournals.org/content/35/suppl_1/D721.long, 2 Tumor Suppressor gene; https://bioinfo.uth.edu/TSGene/, 3 Cancer Gene Census; http://www.nature.com/nrc/journal/v4/n3/abs/nrc1299.html, 4 CancerGenes; http://nar.oxfordjournals.org/content/35/suppl_1/D721.long, 5 Network of Cancer Gene; http://ncg.kcl.ac.uk/index.php, 1Therapeutic Vulnerabilities in Cancer; http://cbio.mskcc.org/cancergenomics/statius/ |
| REACTOME_METABOLISM_OF_PROTEINS REACTOME_METABOLISM_OF_MRNA REACTOME_METABOLISM_OF_RNA | |
| OMIM | |
| Orphanet | |
| Disease | KEGG Disease: RPLP2 |
| MedGen: RPLP2 (Human Medical Genetics with Condition) | |
| ClinVar: RPLP2 | |
| Phenotype | MGI: RPLP2 (International Mouse Phenotyping Consortium) |
| PhenomicDB: RPLP2 | |
| Mutations for RPLP2 |
| * Under tables are showing count per each tissue to give us broad intuition about tissue specific mutation patterns.You can go to the detailed page for each mutation database's web site. |
| There's no structural variation information in COSMIC data for this gene. |
| * From mRNA Sanger sequences, Chitars2.0 arranged chimeric transcripts. This table shows RPLP2 related fusion information. |
| ID | Head Gene | Tail Gene | Accession | Gene_a | qStart_a | qEnd_a | Chromosome_a | tStart_a | tEnd_a | Gene_a | qStart_a | qEnd_a | Chromosome_a | tStart_a | tEnd_a |
| BQ027739 | RPLP2 | 19 | 216 | 11 | 812551 | 812874 | HLA-DPA1 | 212 | 264 | 6 | 4513297 | 4513349 | |
| BF813426 | RPLP2 | 1 | 80 | 11 | 809968 | 810241 | RPLP2 | 78 | 165 | 11 | 810304 | 811630 | |
| CK725085 | RPLP2 | 19 | 406 | 11 | 810234 | 812875 | LOC100507412 | 402 | 707 | ? | 109863 | 110167 | |
| CA425105 | RPLP2 | 22 | 338 | 11 | 810303 | 812873 | CALR | 333 | 615 | 19 | 13051583 | 13054597 | |
| CD370735 | RPLP2 | 21 | 436 | 11 | 809999 | 812873 | RPN1 | 433 | 666 | 3 | 128339108 | 128339342 | |
| CK725171 | RPLP2 | 19 | 406 | 11 | 810234 | 812875 | LOC100507412 | 402 | 706 | ? | 109863 | 110167 | |
| AW882330 | RPLP2 | 10 | 59 | 11 | 811595 | 811644 | LRRC32 | 55 | 449 | 11 | 76368671 | 76369065 | |
| DB193761 | RPLP2 | 1 | 245 | 11 | 809968 | 811645 | MED15 | 240 | 477 | 22 | 20922848 | 20937156 | |
| CB529802 | RPLP2 | 19 | 336 | 11 | 810303 | 812874 | MNDA | 329 | 712 | 1 | 158815429 | 158817536 | |
| BQ335002 | LTA4H | 4 | 114 | 12 | 96394856 | 96396821 | RPLP2 | 104 | 371 | 11 | 810308 | 812822 | |
| AA733088 | RPLP2 | 2 | 334 | 11 | 810275 | 812874 | PEG10 | 316 | 458 | 7 | 94296237 | 94296378 | |
| DB355988 | RPLP2 | 1 | 327 | 11 | 810294 | 812874 | BOD1L1 | 322 | 524 | 4 | 13601214 | 13601424 | |
| AA367796 | RPLP2 | 8 | 178 | 11 | 812574 | 812870 | HBB | 178 | 302 | 11 | 5248004 | 5248258 | |
| BP393246 | NFYC | 1 | 74 | 1 | 41235058 | 41236424 | RPLP2 | 74 | 500 | 11 | 809991 | 812873 | |
| BC010093 | TGFBRAP1 | 10 | 1909 | 2 | 105889455 | 105946138 | RPLP2 | 1910 | 2331 | 11 | 810003 | 812872 | |
| Top |
| There's no copy number variation information in COSMIC data for this gene. |
| Top |
|
 |
| Top |
| Stat. for Non-Synonymous SNVs (# total SNVs=3) | (# total SNVs=0) |
 | |
(# total SNVs=0) | (# total SNVs=0) |
| Top |
| * When you move the cursor on each content, you can see more deailed mutation information on the Tooltip. Those are primary_site,primary_histology,mutation(aa),pubmedID. |
| GRCh37 position | Mutation(aa) | Unique sampleID count |
| chr11:810331-810331 | p.E33K | 2 |
| chr11:812762-812762 | p.E92Q | 1 |
| chr11:810334-810334 | p.A34S | 1 |
| chr11:812594-812594 | p.G78C | 1 |
| chr11:812597-812597 | p.S79P | 1 |
| chr11:812614-812614 | p.A84A | 1 |
| Top |
|
 |
| Point Mutation/ Tissue ID | 1 | 2 | 3 | 4 | 5 | 6 | 7 | 8 | 9 | 10 | 11 | 12 | 13 | 14 | 15 | 16 | 17 | 18 | 19 | 20 |
| # sample | 1 | 1 | 1 | 2 | ||||||||||||||||
| # mutation | 1 | 1 | 1 | 2 | ||||||||||||||||
| nonsynonymous SNV | 1 | 1 | 1 | 1 | ||||||||||||||||
| synonymous SNV | 1 |
| cf) Tissue ID; Tissue type (1; BLCA[Bladder Urothelial Carcinoma], 2; BRCA[Breast invasive carcinoma], 3; CESC[Cervical squamous cell carcinoma and endocervical adenocarcinoma], 4; COAD[Colon adenocarcinoma], 5; GBM[Glioblastoma multiforme], 6; Glioma Low Grade, 7; HNSC[Head and Neck squamous cell carcinoma], 8; KICH[Kidney Chromophobe], 9; KIRC[Kidney renal clear cell carcinoma], 10; KIRP[Kidney renal papillary cell carcinoma], 11; LAML[Acute Myeloid Leukemia], 12; LUAD[Lung adenocarcinoma], 13; LUSC[Lung squamous cell carcinoma], 14; OV[Ovarian serous cystadenocarcinoma ], 15; PAAD[Pancreatic adenocarcinoma], 16; PRAD[Prostate adenocarcinoma], 17; SKCM[Skin Cutaneous Melanoma], 18:STAD[Stomach adenocarcinoma], 19:THCA[Thyroid carcinoma], 20:UCEC[Uterine Corpus Endometrial Carcinoma]) |
| Top |
| * We represented just top 10 SNVs. When you move the cursor on each content, you can see more deailed mutation information on the Tooltip. Those are primary_site, primary_histology, mutation(aa), pubmedID. |
| Genomic Position | Mutation(aa) | Unique sampleID count |
| chr11:812574 | p.V71E | 1 |
| chr11:812594 | p.G78C | 1 |
| chr11:812597 | p.S79P | 1 |
| chr11:812762 | p.E92Q | 1 |
| chr11:812818 | p.G110G | 1 |
| * Copy number data were extracted from TCGA using R package TCGA-Assembler. The URLs of all public data files on TCGA DCC data server were gathered on Jan-05-2015. Function ProcessCNAData in TCGA-Assembler package was used to obtain gene-level copy number value which is calculated as the average copy number of the genomic region of a gene. |
 |
| cf) Tissue ID[Tissue type]: BLCA[Bladder Urothelial Carcinoma], BRCA[Breast invasive carcinoma], CESC[Cervical squamous cell carcinoma and endocervical adenocarcinoma], COAD[Colon adenocarcinoma], GBM[Glioblastoma multiforme], Glioma Low Grade, HNSC[Head and Neck squamous cell carcinoma], KICH[Kidney Chromophobe], KIRC[Kidney renal clear cell carcinoma], KIRP[Kidney renal papillary cell carcinoma], LAML[Acute Myeloid Leukemia], LUAD[Lung adenocarcinoma], LUSC[Lung squamous cell carcinoma], OV[Ovarian serous cystadenocarcinoma ], PAAD[Pancreatic adenocarcinoma], PRAD[Prostate adenocarcinoma], SKCM[Skin Cutaneous Melanoma], STAD[Stomach adenocarcinoma], THCA[Thyroid carcinoma], UCEC[Uterine Corpus Endometrial Carcinoma] |
| Top |
| Gene Expression for RPLP2 |
| * CCLE gene expression data were extracted from CCLE_Expression_Entrez_2012-10-18.res: Gene-centric RMA-normalized mRNA expression data. |
 |
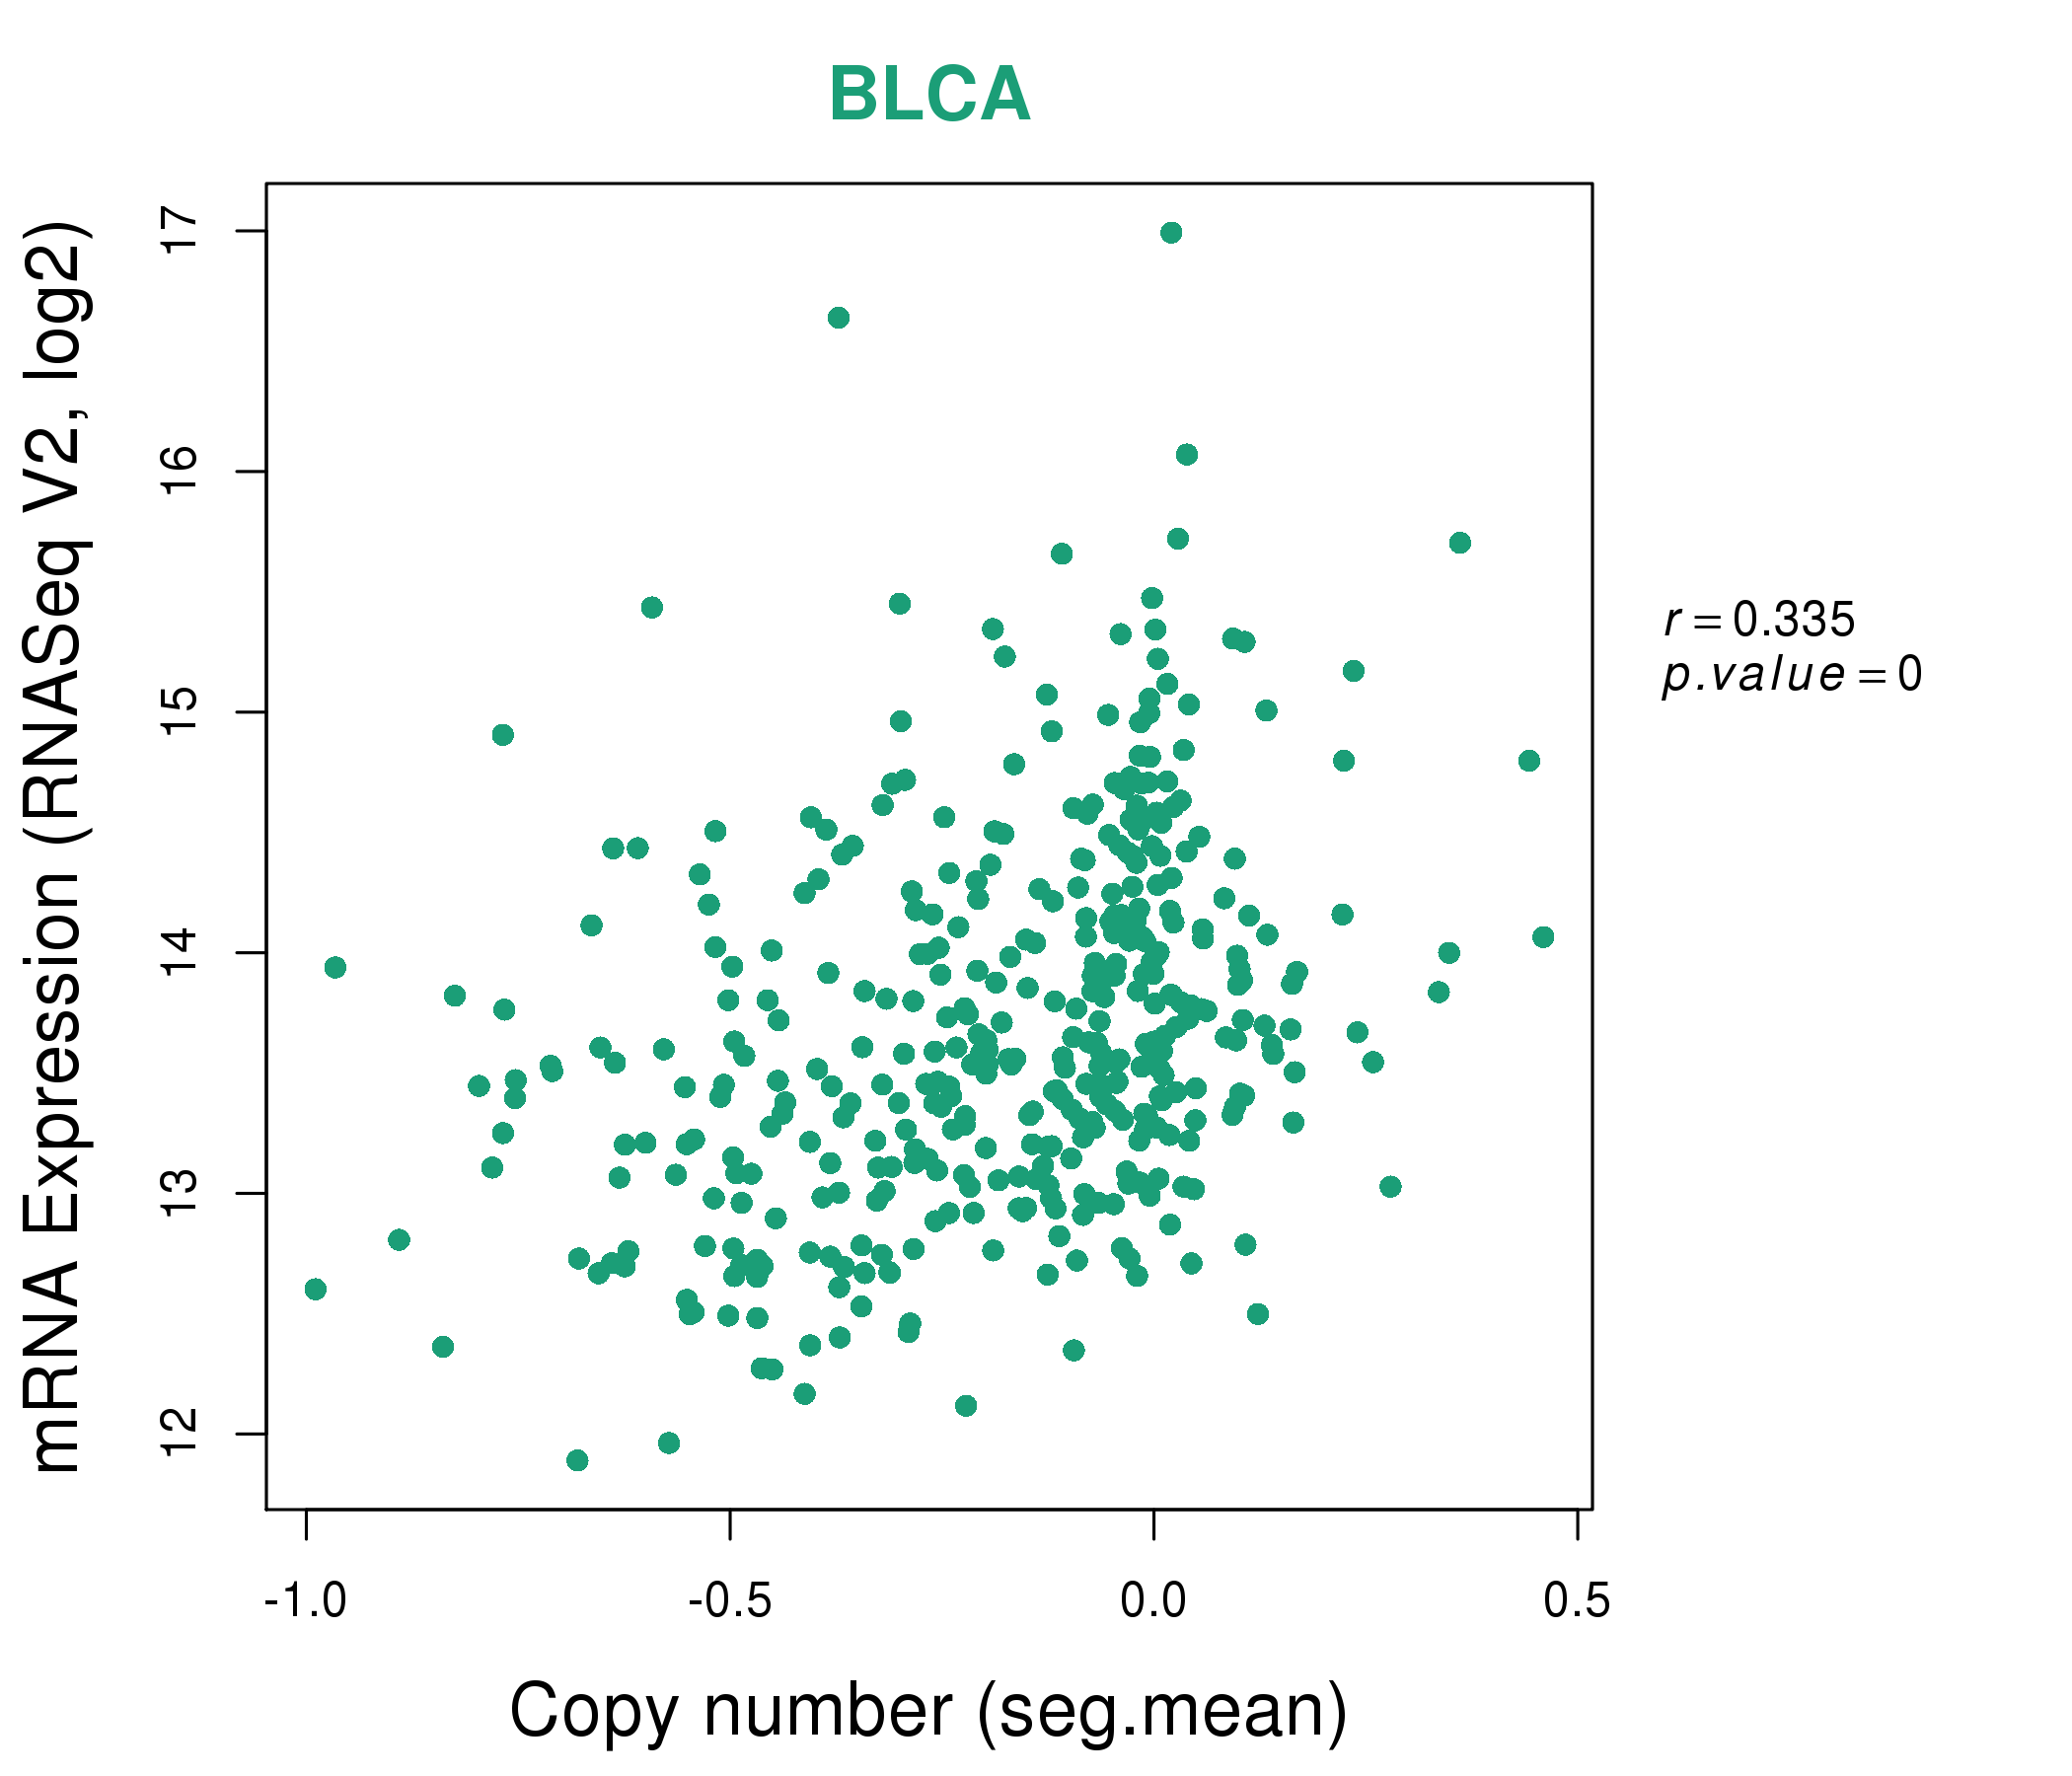
| * Normalized gene expression data of RNASeqV2 was extracted from TCGA using R package TCGA-Assembler. The URLs of all public data files on TCGA DCC data server were gathered at Jan-05-2015. Only eight cancer types have enough normal control samples for differential expression analysis. (t test, adjusted p<0.05 (using Benjamini-Hochberg FDR)) |
 |
| Top |
| * This plots show the correlation between CNV and gene expression. |
: Open all plots for all cancer types
 |
|
 |
|


| Top |
| Gene-Gene Network Information |
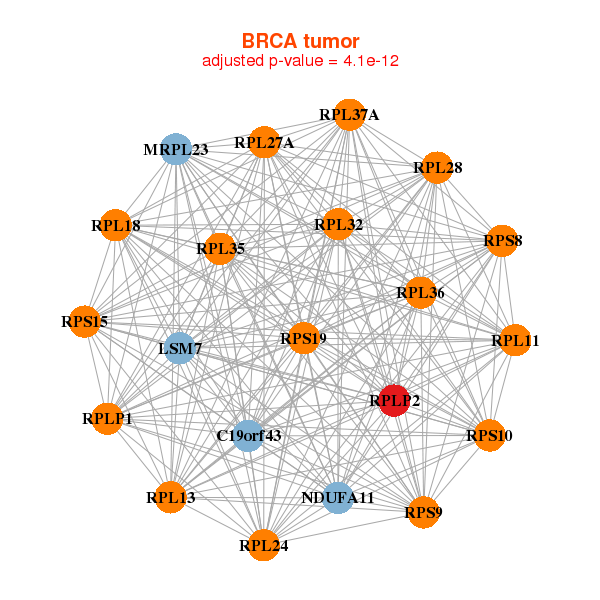
| * Co-Expression network figures were drawn using R package igraph. Only the top 20 genes with the highest correlations were shown. Red circle: input gene, orange circle: cell metabolism gene, sky circle: other gene |
: Open all plots for all cancer types
 |
| ||||
| C19orf43,LSM7,MRPL23,NDUFA11,RPL11,RPL13,RPL18, RPL24,RPL27A,RPL28,RPL32,RPL35,RPL36,RPL37A, RPLP1,RPLP2,RPS10,RPS15,RPS19,RPS8,RPS9 | BSG,TMEM256,COX4I1,COX6A1,EIF3K,EIF4EBP1,UBALD2, GLI4,HTRA2,MPST,MRPL10,PCBD1,PQLC1,RPLP2, RPS16,RPS20,SAT2,SLC25A6,THAP3,TRAPPC2L,USE1 | ||||
 |
| ||||
| EIF3F,FAU,RPL13,RPL18,RPL28,RPL29,RPL32, RPL35,RPL36,RPL37A,RPL38,RPLP1,RPLP2,RPS10, RPS13,RPS15,RPS16,RPS25,RPS2,RPS3,UBA52 | EEF1G,GNB2L1,RPL13,RPL18,RPL19,RPL23A,RPL28, RPL32,RPL36,RPL37,RPL37A,RPL38,RPLP0,RPLP2, RPS12,RPS15,RPS19,RPS21,RPS29,RPS3,UXT |

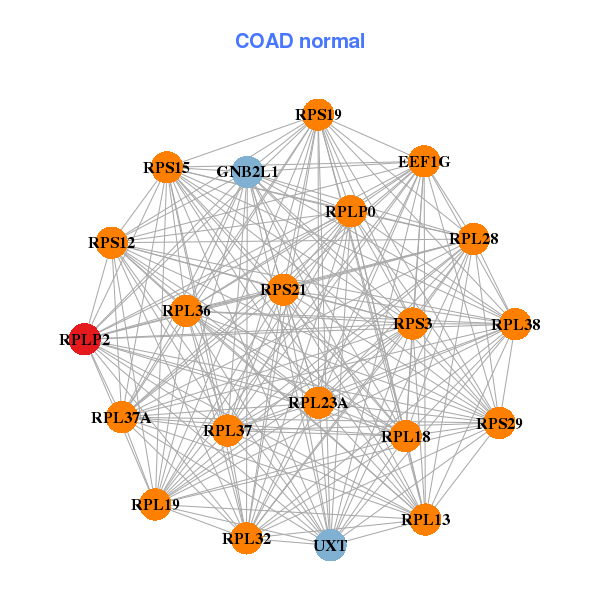
| * Co-Expression network figures were drawn using R package igraph. Only the top 20 genes with the highest correlations were shown. Red circle: input gene, orange circle: cell metabolism gene, sky circle: other gene |
: Open all plots for all cancer types
| Top |
: Open all interacting genes' information including KEGG pathway for all interacting genes from DAVID
| Top |
| Pharmacological Information for RPLP2 |
| DB Category | DB Name | DB's ID and Url link |
| * Gene Centered Interaction Network. |
 |
| * Drug Centered Interaction Network. |
| DrugBank ID | Target Name | Drug Groups | Generic Name | Drug Centered Network | Drug Structure |
| DB02212 | ribosomal protein, large, P2 | experimental | Pyrophosphate 2- | 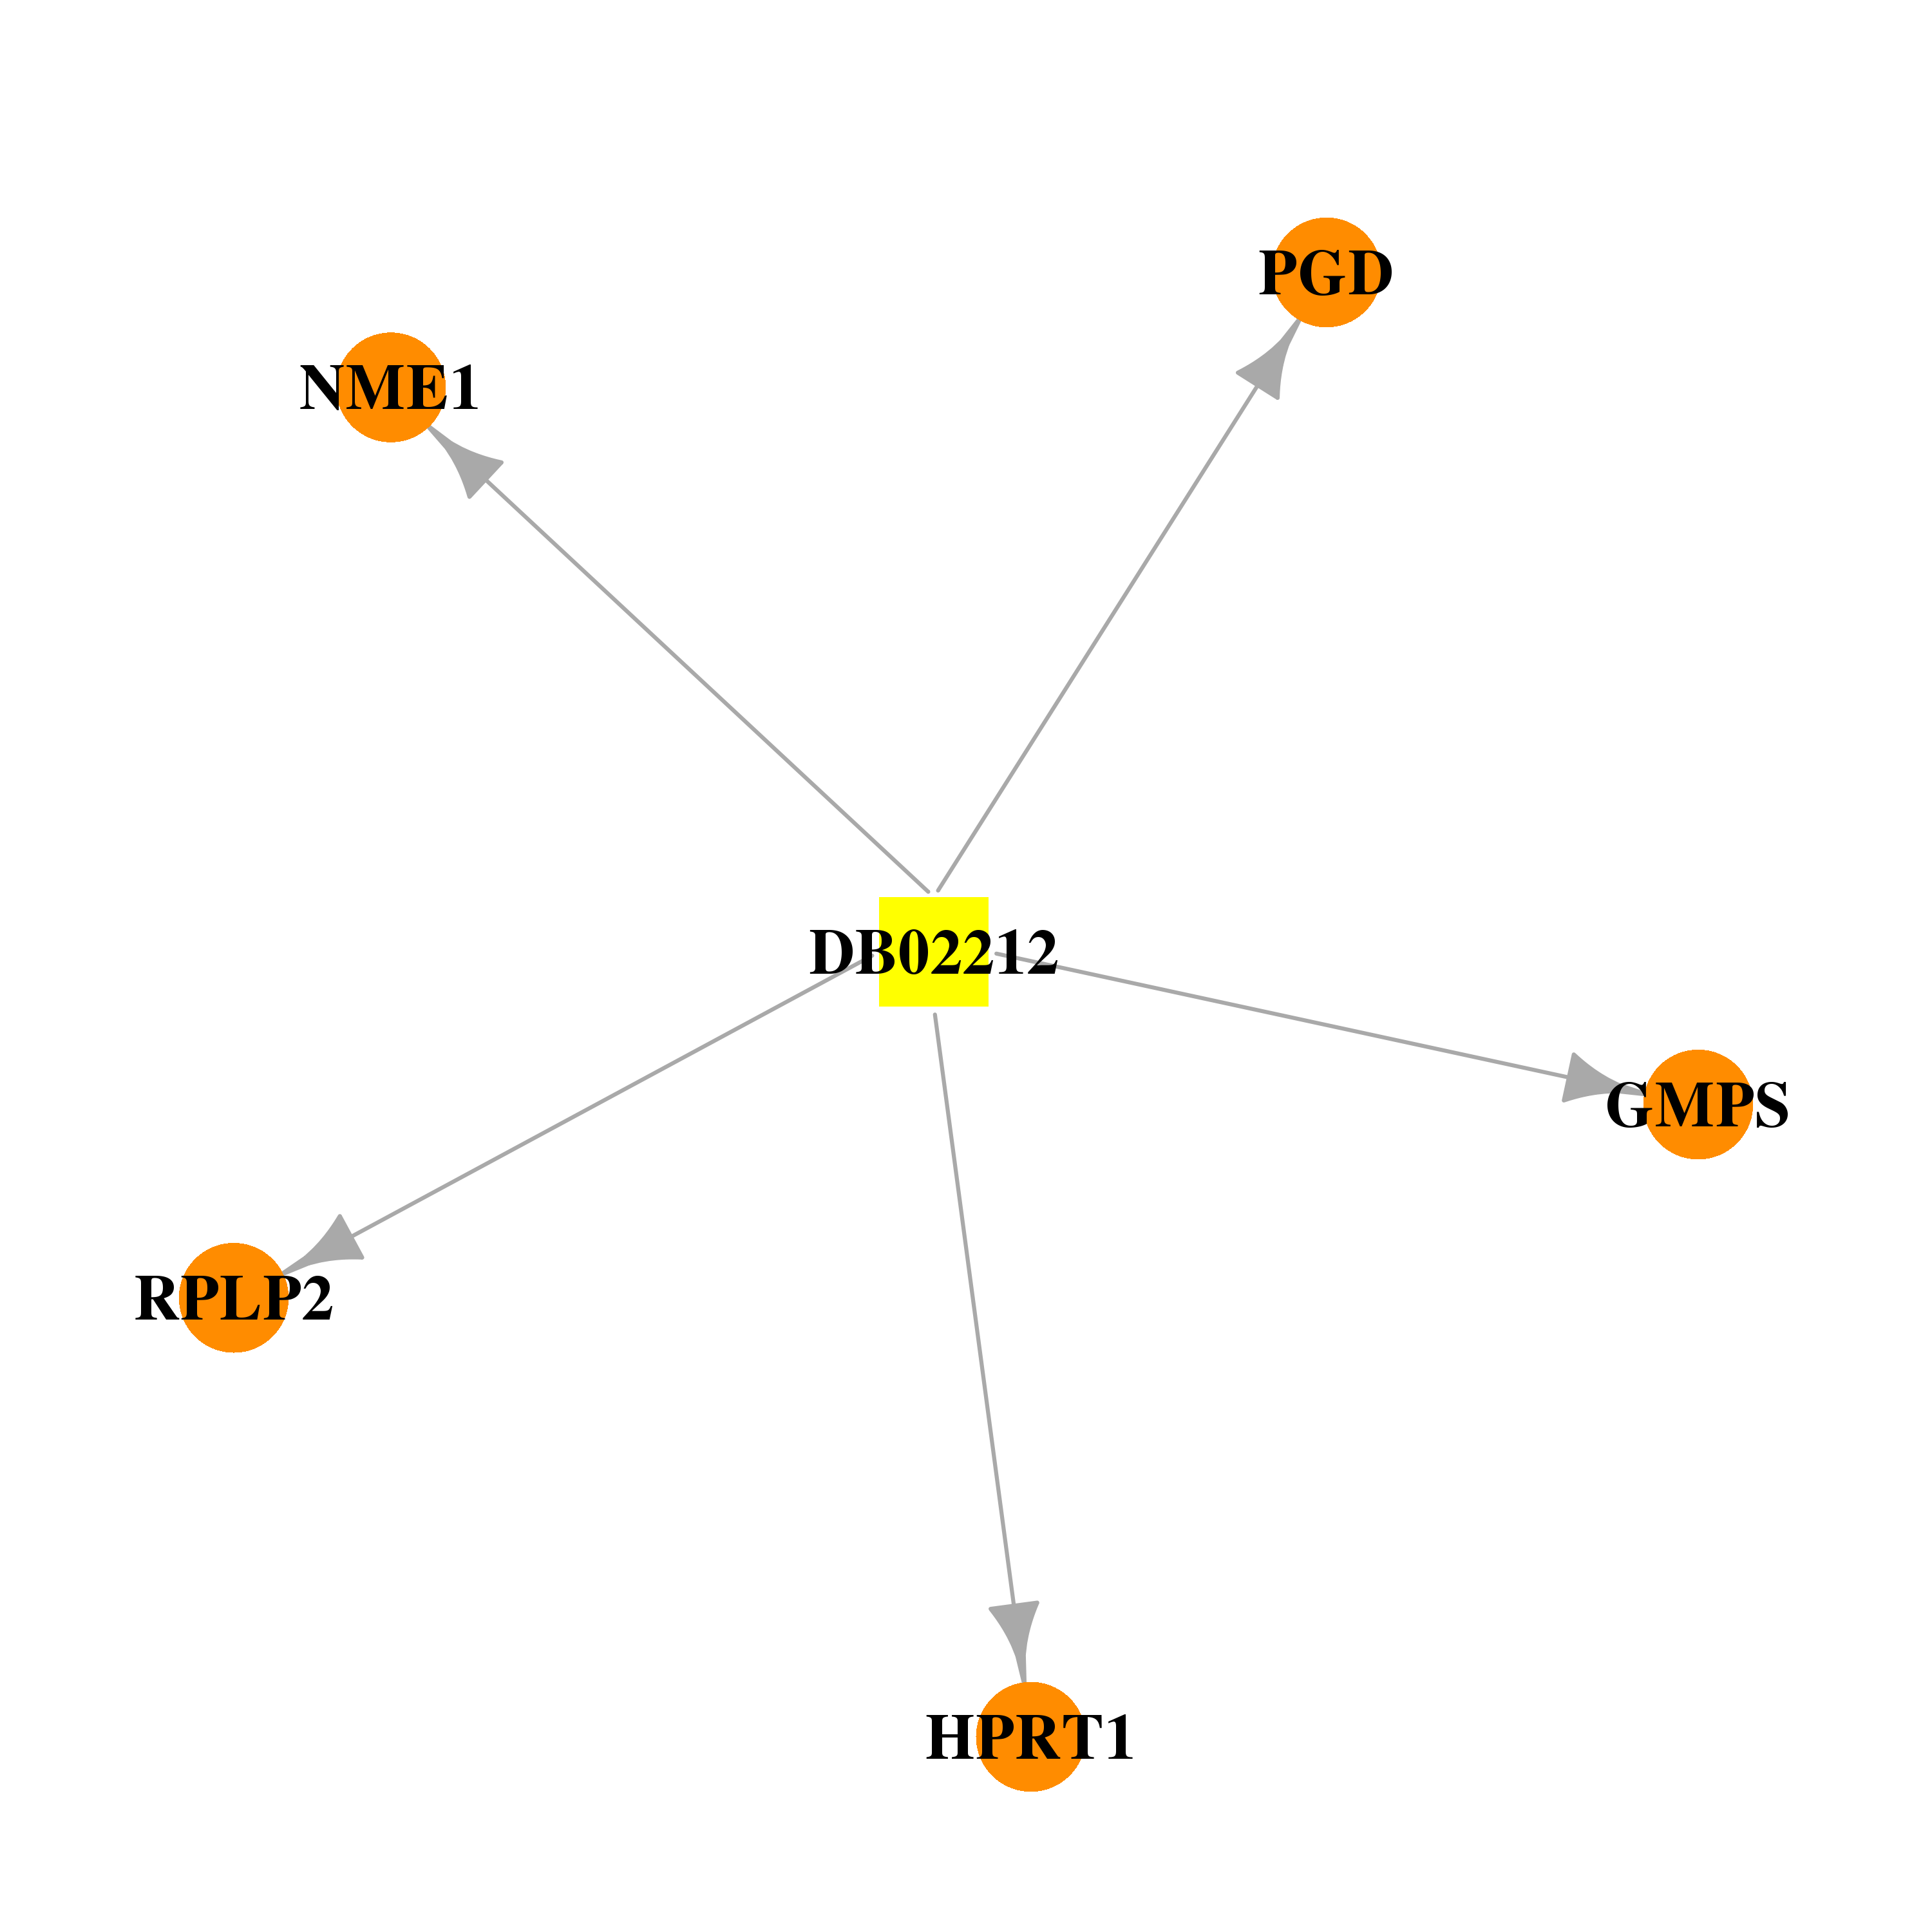 |  |
| DB04137 | ribosomal protein, large, P2 | experimental | Guanosine-5'-Triphosphate | 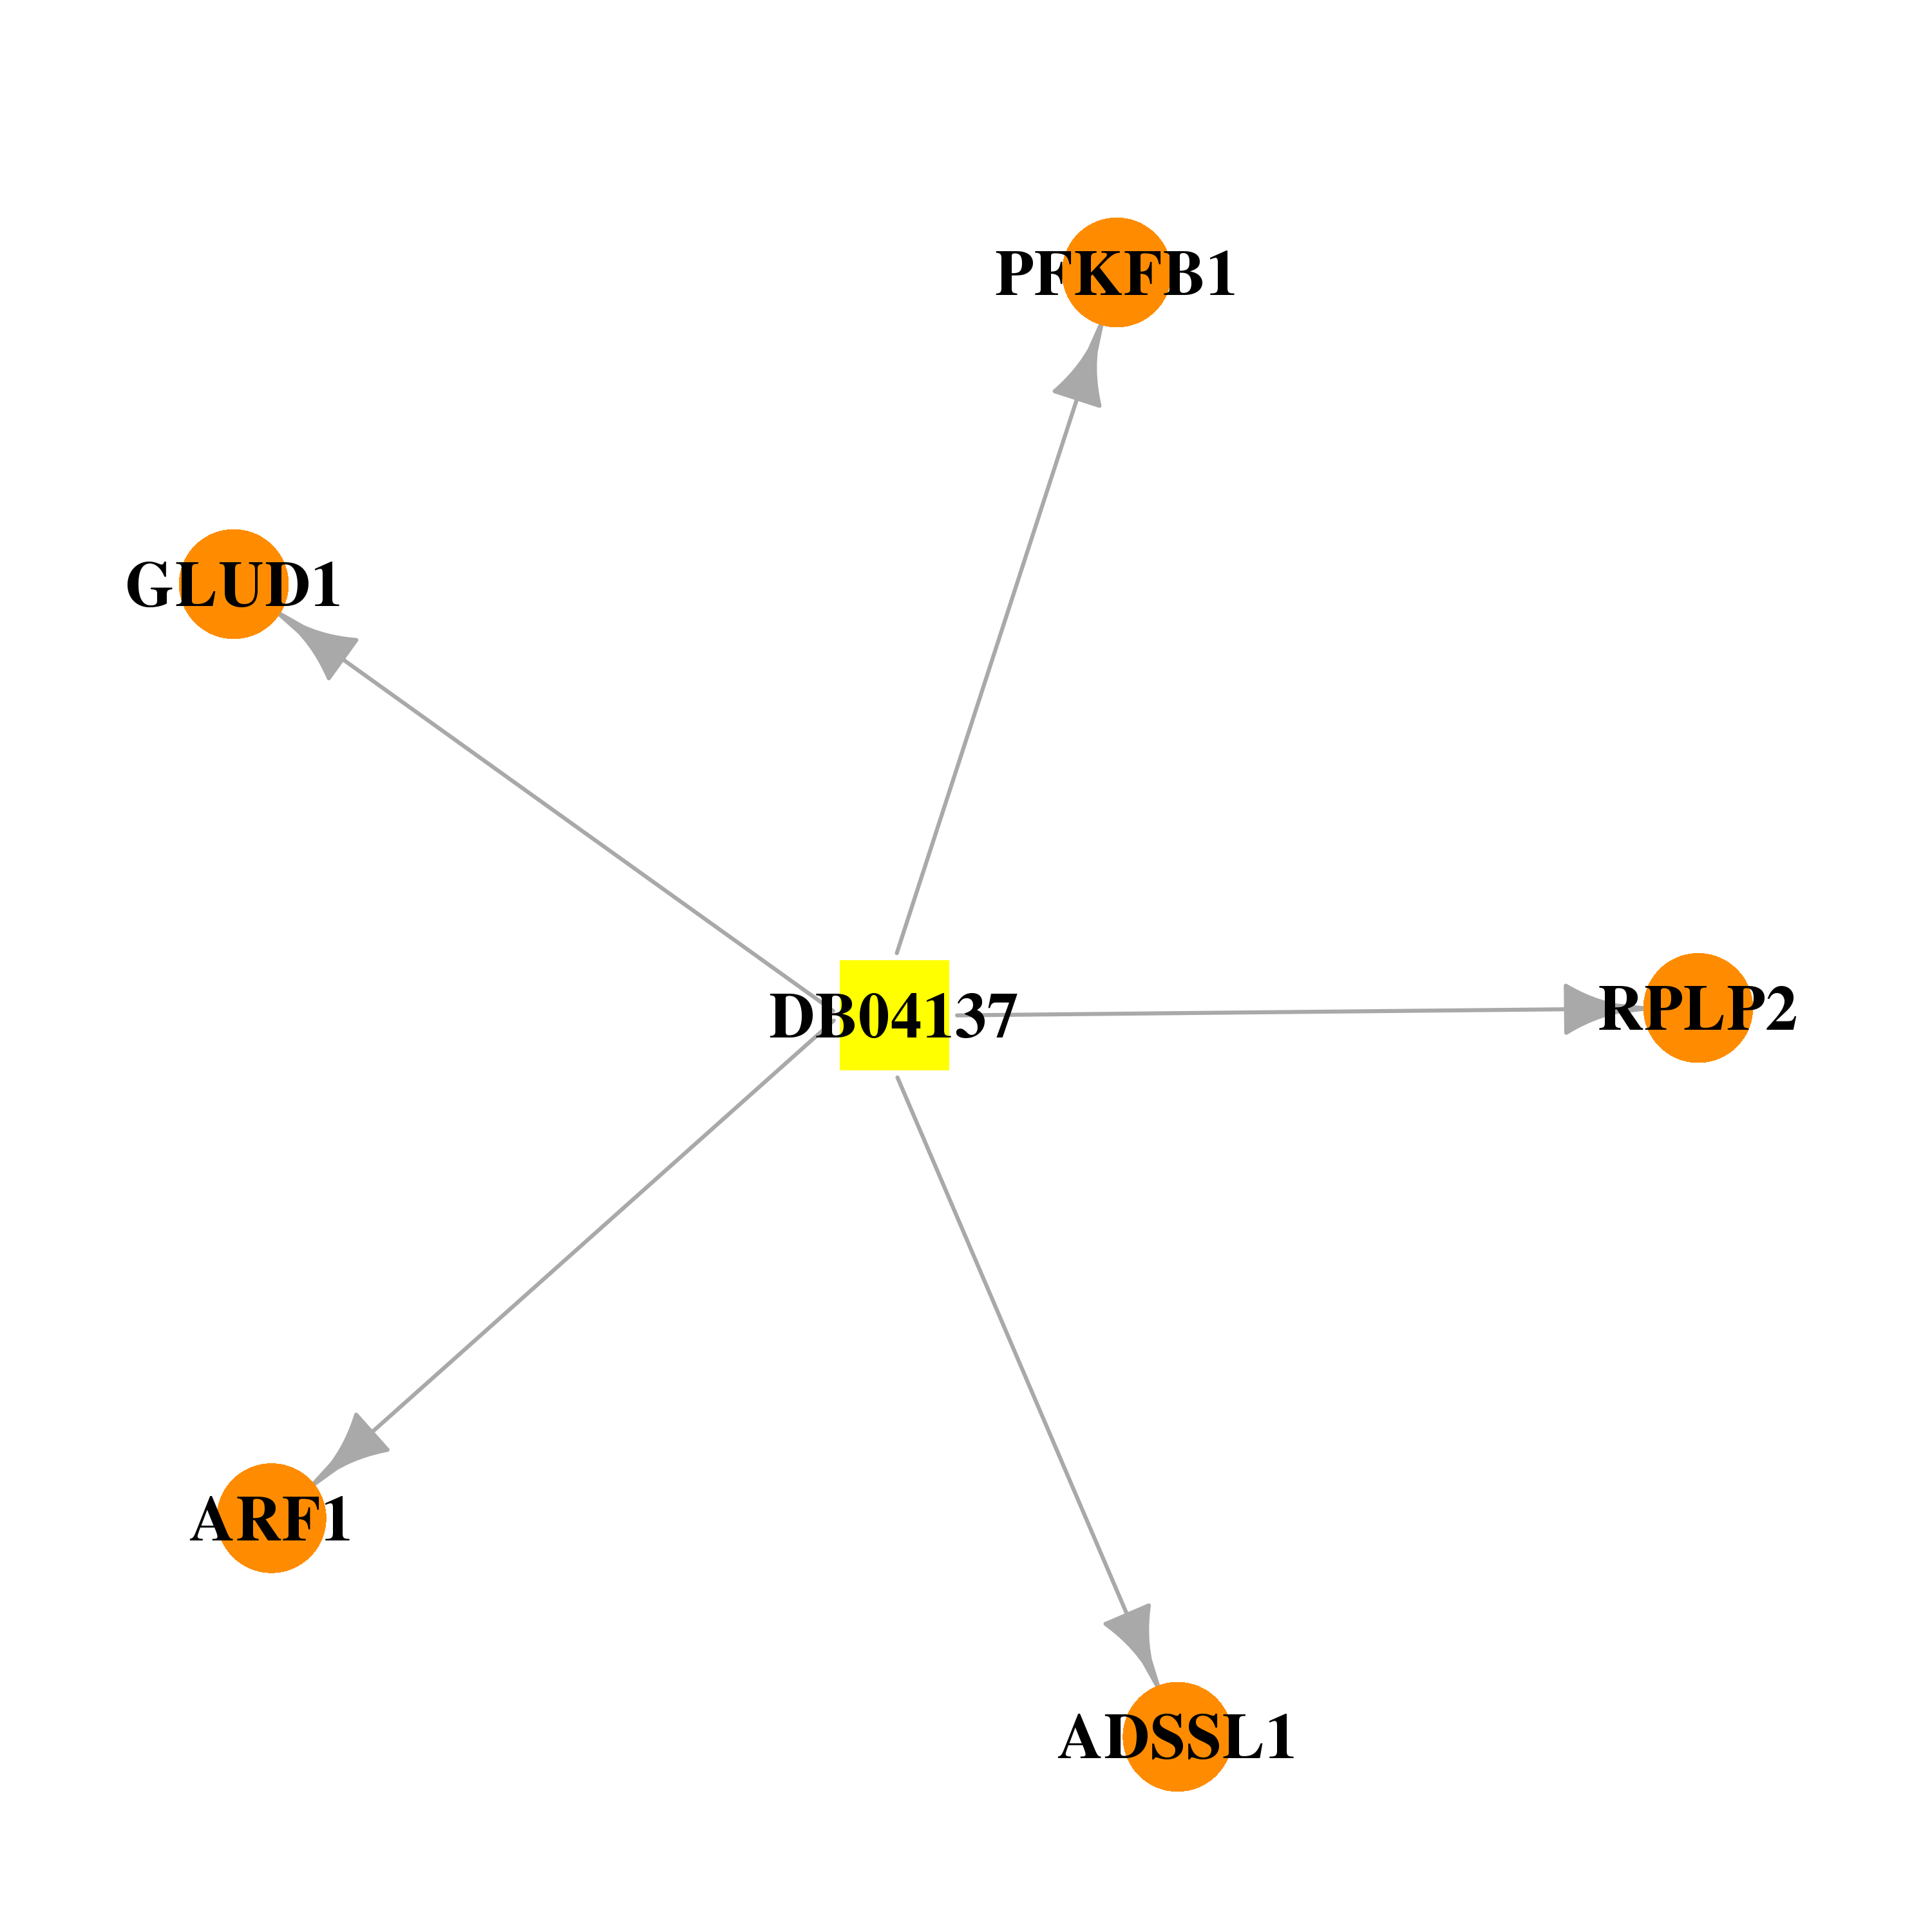 |  |
| Top |
| Cross referenced IDs for RPLP2 |
| * We obtained these cross-references from Uniprot database. It covers 150 different DBs, 18 categories. http://www.uniprot.org/help/cross_references_section |
: Open all cross reference information
|
Copyright © 2016-Present - The Univsersity of Texas Health Science Center at Houston @ |