|
||||||||||||||||||||||||||||||||||||||||||||||||||||||||||||||||||||||||||||||||||||||||||||||||||||||||||||||||||||||||||||||||||||||||||||||||||||||||||||||||||||||||||||||||||||||||||||||||||||||||||||||||||||||||||||||||||||||||||||||||||||||||||||||||||||||||||||||||||||||||||||||||||||||||||||||||||||||||||
| |
| Phenotypic Information (metabolism pathway, cancer, disease, phenome) |
| |
| |
| Gene-Gene Network Information: Co-Expression Network, Interacting Genes & KEGG |
| |
|


| Gene Summary for GRPEL1 |
| Basic gene info. | Gene symbol | GRPEL1 |
| Gene name | GrpE-like 1, mitochondrial (E. coli) | |
| Synonyms | HMGE | |
| Cytomap | UCSC genome browser: 4p16 | |
| Genomic location | chr4 :7061779-7069800 | |
| Type of gene | protein-coding | |
| RefGenes | NM_025196.2, | |
| Ensembl id | ENSG00000109519 | |
| Description | GrpE-like protein cochaperonegrpE protein homolog 1, mitochondrialmt-GrpE#1 | |
| Modification date | 20141207 | |
| dbXrefs | MIM : 606173 | |
| HGNC : HGNC | ||
| HPRD : 07550 | ||
| Protein | UniProt: go to UniProt's Cross Reference DB Table | |
| Expression | CleanEX: HS_GRPEL1 | |
| BioGPS: 80273 | ||
| Gene Expression Atlas: ENSG00000109519 | ||
| The Human Protein Atlas: ENSG00000109519 | ||
| Pathway | NCI Pathway Interaction Database: GRPEL1 | |
| KEGG: GRPEL1 | ||
| REACTOME: GRPEL1 | ||
| ConsensusPathDB | ||
| Pathway Commons: GRPEL1 | ||
| Metabolism | MetaCyc: GRPEL1 | |
| HUMANCyc: GRPEL1 | ||
| Regulation | Ensembl's Regulation: ENSG00000109519 | |
| miRBase: chr4 :7,061,779-7,069,800 | ||
| TargetScan: NM_025196 | ||
| cisRED: ENSG00000109519 | ||
| Context | iHOP: GRPEL1 | |
| cancer metabolism search in PubMed: GRPEL1 | ||
| UCL Cancer Institute: GRPEL1 | ||
| Assigned class in ccmGDB | C | |
| Top |
| Phenotypic Information for GRPEL1(metabolism pathway, cancer, disease, phenome) |
| Cancer | CGAP: GRPEL1 |
| Familial Cancer Database: GRPEL1 | |
| * This gene is included in those cancer gene databases. |
|
|
|
|
|
| . | ||||||||||||||||||||||||||||||||||||||||||||||||||||||||||||||||||||||||||||||||||||||||||||||||||||||||||||||||||||||||||||||||||||||||||||||||||||||||||||||||||||||||||||||||||||||||||||||||||||||||||||||||||||||||||||||||||||||||||||||||||||||||||||||||||||||||||||||||||||||||||||||||||||||||||||||||||||
Oncogene 1 | Significant driver gene in | |||||||||||||||||||||||||||||||||||||||||||||||||||||||||||||||||||||||||||||||||||||||||||||||||||||||||||||||||||||||||||||||||||||||||||||||||||||||||||||||||||||||||||||||||||||||||||||||||||||||||||||||||||||||||||||||||||||||||||||||||||||||||||||||||||||||||||||||||||||||||||||||||||||||||||||||||||||||||
| cf) number; DB name 1 Oncogene; http://nar.oxfordjournals.org/content/35/suppl_1/D721.long, 2 Tumor Suppressor gene; https://bioinfo.uth.edu/TSGene/, 3 Cancer Gene Census; http://www.nature.com/nrc/journal/v4/n3/abs/nrc1299.html, 4 CancerGenes; http://nar.oxfordjournals.org/content/35/suppl_1/D721.long, 5 Network of Cancer Gene; http://ncg.kcl.ac.uk/index.php, 1Therapeutic Vulnerabilities in Cancer; http://cbio.mskcc.org/cancergenomics/statius/ |
| REACTOME_METABOLISM_OF_PROTEINS | |
| OMIM | |
| Orphanet | |
| Disease | KEGG Disease: GRPEL1 |
| MedGen: GRPEL1 (Human Medical Genetics with Condition) | |
| ClinVar: GRPEL1 | |
| Phenotype | MGI: GRPEL1 (International Mouse Phenotyping Consortium) |
| PhenomicDB: GRPEL1 | |
| Mutations for GRPEL1 |
| * Under tables are showing count per each tissue to give us broad intuition about tissue specific mutation patterns.You can go to the detailed page for each mutation database's web site. |
| - Statistics for Tissue and Mutation type | Top |
 |
| - For Inter-chromosomal Variations |
| There's no inter-chromosomal structural variation. |
| - For Intra-chromosomal Variations |
| * Intra-chromosomal variantions includes 'intrachromosomal amplicon to amplicon', 'intrachromosomal amplicon to non-amplified dna', 'intrachromosomal deletion', 'intrachromosomal fold-back inversion', 'intrachromosomal inversion', 'intrachromosomal tandem duplication', 'Intrachromosomal unknown type', 'intrachromosomal with inverted orientation', 'intrachromosomal with non-inverted orientation'. |
 |
| Sample | Symbol_a | Chr_a | Start_a | End_a | Symbol_b | Chr_b | Start_b | End_b |
| ovary | GRPEL1 | chr4 | 7067352 | 7067372 | chr4 | 41829818 | 41829838 |
| cf) Tissue number; Tissue name (1;Breast, 2;Central_nervous_system, 3;Haematopoietic_and_lymphoid_tissue, 4;Large_intestine, 5;Liver, 6;Lung, 7;Ovary, 8;Pancreas, 9;Prostate, 10;Skin, 11;Soft_tissue, 12;Upper_aerodigestive_tract) |
| * From mRNA Sanger sequences, Chitars2.0 arranged chimeric transcripts. This table shows GRPEL1 related fusion information. |
| ID | Head Gene | Tail Gene | Accession | Gene_a | qStart_a | qEnd_a | Chromosome_a | tStart_a | tEnd_a | Gene_a | qStart_a | qEnd_a | Chromosome_a | tStart_a | tEnd_a |
| Top |
| Mutation type/ Tissue ID | brca | cns | cerv | endome | haematopo | kidn | Lintest | liver | lung | ns | ovary | pancre | prost | skin | stoma | thyro | urina | |||
| Total # sample | 1 | |||||||||||||||||||
| GAIN (# sample) | ||||||||||||||||||||
| LOSS (# sample) | 1 |
| cf) Tissue ID; Tissue type (1; Breast, 2; Central_nervous_system, 3; Cervix, 4; Endometrium, 5; Haematopoietic_and_lymphoid_tissue, 6; Kidney, 7; Large_intestine, 8; Liver, 9; Lung, 10; NS, 11; Ovary, 12; Pancreas, 13; Prostate, 14; Skin, 15; Stomach, 16; Thyroid, 17; Urinary_tract) |
| Top |
|
 |
| Top |
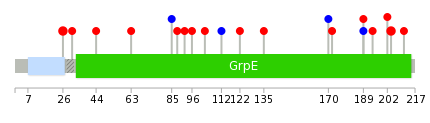
| Stat. for Non-Synonymous SNVs (# total SNVs=11) | (# total SNVs=3) |
 |  |
(# total SNVs=0) | (# total SNVs=0) |
| Top |
| * When you move the cursor on each content, you can see more deailed mutation information on the Tooltip. Those are primary_site,primary_histology,mutation(aa),pubmedID. |
| GRCh37 position | Mutation(aa) | Unique sampleID count |
| chr4:7065935-7065935 | p.L26F | 2 |
| chr4:7064107-7064107 | p.? | 2 |
| chr4:7062633-7062633 | p.R204C | 2 |
| chr4:7064112-7064112 | p.G103S | 1 |
| chr4:7062639-7062639 | p.H202N | 1 |
| chr4:7064132-7064132 | p.V96G | 1 |
| chr4:7062663-7062663 | p.V194F | 1 |
| chr4:7064145-7064145 | p.S92G | 1 |
| chr4:7062676-7062676 | p.G189G | 1 |
| chr4:7064157-7064157 | p.L88V | 1 |
| Top |
|
 |
| Point Mutation/ Tissue ID | 1 | 2 | 3 | 4 | 5 | 6 | 7 | 8 | 9 | 10 | 11 | 12 | 13 | 14 | 15 | 16 | 17 | 18 | 19 | 20 |
| # sample | 1 | 3 | 1 | 1 | 1 | 3 | 3 | |||||||||||||
| # mutation | 1 | 3 | 1 | 1 | 1 | 3 | 4 | |||||||||||||
| nonsynonymous SNV | 1 | 2 | 1 | 1 | 3 | 2 | ||||||||||||||
| synonymous SNV | 1 | 1 | 2 |
| cf) Tissue ID; Tissue type (1; BLCA[Bladder Urothelial Carcinoma], 2; BRCA[Breast invasive carcinoma], 3; CESC[Cervical squamous cell carcinoma and endocervical adenocarcinoma], 4; COAD[Colon adenocarcinoma], 5; GBM[Glioblastoma multiforme], 6; Glioma Low Grade, 7; HNSC[Head and Neck squamous cell carcinoma], 8; KICH[Kidney Chromophobe], 9; KIRC[Kidney renal clear cell carcinoma], 10; KIRP[Kidney renal papillary cell carcinoma], 11; LAML[Acute Myeloid Leukemia], 12; LUAD[Lung adenocarcinoma], 13; LUSC[Lung squamous cell carcinoma], 14; OV[Ovarian serous cystadenocarcinoma ], 15; PAAD[Pancreatic adenocarcinoma], 16; PRAD[Prostate adenocarcinoma], 17; SKCM[Skin Cutaneous Melanoma], 18:STAD[Stomach adenocarcinoma], 19:THCA[Thyroid carcinoma], 20:UCEC[Uterine Corpus Endometrial Carcinoma]) |
| Top |
| * We represented just top 10 SNVs. When you move the cursor on each content, you can see more deailed mutation information on the Tooltip. Those are primary_site, primary_histology, mutation(aa), pubmedID. |
| Genomic Position | Mutation(aa) | Unique sampleID count |
| chr4:7062633 | p.R204C | 2 |
| chr4:7065881 | p.V194F | 1 |
| chr4:7062663 | p.G189G | 1 |
| chr4:7062676 | p.F170F | 1 |
| chr4:7062733 | p.T122A | 1 |
| chr4:7062879 | p.L112L | 1 |
| chr4:7062907 | p.G103S | 1 |
| chr4:7064112 | p.S92G | 1 |
| chr4:7064145 | p.L88V | 1 |
| chr4:7064157 | p.T85T | 1 |
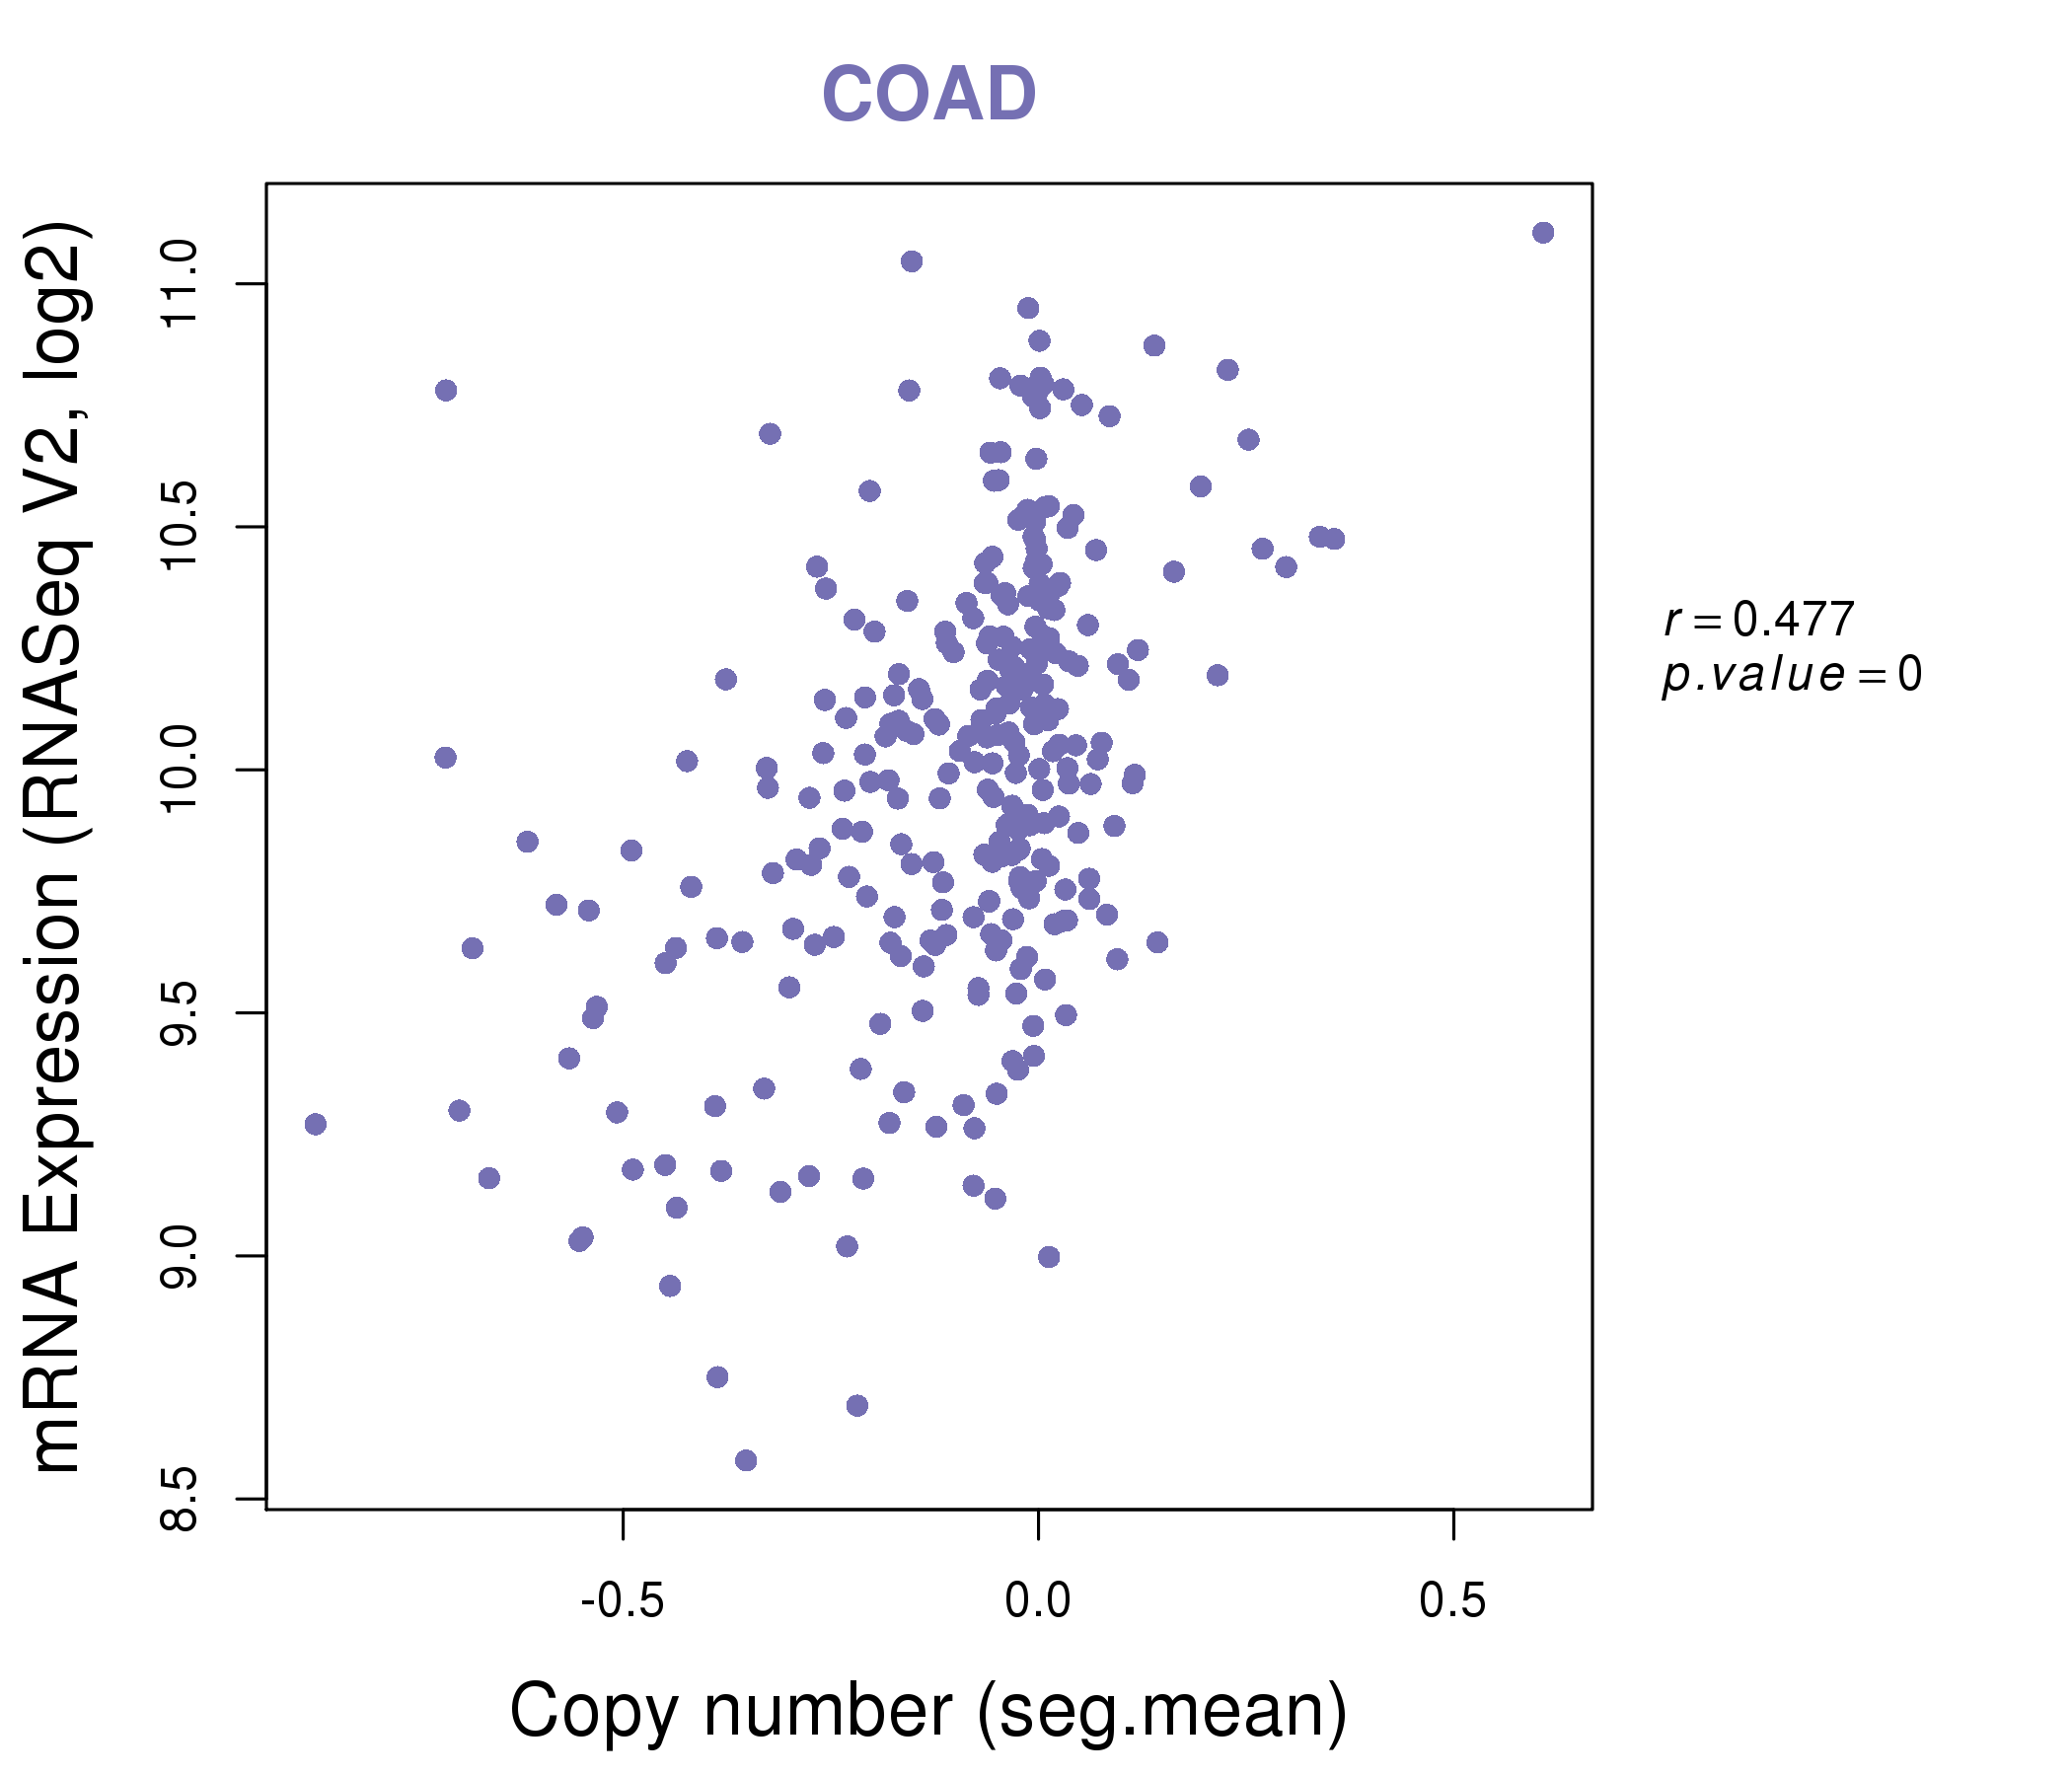
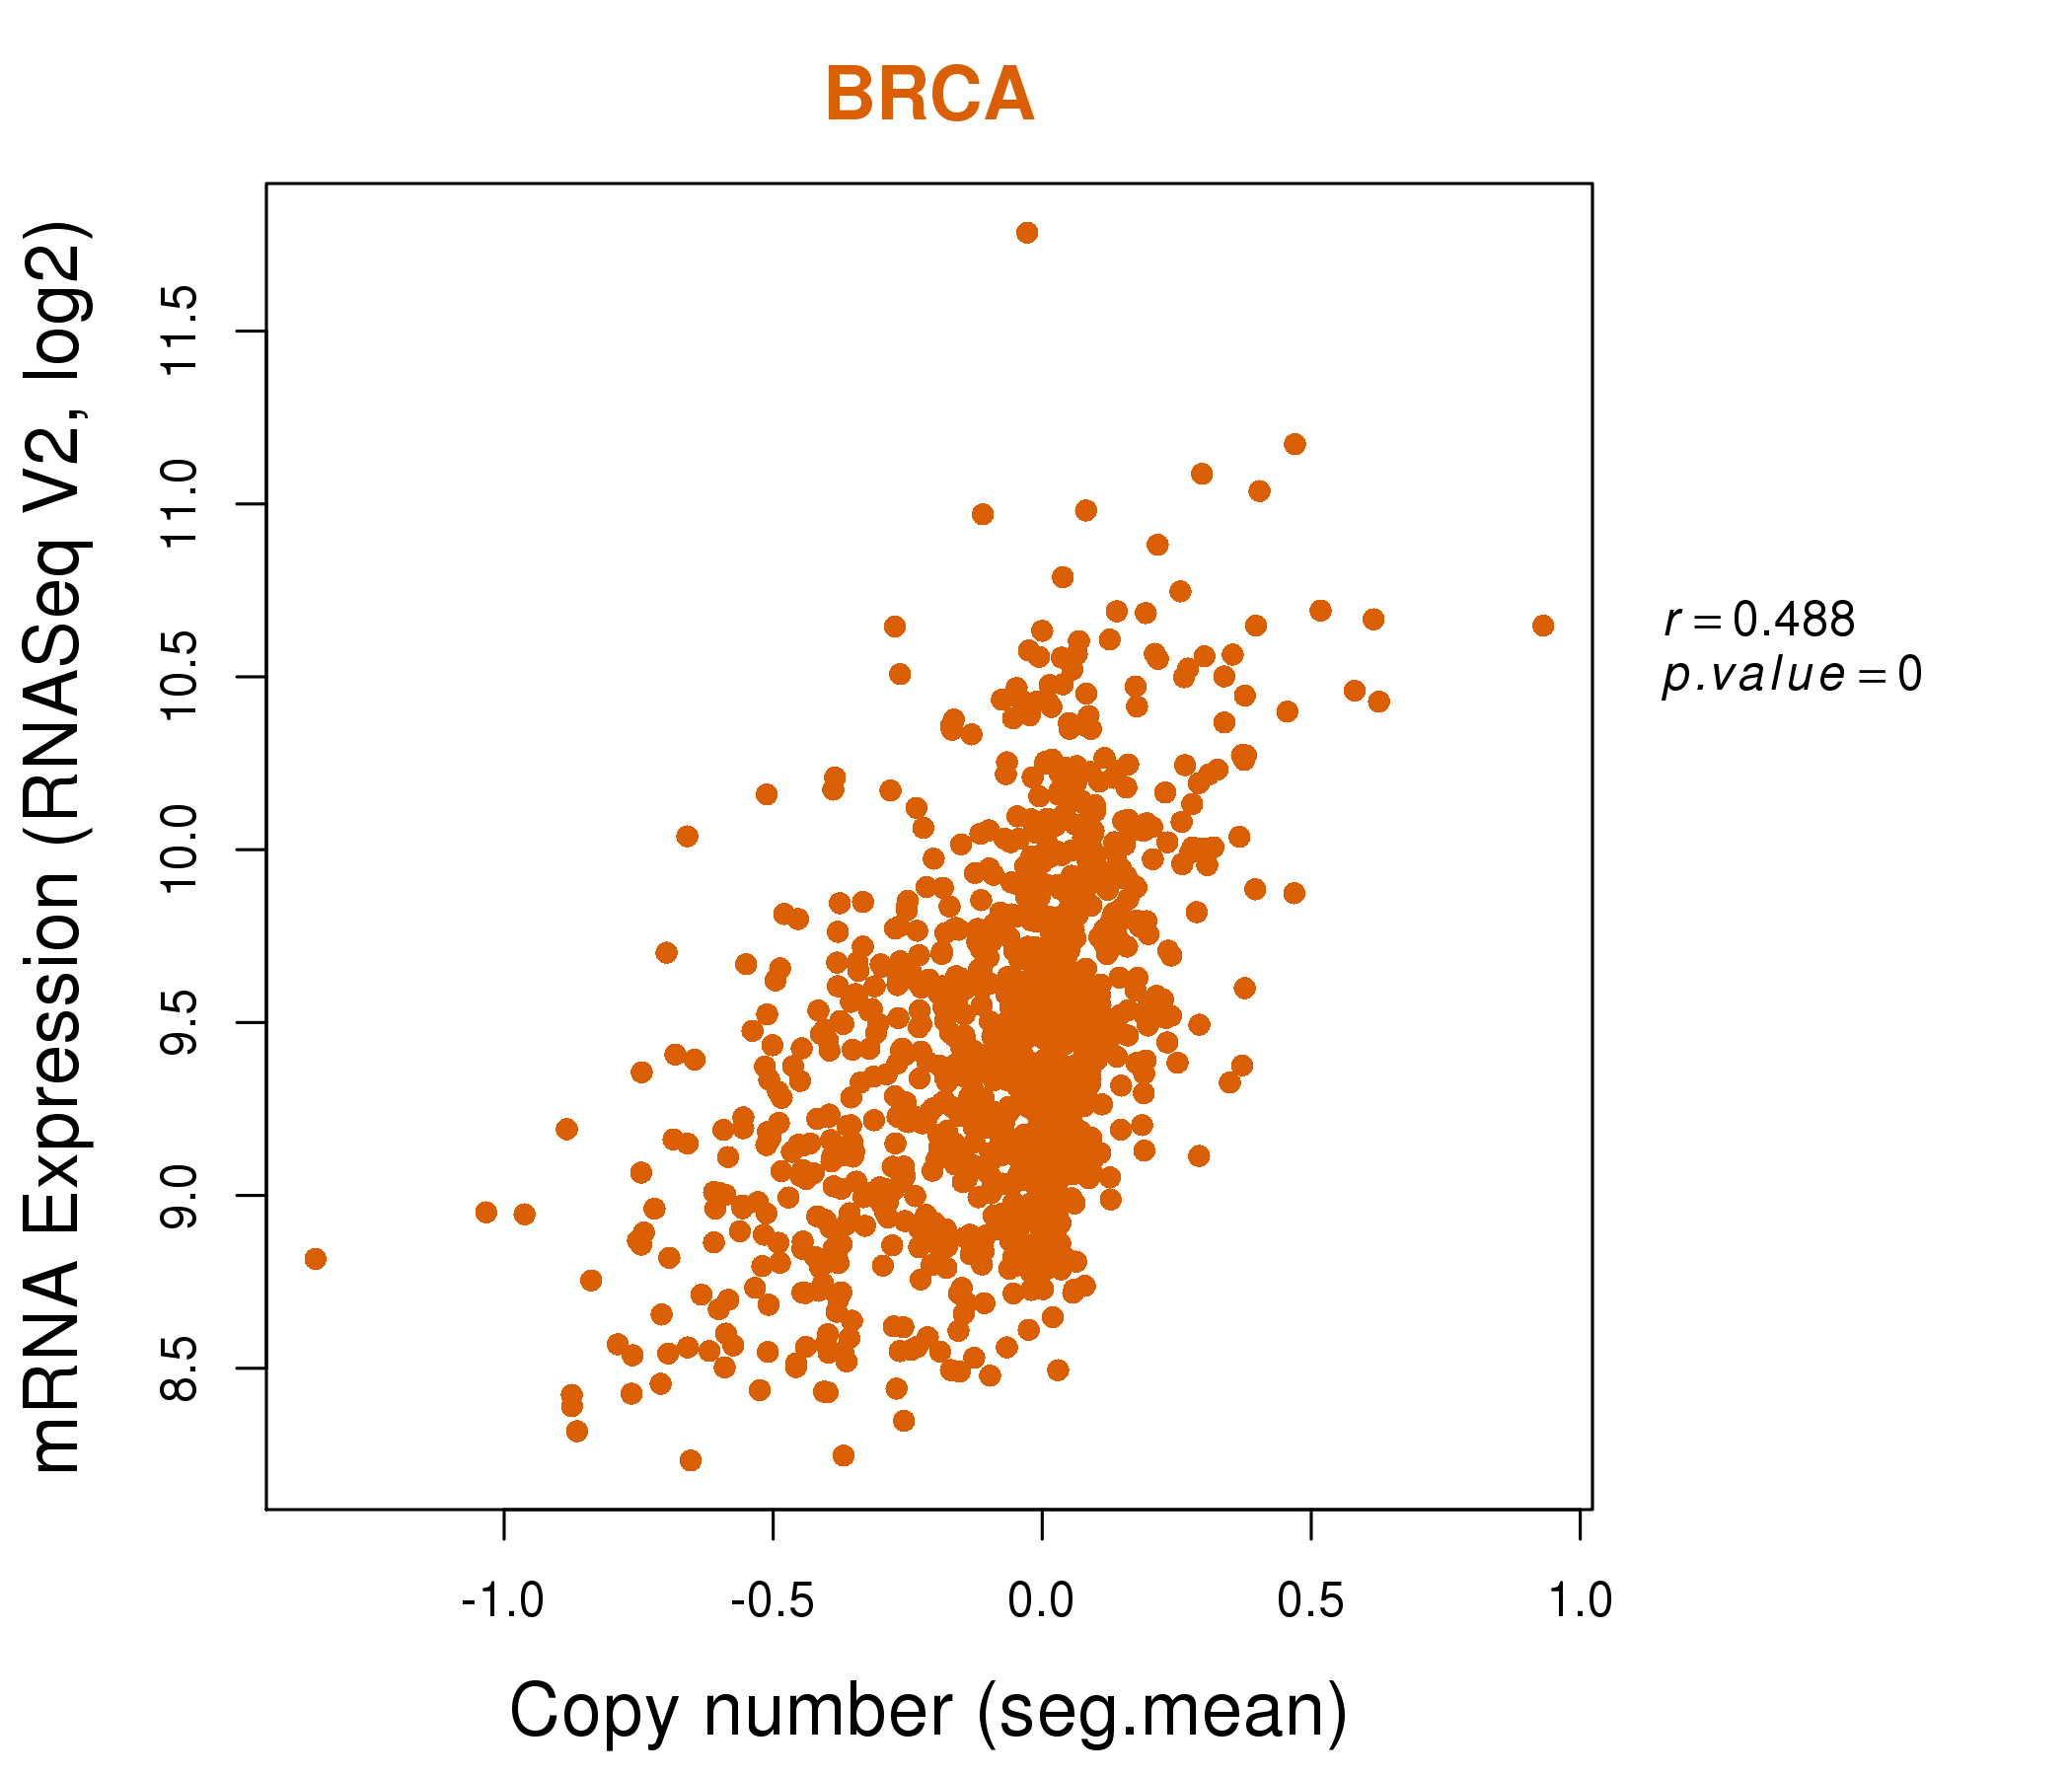
| * Copy number data were extracted from TCGA using R package TCGA-Assembler. The URLs of all public data files on TCGA DCC data server were gathered on Jan-05-2015. Function ProcessCNAData in TCGA-Assembler package was used to obtain gene-level copy number value which is calculated as the average copy number of the genomic region of a gene. |
 |
| cf) Tissue ID[Tissue type]: BLCA[Bladder Urothelial Carcinoma], BRCA[Breast invasive carcinoma], CESC[Cervical squamous cell carcinoma and endocervical adenocarcinoma], COAD[Colon adenocarcinoma], GBM[Glioblastoma multiforme], Glioma Low Grade, HNSC[Head and Neck squamous cell carcinoma], KICH[Kidney Chromophobe], KIRC[Kidney renal clear cell carcinoma], KIRP[Kidney renal papillary cell carcinoma], LAML[Acute Myeloid Leukemia], LUAD[Lung adenocarcinoma], LUSC[Lung squamous cell carcinoma], OV[Ovarian serous cystadenocarcinoma ], PAAD[Pancreatic adenocarcinoma], PRAD[Prostate adenocarcinoma], SKCM[Skin Cutaneous Melanoma], STAD[Stomach adenocarcinoma], THCA[Thyroid carcinoma], UCEC[Uterine Corpus Endometrial Carcinoma] |
| Top |
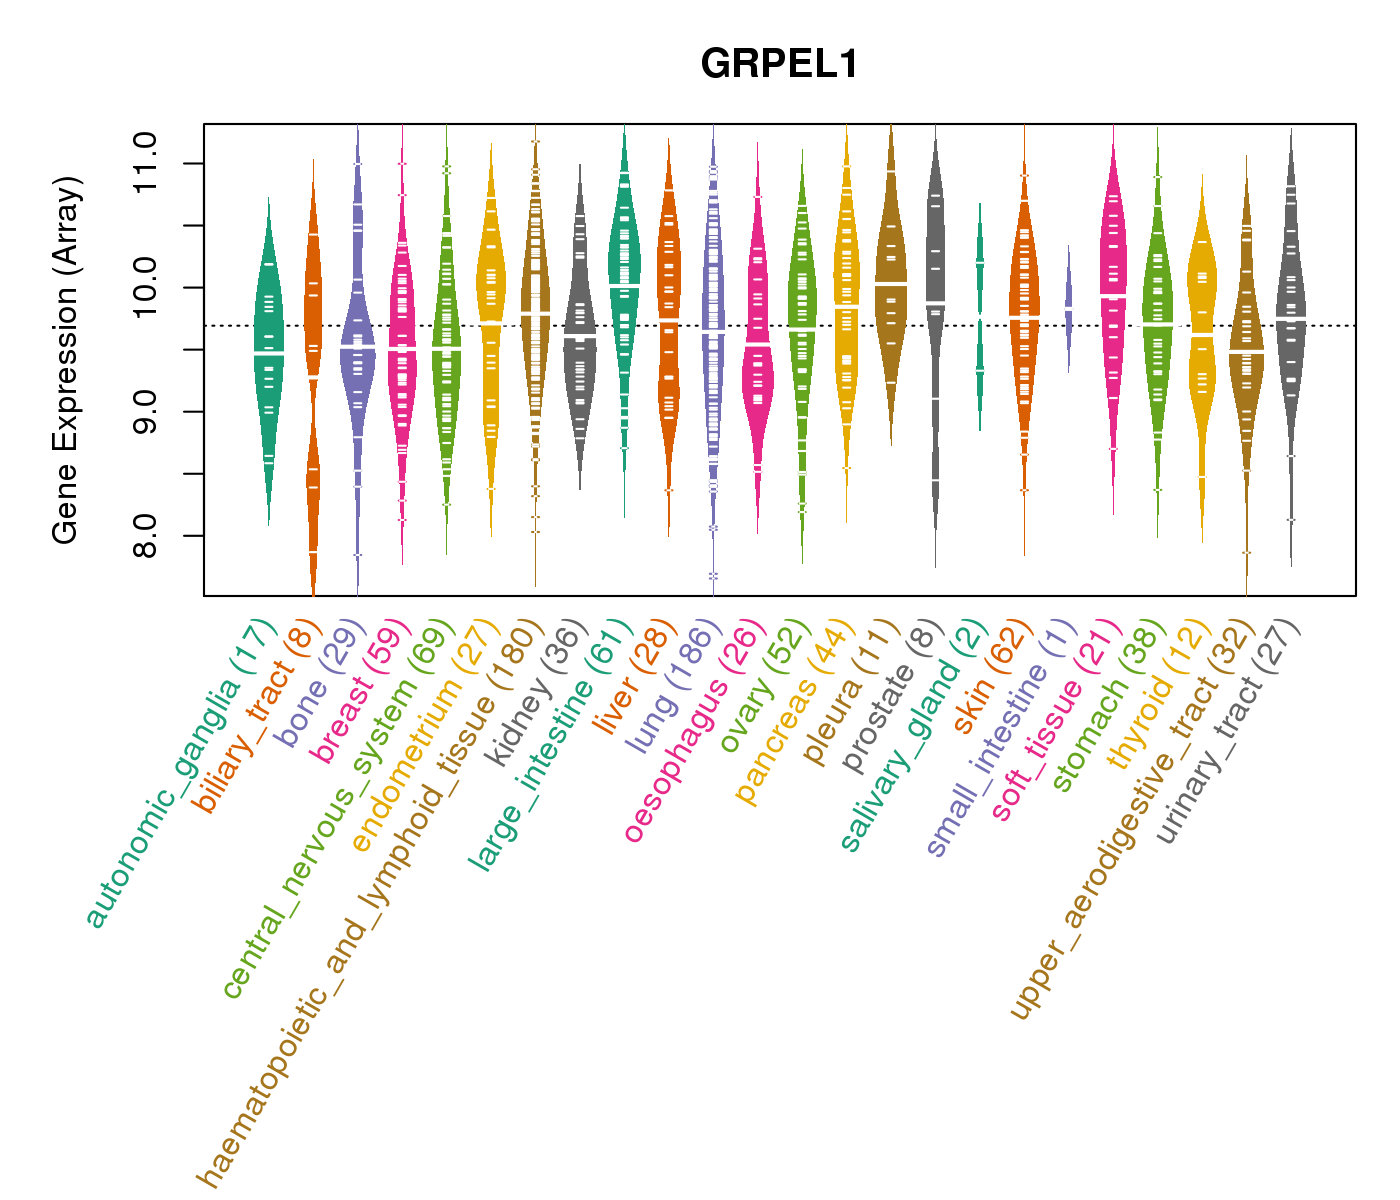
| Gene Expression for GRPEL1 |
| * CCLE gene expression data were extracted from CCLE_Expression_Entrez_2012-10-18.res: Gene-centric RMA-normalized mRNA expression data. |
 |
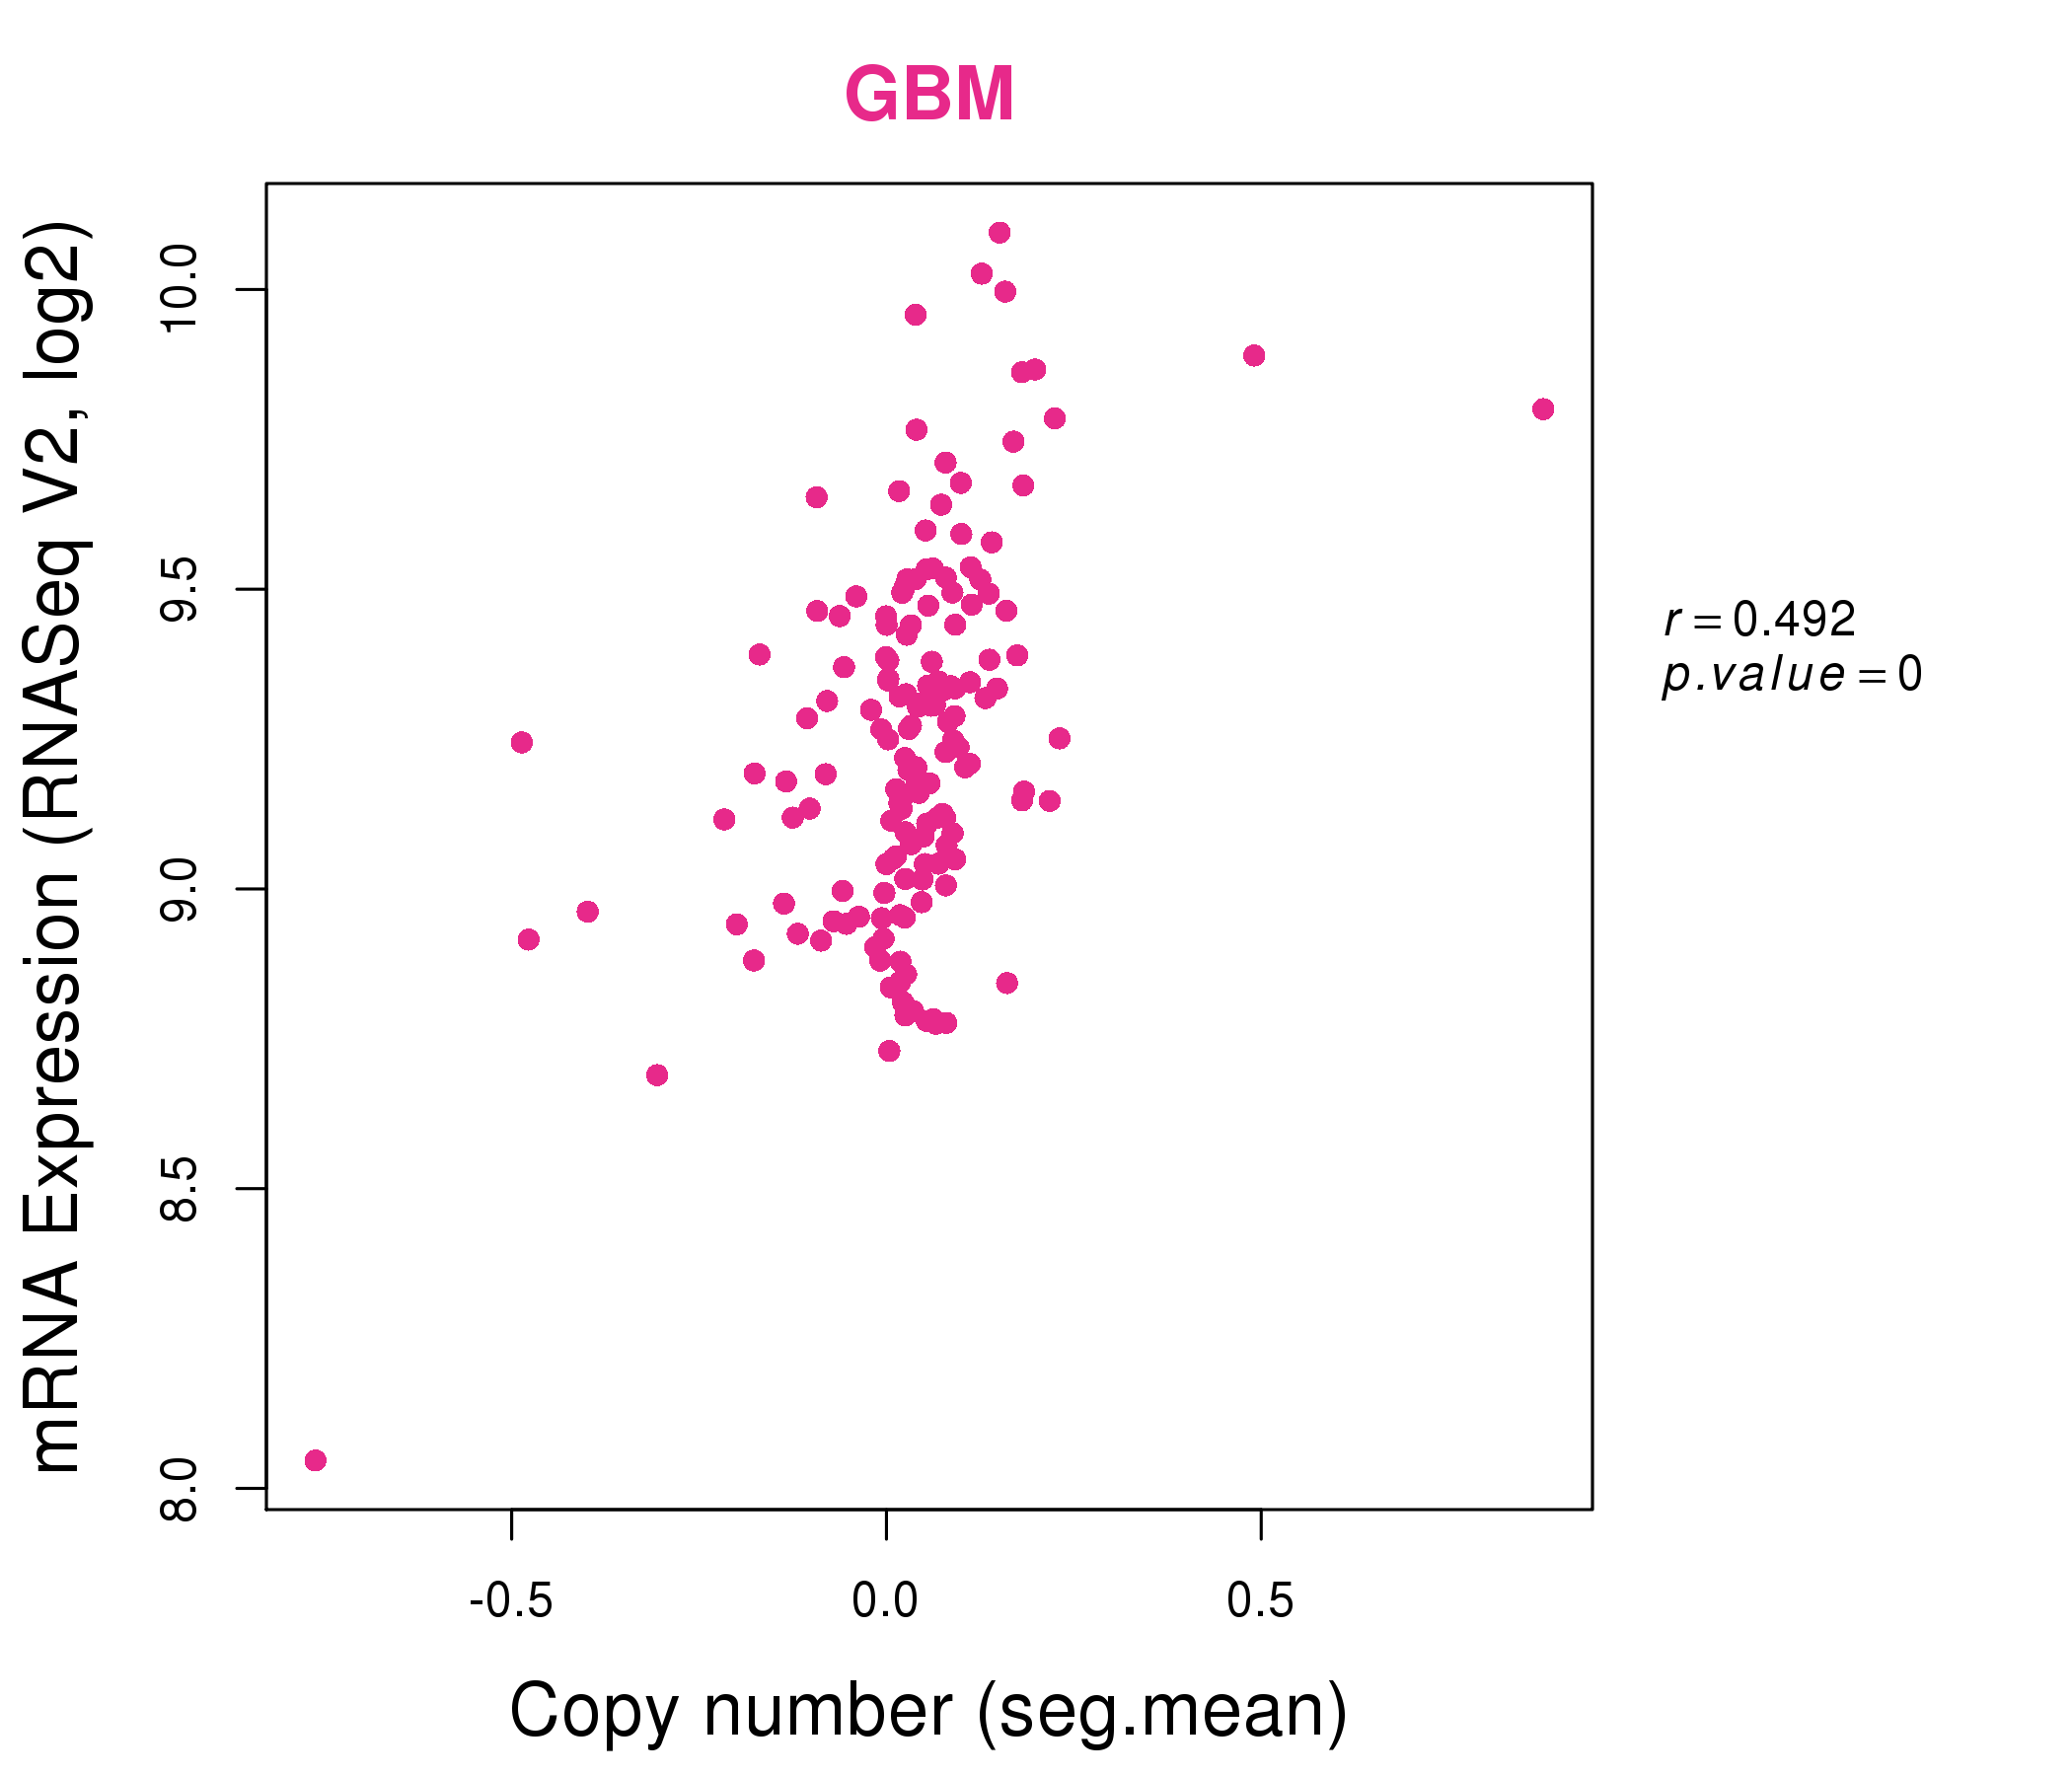
| * Normalized gene expression data of RNASeqV2 was extracted from TCGA using R package TCGA-Assembler. The URLs of all public data files on TCGA DCC data server were gathered at Jan-05-2015. Only eight cancer types have enough normal control samples for differential expression analysis. (t test, adjusted p<0.05 (using Benjamini-Hochberg FDR)) |
 |
| Top |
| * This plots show the correlation between CNV and gene expression. |
: Open all plots for all cancer types
 |
|
 |
|
| Top |
| Gene-Gene Network Information |
| * Co-Expression network figures were drawn using R package igraph. Only the top 20 genes with the highest correlations were shown. Red circle: input gene, orange circle: cell metabolism gene, sky circle: other gene |
: Open all plots for all cancer types
 |
|
| ATP5I,HYPK,CCT7,BLOC1S4,COX6A1,CYC1,GRPEL1, ICT1,LETM1,LOC93622,LYAR,MRFAP1,MRPS7,NOP14, PA2G4,PDF,PRDX1,PYCRL,SOD1,TALDO1,TCEB1 | AIFM1,MPC2,COX14,C21orf33,GUCD1,COX5B,CRAT, ECH1,ETFA,GRPEL1,ICT1,IDH3B,LDHD,MKNK2, MRPS7,NDUFA6,NDUFA8,NDUFAF1,NDUFV3,PCCB,ECI2 |
 |
|
| ATP5I,BOLA3,C14orf2,CHCHD4,EIF3I,GRPEL1,GRSF1, H2AFZ,LYAR,MRPL12,NOP14,NOP16,PA2G4,PAICS, QDPR,RANBP1,SFXN4,SLBP,SLC25A39,TMEM33,TOMM40 | ALG8,APOO,CCT5,CCT8,CENPN,COQ2,DDX52, EIF4A3,FAM136A,GRPEL1,MARS2,NIFK,NIP7,NOP16, PLEK2,PMM2,SEH1L,TMX2,UBXN8,UMPS,ZPR1 |

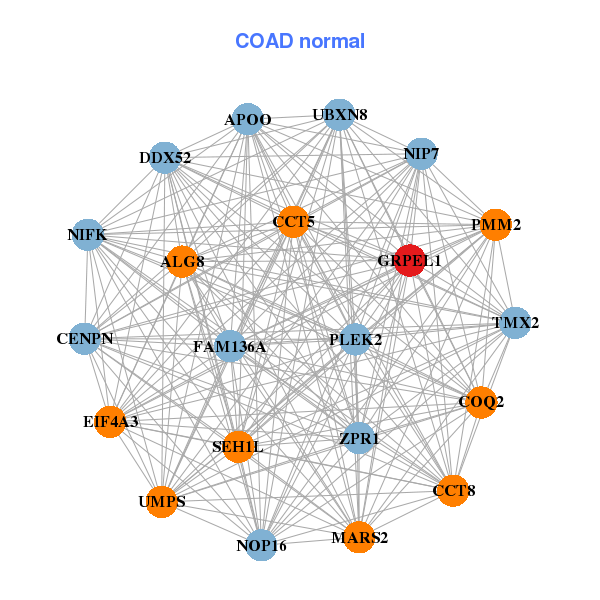
| * Co-Expression network figures were drawn using R package igraph. Only the top 20 genes with the highest correlations were shown. Red circle: input gene, orange circle: cell metabolism gene, sky circle: other gene |
: Open all plots for all cancer types
| Top |
: Open all interacting genes' information including KEGG pathway for all interacting genes from DAVID
| Top |
| Pharmacological Information for GRPEL1 |
| There's no related Drug. |
| Top |
| Cross referenced IDs for GRPEL1 |
| * We obtained these cross-references from Uniprot database. It covers 150 different DBs, 18 categories. http://www.uniprot.org/help/cross_references_section |
: Open all cross reference information
|
Copyright © 2016-Present - The Univsersity of Texas Health Science Center at Houston @ |